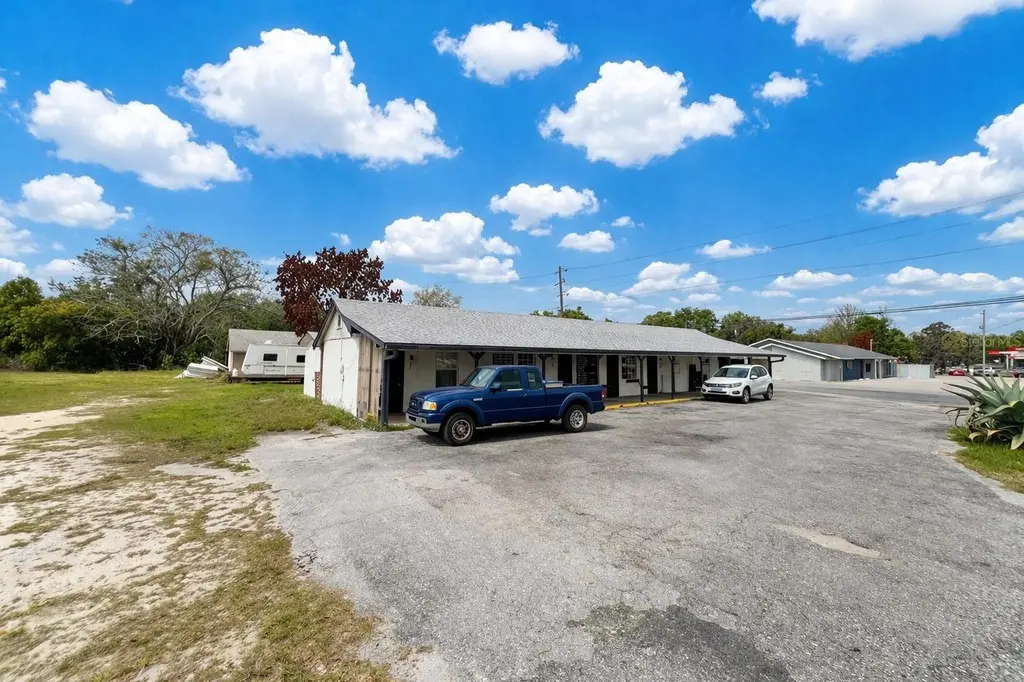
 Fourplex
617 E Myers Blvd · Mascotte, FL
Flood risk 1/10 · Minimal
- FEMA flood zone
- X (unshaded)
- Chance of flooding over 30 yrs
- 0.0%
- Est. flood insurance / yr
- $507 – $1,088
Fire risk 6/10 · Moderate
- Est. fire insurance / yr
- $947 – $1,759
Heat risk 8/10 · Major
- Hot days now (above 108°F)
- 6 days/yr
- Hot days in 30 yrs
- 20 days/yr
Wind risk 9/10 · Severe
- Chance of severe wind over 30 yrs
- 99.0%
Air-quality risk 1/10 · Minimal
- Unhealthy air days now
- 0 days/yr
- Unhealthy air days in 30 yrs
- 0 days/yr
Risk factors via First Street. Map © Google.
Why this score? — see what drove the D grade
The composite is a weighted blend of 9 inputs, each scored 0–100. Each bar is that input's sub-score; the figure is the points it added to the 100-point composite (weight × sub-score).
- Appreciation +10.0/10.0
- Cash flow +8.8/30.0
- ARV discount +7.5/15.0
- Schools +4.2/10.0
- Livability +3.6/5.0
- Rent growth +2.5/5.0
- Condition / age +2.5/5.0
- DSCR +2.4/10.0
- 1% rule +1.9/10.0
$850,000
🖨 Deal sheet (PDF) 📄 Offer letter ✓ Due diligence
Multi-family units
County records classify this as Multi-Family (5+ Unit). Listing-text estimate: 4 units. estimate disagrees with records
5+ unit building — per-unit beds/baths from public records are typically unavailable; the breakdown below (if shown) is an estimate from the listing text.
Listing remarks MLS
PREVIOUS MOTEL (2 EFFICIENCIES - $125/WK. EACH, 2 ROOMS, OFFICE & OWNERS 2/1 NOT RENTED), 2/1 DUPLEX - $500/MO. EACH & MOBILE HOME LOT RENT - $100/MO. ) INCOME FROM COIN OPERATED WASHER/DRYER MACHINES - $100-$200/MONTH.
Key facts
- Accessible location
- Mobile home
- Primary rental units
Tags
Property features AI
Finance
- Other: Living area reported as 4,388 sq ft
- Financial info: Annual net income: $5,456.60; Pro forma rents by unit type: 1-bedroom $2,950 (4 units), 2-bedroom $1,800 (3 units), 3-bedroom $1,200 (1 unit)
- HOA & community: No association
Exterior
- Utilities: Water from well; Septic tank sewer; Other utilities
- Home design: Residential income property (Triplex); One level; Property condition: Fixer; Zoned CG
- Construction: Construction materials: Other; Roof: Other; Foundation: Other
- Exterior features: Other exterior features; Three buildings on the property; Lot approximately 0.44 acres (60 x 207)
Interior
- Kitchen: No specific kitchen appliance details provided
- Bedrooms: 13 total bedrooms (across units)
- Bathrooms: Units include one bathroom each
- Heating & cooling: Other heating; Other cooling
- Interior features: Other interior features
- Laundry & utility: Laundry features: Other
Neighborhood map
What this means for you Summary
Snapshot
- This is a 4 × 1-bed/?-bath units multifamily listed at $850k.
Deal economics
- At list price, monthly cash flow is $-693 ($-8k/yr) — negative. Per door: $-173/mo.
- To cash-flow at today's rent, offer at most $728k (14.4% below list).
- To meet the 1% rule (rent ≥ 1% of price), the offer needs to be $584k (31.3% below list).
- Recommended offer: $584k (31.3% below list) — sets the bar for 1% rule.
Location & tenants
- Location reads 71/100 on livability (#405 in FL) — a middle-class / working-renter tenant base. Strengths: cost of living A+, housing A+, health & safety A+; Watch: amenities F, commute F.
- Lake (suburban): math 49% / reading 50% proficiency, ranked #37 of 73 in FL (top 51%) — families likely to look elsewhere, expect single-tenant / working-renter base with shorter leases.
- Zoned schools: Mascotte Elementary School (math 50% / reading 47%, grade D, #1,152 of 2,144 statewide, top 55%, 855 students, 62% FRL, charter); Gray Middle School (math 45% / reading 45%, grade D, #310 of 571 statewide, top 56%, 1,148 students, 47% FRL); South Lake High School (math 36% / reading 39%, grade F, #336 of 667 statewide, top 51%, 2,169 students, 40% FRL) — zoned schools at 50% FRL track the district average.
- Market conditions: 98 active listings in the ZIP; solid renter incomes; 4,799 units permitted in Lake County in 2024 (814 in 5+ unit buildings).
- At $5,842/mo this rent would consume 84% of the median local household income ($84k/yr) (locally 16% of renters already pay >50% of income on rent) — very limited rent-growth headroom before tenants either downsize or default.
Forward outlook
- In year one you build about $91k of equity ($6k loan paydown + $85k appreciation (10.0% local appreciation)).
- Lake County population projected at +37% by 2050 — long-run rental-demand tailwind backs the buy-and-hold thesis.
- By year 2, paydown + projected appreciation supports a ~$146k cash-out refi (75% LTV) — recoverable capital for the next deal without selling this one.
Negotiation context
- It's been on market 82 days — a 6% lower offer ($799k) is reasonable based on typical stale-listing flexibility.
- 13 sale attempts since 20y ago with the ask held roughly flat each time — persistent listings suggest the price (not the market) is what's stuck; bring a comps-based counter.
Risks & watch-outs
- Climate carrying-cost: severe wind risk, 99% chance of damaging wind over 30y; major wildfire risk; extreme-heat days projected 6→20/yr by 2055 (HVAC capex compounding) — expect insurance premiums to compound above CPI over the hold.
Questions for the listing agent
- What do current leases actually rent for vs. the listed asking? Can we see a recent rent roll and the last 12 months of T-12 income?
- It's been on market 82 days. Have you received any prior offers? Is the seller open to a 31% concession, seller financing, or rate buy-down credit?
- Can we see the unit-by-unit rent roll, current vacancy, and any below-market leases? What's the average tenancy length?
- What capital expenditures (roof, boiler, parking lot, exteriors) have been made in the last 5 years, and what's planned in the next 2?
- Built in 1973 — when were the roof, HVAC, electrical panel, plumbing, and water heater last replaced?
- Why hasn't it sold? Are there any deal-killer items the seller is aware of (foundation, flood, title, zoning, code violations)?
- Is there a deadline driving the sale (1031 exchange, divorce, estate, relocation)? That informs how much negotiation room exists.
- Schools are D-rated, which usually means shorter tenancies and higher turnover. Who's the typical renter profile here, and what's been the actual vacancy rate?
- The area grade is low — what's the realistic commute time and amenity access for the typical tenant pool here? Any planned neighborhood developments (good or bad) we should know about?
- What's the average days-on-market for RENTAL listings here right now (not sales)? A rising rental-DOM trend means longer vacancies and softer asking-rent achievability than the comps imply.
- What's the recent tenant-quality profile in this submarket — average credit score on applications, eviction rate, late-payment / NSF rate, and stable-employment percentage? A property-management company in the area should have these aggregated.
- How much new apartment / multifamily construction is in the pipeline within 1–3 miles? Heavy new supply (>2% of stock underway) typically softens rents 12–24 months out; light construction supports rent growth.
Investment metrics
- 1% rule
- 0.69% ✗
- Cap rate
- 5.31%
- Cash-on-cash
- -3.49%
- DSCR
- 0.84
- GRM
- 12.1
CMA / ARV
No comps found within radius.
Projected returns pro-forma
10.0% appreciation · 3.0% rent growth · sell at horizon
- IRR
- 21.8%
- Equity multiple
- 2.76×
- Total profit
- $418,546
- Equity at exit
- $765,747
- IRR
- 19.6%
- Equity multiple
- 6.32×
- Total profit
- $1,266,733
- Equity at exit
- $1,651,363
Cash invested: $238,000 (down + closing). Projections, not guarantees.
Landlord ↔ Tenant lean methodology
- Overall (STATE)
- 87 Strongly Landlord-Friendly
- State Florida
- 87 Strongly Landlord-Friendly · R+3
- County
- — inherits STATE
- City
- — inherits STATE
ZIP-level market 34753
- Home prices YoY
- 7.2%
- Active inventory
- 98
- Price-to-rent
- 48.5×
Monthly cashflow live
- Estimated rent
- $5,842 medium interval (Pro) →
- Mortgage (P&I)
- −$4,457
- Tax from tax record
- −$496 /mo · $5,956/yr
- Insurance
- −$354
- HOA
- −$0
- Vacancy / Maint / Mgmt
- −$1,227
- Net cashflow
- $-693
Break-even live
Sensitivity live
| Price | -10% $-212 | -5% $-452 | +0% $-693 | +5% $-933 | +10% $-1,174 |
|---|---|---|---|---|---|
| Rent | -10% $-1,154 | -5% $-924 | +0% $-693 | +5% $-462 | +10% $-231 |
| Rate | -1.0pp $-265 | -0.5pp $-477 | base $-693 | +0.5pp $-913 | +1.0pp $-1,137 |
4-unit breakdown (identical units grouped — click to expand)
| Units | Beds | Baths | Est. rent |
|---|---|---|---|
| 4× units | 1 | — | $5,840 |
| #1 | 1 | — | $1,460 |
| #2 | 1 | — | $1,460 |
| #3 | 1 | — | $1,460 |
| #4 | 1 | — | $1,460 |
| Total (4 units) | $5,842 | ||
UW: 25.0% down · 7.5% · 30yr · 1.5% tax · 5.0% vac · 8.0% maint · 8.0% mgmt
Financing live
Cash to close
- Down payment
- $212,500
- Closing costs
- $25,500
- Reserves months
- —
- Total cash needed
- —
Loan-product check · same deal, 3 products live
Conventional
25% down · 7.5% · 30yr
- Down + closing
- —
- Monthly P&I
- —
- Monthly cashflow
- —
- DSCR
- —
- Eligible?
- —
Personal DTI + credit; lowest rate.
DSCR
20% down · 8.5% · 30yr
- Down + closing
- —
- Monthly P&I
- —
- Monthly cashflow
- —
- DSCR
- —
- Eligible?
- —
No personal income docs; deal must DSCR.
Hard money
10% down · 12.0% · 12mo
- Down + closing
- —
- Monthly P&I
- —
- Monthly cashflow
- —
- DSCR
- —
- Eligible?
- —
Short-term bridge; refi at stabilization.
Listing history 42 events
-
2026-06-21days on market $850,000 Active 82 DOM
-
2026-06-18days on market $850,000 Active 79 DOM
-
2026-06-17days on market $850,000 Active 78 DOM
-
2026-06-16days on market $850,000 Active 77 DOM
-
2026-06-15days on market $850,000 Active 76 DOM
-
2026-06-13days on market $850,000 Active 74 DOM
-
2026-06-09days on market $850,000 Active 70 DOM
-
2026-06-08days on market $850,000 Active 69 DOM
-
2026-06-07days on market $850,000 Active 68 DOM
-
2026-06-04days on market $850,000 Active 65 DOM
-
2026-06-03days on market $850,000 Active 64 DOM
-
2026-06-02days on market $850,000 Active 63 DOM
-
2026-06-01days on market $850,000 Active 62 DOM
-
2026-05-31days on market $850,000 Active 61 DOM
-
2026-03-31$850,000 Active
-
2026-02-09historical $900
-
2026-02-06$900
-
2025-01-10historical $750
-
2025-01-10$750
-
2025-01-08historical $750
-
2024-12-08$750
-
2024-12-01historical $750
-
2024-11-07historical $750
-
2024-11-07$750
-
2024-11-02$750
-
2024-11-02historical $750
-
2024-10-29historical $750
-
2024-10-28$750
-
2024-10-24$750
-
2024-10-17historical $920
-
2024-10-17historical $920
-
2024-10-17$920
-
2024-09-28historical $920
-
2024-09-28$920
-
2024-09-13$750
-
2024-09-11historical $750
-
2024-09-05$750
-
2024-07-23soldstatus $808,500
-
2007-10-30soldstatus $390,000
-
2007-01-05soldstatus $420,000
-
2006-12-13soldstatus $420,000 233-char remark
Show marketing remark (233 chars)
PREVIOUS MOTEL (2 EFFICIENCIES - $125/WK. EACH, 2 ROOMS, OFFICE & OWNERS 2/1 NOT RENTED), 2/1 DUPLEX - $500/MO. EACH & MOBILE HOME LOT RENT - $100/MO. ) INCOME FROM COIN OPERATED WASHER/DRYER MACHINES - $100-$200/MONTH.
-
2006-03-13$474,900 233-char remark
Show marketing remark (233 chars)
PREVIOUS MOTEL (2 EFFICIENCIES - $125/WK. EACH, 2 ROOMS, OFFICE & OWNERS 2/1 NOT RENTED), 2/1 DUPLEX - $500/MO. EACH & MOBILE HOME LOT RENT - $100/MO. ) INCOME FROM COIN OPERATED WASHER/DRYER MACHINES - $100-$200/MONTH.
ⓘ Source: listings_history table (triggers on properties + properties_extension) + one-shot
backfill from property_details.listing_events for pre-trigger history.
Tax reassessment forecast FL · Resets to sale price
- Current annual tax
- $5,956 · $496/mo
- Projected year-2 tax
- $7,055 · $588/mo
- Expected delta
- +$1,099/yr (+$92/mo · 18.4%)
ⓘ Screening estimate from a state-policy table — verify with the county assessor before closing.
Climate risk First Street
- Flood 1/10 Low FEMA zone X (unshaded) · 0% chance over 30 yrs
- Wildfire 6/10 Major
- Heat 8/10 Severe 6 d/yr ≥108°F today · 20 d/yr by 30 yrs out
- Wind 9/10 Extreme 99% chance of damaging wind over 30 yrs
- Air quality 1/10 Low 0 unhealthy d/yr today · 0 by 30 yrs out
Nearby sold comps map
Loading sold comps map…
Walkable amenities ~0.75 mi
Loading nearby amenities…
Taxation est. · year 1
- Rental income
- $70,104
- − Mortgage interest
- −$47,613
- − Property taxes
- −$5,956
- − Insurance
- −$4,250
- − Repairs & maintenance
- −$5,608
- − Management
- −$5,608
- − Depreciation
- −$24,727
- Taxable loss
- −$23,659
- Est. tax savings @ 24.0%
- +$5,678
- After-tax cash flow
- $-2,636/yr
For passive investors: Depreciation is non-cash, so a rental often shows a tax loss while cash-flowing — sheltering income. Rental losses are passive: they offset passive income freely, and up to $25,000/yr can offset ordinary (W-2) income if you actively participate and your MAGI is under $100k (phasing out to $0 by $150k); unused losses carry forward. On sale, claimed depreciation is recaptured at up to 25%, and gains may owe capital-gains tax (a 1031 exchange can defer both). Figures are a year-1 estimate at your 24.0% rate — not tax advice; consult a CPA.
Schools (NCES district)
- District
- Lake
- NCES district ID
- 1201050
- Math proficiency
- 49% ▼ -7.00%
- Reading proficiency
- 50% ▼ -4.00%
- Median HH income
- $46,632
- Composite
- 42.05/100
- National rank
- #3327
- State rank
- #37 of 73 in FL
Livability — Mascotte
- Score
- 71/100
- State rank
- #405
- US rank
- #7156
Category grades
Schools grade is shown separately in the Schools card above.
Census & demographics
- Census place
- Mascotte, FL
- County
- Lake County · 364,602 people
- City population
- 33,565
- Metro
- Orlando-Kissimmee-Sanford, FL
- Population (ZIP)
- 7,985
- Household income
- $83,868
- Rent vs Own
- Severe rent burden
- 16.0
Population outlook (Lake County) Hauer SSP2
- Today (2025)
- 386,640 people
- By 2030
- 417,107 · +7.9%
- By 2040
- 476,676 · +23.3%
- By 2050
- 531,296 · +37.4%
- By 2075
- 648,303 · +67.7%
- By 2100
- 698,530 · +80.7%
Race, ethnicity, and origin ACS 2023
- Neighborhood character
- Diverse neighborhood (Simpson 0.69)
- Race & ethnicity
- White 38% Hispanic / Latino 35% Two or more races 25% Black 20% Asian 3%
- Hispanic origin (detail)
- Mexican 11% Puerto Rican 12% Dominican 2%
- Common ancestry
- Slovak 1% Serbian 1% Romanian 1%
- Foreign-born
- 10% · Canada, Jamaica
- Languages at home
- 67% English-only · Spanish 32%
Political lean MEDSL · Lake
- 2024 margin
- Strong R (+24.7) · D 37.3% · R 62.0%
- 2008→2024 swing
- -11.2pp toward R · 2008: -13.5pp · 2024: -24.7pp
- All cycles
- 2024: R+24.7 2020: R+20.0 2016: R+23.1 2012: R+17.1 2008: R+13.5
Not yet ingested
- Civics
- —
Market trends
- HPI YoY
- ▲ 19.01%
- Current HPI
- 281.96
- Rent YoY
- —
- Metro
- Orlando-Kissimmee-Sanford, FL
- State GDP YoY
- ▲ 3.28%
- F500 in state
- 36
Industry mix (Fortune 500 HQ in FL)
| Industry | F500 HQs | Revenue |
|---|---|---|
| Industrial Technology | 2 | $29B |
|
||
| Insurance | 2 | $17B |
|
||
| Retail | 1 | $60B |
|
||
| Technology Distribution | 1 | $58B |
|
||
| Homebuilding | 1 | $35B |
|
||
| Technology Manufacturing | 1 | $35B |
|
||
Price history
+79.0% since first listed28 events — show timeline
- 2026-03-31 Listed $850,000 Stellar MLS as Distributed by MLS Grid
- 2026-02-09 Rental Removed $900 RENTALBEAST
- 2026-02-06 Listed for Rent $900 RENTALBEAST
- 2025-01-10 Rental Removed $750 RENTALBEAST
- 2025-01-10 Listed for Rent $750 RENTALBEAST
- 2025-01-08 Rental Removed $750 LEASESTAR
- 2024-12-08 Listed for Rent $750 LEASESTAR
- 2024-12-01 Rental Removed $750 LEASESTAR
- 2024-11-07 Rental Removed $750 RENTALBEAST
- 2024-11-07 Listed for Rent $750 LEASESTAR
- 2024-11-02 Listed for Rent $750 RENTALBEAST
- 2024-11-02 Rental Removed $750 LEASESTAR
- 2024-10-29 Rental Removed $750 RENTALBEAST
- 2024-10-28 Listed for Rent $750 RENTALBEAST
- 2024-10-24 Listed for Rent $750 LEASESTAR
- 2024-10-17 Rental Removed $920 LEASESTAR
- 2024-10-17 Rental Removed $920 RENTALBEAST
- 2024-10-17 Listed for Rent $920 LEASESTAR
- 2024-09-28 Rental Removed $920 RENTALBEAST
- 2024-09-28 Listed for Rent $920 RENTALBEAST
- 2024-09-13 Listed for Rent $750 RENTALBEAST
- 2024-09-11 Rental Removed $750 RENTALBEAST
- 2024-09-05 Listed for Rent $750 RENTALBEAST
- 2024-07-23 Sold (Public Records) $808,500 Public Records
- 2007-10-30 Sold (Public Records) $390,000 Public Records
- 2007-01-05 Sold (Public Records) $420,000 Public Records
- 2006-12-13 Sold (MLS) $420,000 Stellar MLS as Distributed by MLS Grid
- 2006-03-13 Listed $474,900 Stellar MLS as Distributed by MLS Grid
Property tax history
+1.6%/yrLatest (2025): $5,956 · -13.5% YoY. Source: county tax records.
Cash-flow waterfall
monthlySold comps — $/sqft
last 12 mo · ≤1 miLoading sold comps…