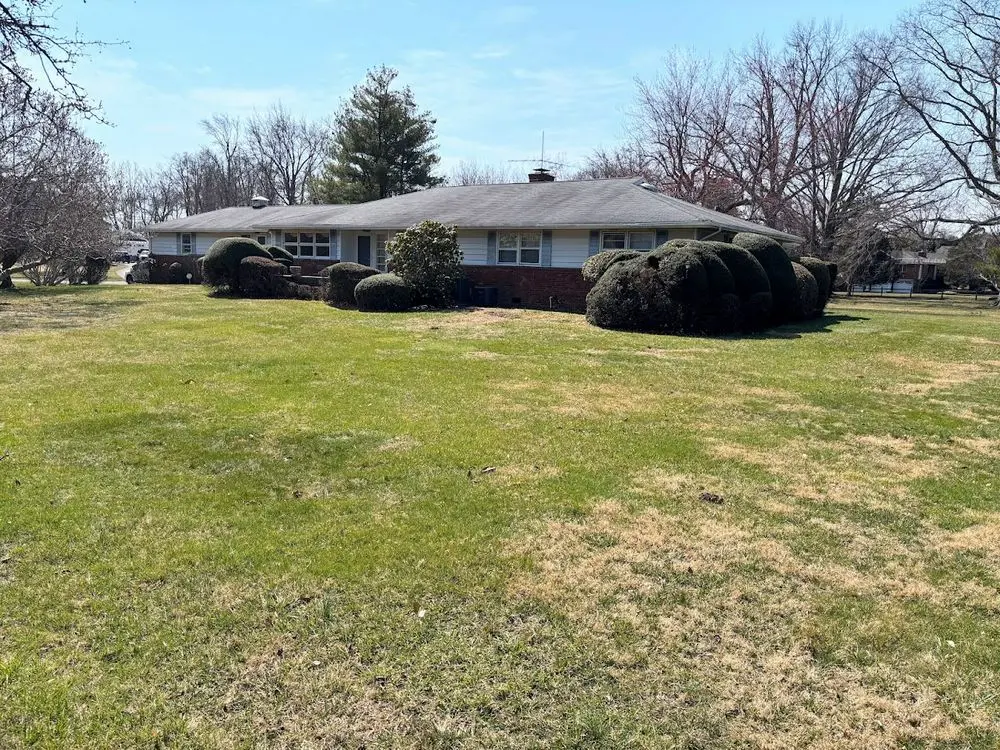
170 Bingham Ave · Rumson, NJ
Flood risk 6/10 · Moderate
- FEMA flood zone
- AE
- Chance of flooding over 30 yrs
- 0.87%
- Est. flood insurance / yr
- $1,737 – $8,500
Fire risk 1/10 · Minimal
- Est. fire insurance / yr
- $526 – $976
Heat risk 7/10 · Major
- Hot days now (above 93°F)
- 7 days/yr
- Hot days in 30 yrs
- 16 days/yr
Wind risk 8/10 · Major
- Chance of severe wind over 30 yrs
- 80.0%
Air-quality risk 4/10 · Minor
- Unhealthy air days now
- 3 days/yr
- Unhealthy air days in 30 yrs
- 5 days/yr
Risk factors via First Street. Map © Google.
Why this score? — see what drove the C grade
The composite is a weighted blend of 9 inputs, each scored 0–100. Each bar is that input's sub-score; the figure is the points it added to the 100-point composite (weight × sub-score).
- Cash flow +20.1/30.0
- ARV discount +9.1/15.0
- Schools +6.9/10.0
- DSCR +6.4/10.0
- 1% rule +4.6/10.0
- Livability +3.4/5.0
- Rent growth +2.5/5.0
- Condition / age +2.5/5.0
- Appreciation +0.0/10.0
$2,100,000
🖨 Deal sheet 📄 Offer letter ✓ Due diligence
Listing remarks
For Sale: Classic 1955 Ranch with Modern Potential 2900 sq ft | 5 Bedrooms | 3.5 Bathrooms Prime Location in a Highly Desirable Neighborhood --- * * Property Highlights * * * * Spacious Layout: * * 2,900 square feet of classic ranch-style living, offering ample space for family life or creative renovation. * * Bedrooms & Bathrooms: * * 5 bedrooms and 3.5 bathrooms, perfect for multi-generational living or guest accommodations. * * Prime Location: * * Nestled in a sought-after neighborhood surrounded by newer, higher-value homes, offering both prestige and potential. * * Blank Canvas: * * A unique opportunity to upgrade, remodel, or re-construct to match your dre
Key facts
- 1.5 acre lot
- Built 1955
- Listed 2 days
Tags
Property features AI
Exterior
- Home design: Single-family house
- Construction: Living area approximately 2,934
- Exterior features: Property sits on a 1.5-acre lot
Neighborhood map
What this means for you Summary
Snapshot
- This is a 5-bed/3.5-bath single-family listed at $2.10M.
Deal economics
- At list price, monthly cash flow is $2k ($26k/yr) — positive.
- The deal already cash-flows at list — no discount required.
- To meet the 1% rule (rent ≥ 1% of price), the offer needs to be $2.02M (3.8% below list).
- Recommended offer: $2.02M (3.8% below list) — sets the bar for 1% rule.
- Cap rate 7.8% vs local median 3.6% in Rumson — top-decile yield for the area; either an underpriced asset or a hidden risk that comps aren't pricing in. Stress-test before assuming the spread holds.
Location & tenants
- Location reads 67/100 on livability (#326 in NJ) — a middle-class / working-renter tenant base. Strengths: schools A+, crime A+, employment A+; Watch: amenities F, commute F, cost of living F.
- Rumson-Fair Haven Regional High School District (suburban): math 64% / reading 75% proficiency, ranked #82 of 612 in NJ (top 13%) — acceptable for families but not a draw, mixed tenant base, ~2y average lease.
- Market conditions: 80 active listings in the ZIP; 2 comparable units currently listed for rent nearby; 2,840 units permitted in Monmouth County in 2024 (484 in 5+ unit buildings).
Forward outlook
- Local home prices are declining (-3.0%/yr); year-one equity from $15k of loan paydown is wiped out by about $63k of value loss. Plan a longer hold.
- Monmouth County population projected at -11% by 2050 — secular population decline; favor cash flow + early exit over multi-decade hold.
Negotiation context
- Only 3 days on market — expect competitive offers; lowballing is unlikely to land.
Risks & watch-outs
- Watch-outs: flood insurance adds $427/mo; built in 1955 — expect roof / HVAC / electrical / plumbing capex.
- Climate carrying-cost: in FEMA flood zone AE (mandatory federal flood insurance); severe wind risk, 80% chance of damaging wind over 30y; extreme-heat days projected 7→16/yr by 2055 (HVAC capex compounding) — expect insurance premiums to compound above CPI over the hold.
Questions for the listing agent
- Built in 1955 — when were the roof, HVAC, electrical panel, plumbing, and water heater last replaced?
- What's the actual annual flood-insurance premium (NFIP or private), and is the property in a SFHA with mandatory coverage?
- Is there a deadline driving the sale (1031 exchange, divorce, estate, relocation)? That informs how much negotiation room exists.
- Schools are A-rated — typically a magnet for longer-tenancy family renters. What's the average tenant stay here, and is there a school-zone premium baked into asking?
- What's the average days-on-market for RENTAL listings here right now (not sales)? A rising rental-DOM trend means longer vacancies and softer asking-rent achievability than the comps imply.
- What's the recent tenant-quality profile in this submarket — average credit score on applications, eviction rate, late-payment / NSF rate, and stable-employment percentage? A property-management company in the area should have these aggregated.
- How much new for-sale + rental construction is in the pipeline within 1–3 miles? Heavy new supply typically softens prices + rents 12–24 months out; constrained supply supports both.
Investment metrics
- 1% rule
- 0.96% ✗
- Cap rate
- 7.78%
- Cash-on-cash
- 5.32%
- DSCR
- 1.24
- GRM
- 8.7
CMA / ARV
- ARV (on-the-fly)
- $2,177,028
- Comps found
- 1
Show comp detail 1 sale within ~0.75 mi
| Address | Dist | Beds/Ba | Sqft | Sold | Price | $/sf | Match |
|---|---|---|---|---|---|---|---|
| 15 Monmouth Ave | 0.66mi | 4/3.5 (-1) | 3,064 (+4%) | 10mo | $2,275,000 | $742 | 48 |
Match score weights: distance 35% · size 25% · config 20% · recency 20%. Top-matched comps best support the ARV.
Projected returns pro-forma
-3.0% appreciation · 3.0% rent growth · sell at horizon
- IRR
- -9.4%
- Equity multiple
- 0.66×
- Total profit
- $-201,657
- Equity at exit
- $313,117
- IRR
- 0.1%
- Equity multiple
- 1.00×
- Total profit
- $2,497
- Equity at exit
- $181,570
Cash invested: $588,000 (down + closing). Projections, not guarantees.
Landlord ↔ Tenant lean methodology
- Overall (STATE)
- 21 Tenant-Leaning
- State New Jersey
- 21 Tenant-Leaning · D+6
- County
- — inherits STATE
- City
- — inherits STATE
ZIP-level market 07760
- Active inventory
- 80
- Price-to-rent
- 8.7×
Monthly cashflow live
- Estimated rent
- $20,193 medium interval (Pro) →
- Mortgage (P&I)
- −$11,013
- Tax from tax record
- −$1,459 /mo · $17,507/yr
- Insurance
- −$875
- Flood insurance flood zone
- −$427 /mo · $5,118/yr
- HOA
- −$0
- Vacancy / Maint / Mgmt
- −$4,240
- Net cashflow
- $2,179
Break-even live
UW: 25.0% down · 7.5% · 30yr · 1.5% tax · 5.0% vac · 8.0% maint · 8.0% mgmt
Financing live
Cash to close
- Down payment
- $525,000
- Closing costs
- $63,000
- Reserves months
- —
- Total cash needed
- —
Loan-product check · same deal, 3 products live
Conventional
25% down · 7.5% · 30yr
- Down + closing
- —
- Monthly P&I
- —
- Monthly cashflow
- —
- DSCR
- —
- Eligible?
- —
Personal DTI + credit; lowest rate.
DSCR
20% down · 8.5% · 30yr
- Down + closing
- —
- Monthly P&I
- —
- Monthly cashflow
- —
- DSCR
- —
- Eligible?
- —
No personal income docs; deal must DSCR.
Hard money
10% down · 12.0% · 12mo
- Down + closing
- —
- Monthly P&I
- —
- Monthly cashflow
- —
- DSCR
- —
- Eligible?
- —
Short-term bridge; refi at stabilization.
Rent comps 2 comps
| Address | Beds | Baths | Sqft | Rent | $/sqft | DOM | Units | Dist |
|---|---|---|---|---|---|---|---|---|
| 22 Center St Rumson, NJ | 4.0 | 2.0 | 3500 | $6,700 | $1.91 | 15d | 1 | 1.07mi |
| — Rumson, NJ | 4.0 | 3.5 | 3688 | $35,000 | $9.49 | 22d | 1 | 1.12mi |
Listing history 4 events
-
2026-06-07days on market $2,100,000 Active 3 DOM
-
2026-06-07days on market $2,100,000 Active 2 DOM
-
2026-06-04remarks 695-char remark
-
2026-06-04$2,100,000 Active 1 DOM
ⓘ Source: listings_history table (triggers on properties + properties_extension) + one-shot
backfill from property_details.listing_events for pre-trigger history.
Tax reassessment forecast NJ · Partial reset (capped growth)
- Current annual tax
- $17,507 · $1,459/mo
- Projected year-2 tax
- $34,898 · $2,908/mo
- Expected delta
- +$17,392/yr (+$1,449/mo · 99.3%)
ⓘ Screening estimate from a state-policy table — verify with the county assessor before closing.
Climate risk First Street
- Flood 6/10 Major FEMA zone AE · 87% chance over 30 yrs
- Wildfire 1/10 Low
- Heat 7/10 Severe 7 d/yr ≥93°F today · 16 d/yr by 30 yrs out
- Wind 8/10 Severe 80% chance of damaging wind over 30 yrs
- Air quality 4/10 Moderate 3 unhealthy d/yr today · 5 by 30 yrs out
Nearby sold comps map
Loading sold comps map…
Walkable amenities ~0.75 mi
Loading nearby amenities…
Taxation est. · year 1
- Rental income
- $242,310
- − Mortgage interest
- −$117,633
- − Property taxes
- −$17,507
- − Insurance
- −$15,618
- − Repairs & maintenance
- −$19,385
- − Management
- −$19,385
- − Depreciation
- −$61,091
- Taxable loss
- −$8,308
- Est. tax savings @ 24.0%
- +$1,994
- After-tax cash flow
- $28,142/yr
For passive investors: Depreciation is non-cash, so a rental often shows a tax loss while cash-flowing — sheltering income. Rental losses are passive: they offset passive income freely, and up to $25,000/yr can offset ordinary (W-2) income if you actively participate and your MAGI is under $100k (phasing out to $0 by $150k); unused losses carry forward. On sale, claimed depreciation is recaptured at up to 25%, and gains may owe capital-gains tax (a 1031 exchange can defer both). Figures are a year-1 estimate at your 24.0% rate — not tax advice; consult a CPA.
Schools (NCES district)
- District
- Rumson-Fair Haven Regional High School District
- NCES district ID
- 3414400
- Math proficiency
- 64% ▲ 20.00%
- Reading proficiency
- 75% ▲ 15.00%
- Median HH income
- $140,294
- Composite
- 68.77/100
- National rank
- #677
- State rank
- #82 of 612 in NJ
Livability — Rumson
- Score
- 67/100
- State rank
- #326
- US rank
- #10228
Category grades
Schools grade is shown separately in the Schools card above.
Census & demographics
- Census place
- Rumson, NJ
- City population
- 9,557
- Population (ZIP)
- 9,557
Population outlook (Monmouth County) Hauer SSP2
- Today (2025)
- 620,308 people
- By 2030
- 612,309 · -1.3%
- By 2040
- 587,297 · -5.3%
- By 2050
- 551,342 · -11.1%
- By 2075
- 472,934 · -23.8%
- By 2100
- 381,534 · -38.5%
Race, ethnicity, and origin ACS 2023
- Neighborhood character
- Predominantly White (94%)
- Race & ethnicity
- White 94% Hispanic / Latino 3% Two or more races 3%
- Common ancestry
- Romanian 5% Scotch-Irish 3% Italian 3%
- Foreign-born
- 5% · Canada
- Languages at home
- 94% English-only · Other Indo-European 2% Spanish 1% German/W. Germanic 1%
Political lean MEDSL · Monmouth
- 2024 margin
- R (+11.4) · D 43.4% · R 54.8% · Other 1.8%
- 2008→2024 swing
- -7.7pp toward R · 2008: -3.7pp · 2024: -11.4pp
- All cycles
- 2024: R+11.4 2020: R+2.8 2016: R+9.5 2012: R+5.5 2008: R+3.7
Not yet ingested
- Civics
- —
Market trends
- HPI YoY
- ▼ -567.27%
- Current HPI
- 369.2564
- Rent YoY
- —
- Metro
- —
- State GDP YoY
- ▲ 2.05%
- F500 in state
- 34
Industry mix (Fortune 500 HQ in NJ)
| Industry | F500 HQs | Revenue |
|---|---|---|
| Consumer Goods | 3 | $31B |
|
||
| Pharmaceuticals | 2 | $153B |
|
||
| Technology | 2 | $21B |
|
||
| Insurance | 2 | $20B |
|
||
| Healthcare | 2 | $19B |
|
||
| Financial Services | 1 | $70B |
|
||
Price history
1 event — show timeline
- 2026-06-04 Listed $2,100,000 ForSaleByOwner.com
Property tax history
+0.4%/yrLatest (2025): $17,507 · +0.6% YoY. Source: county tax records.
Cash-flow waterfall
monthlySold comps — $/sqft
last 12 mo · ≤1 miLoading sold comps…