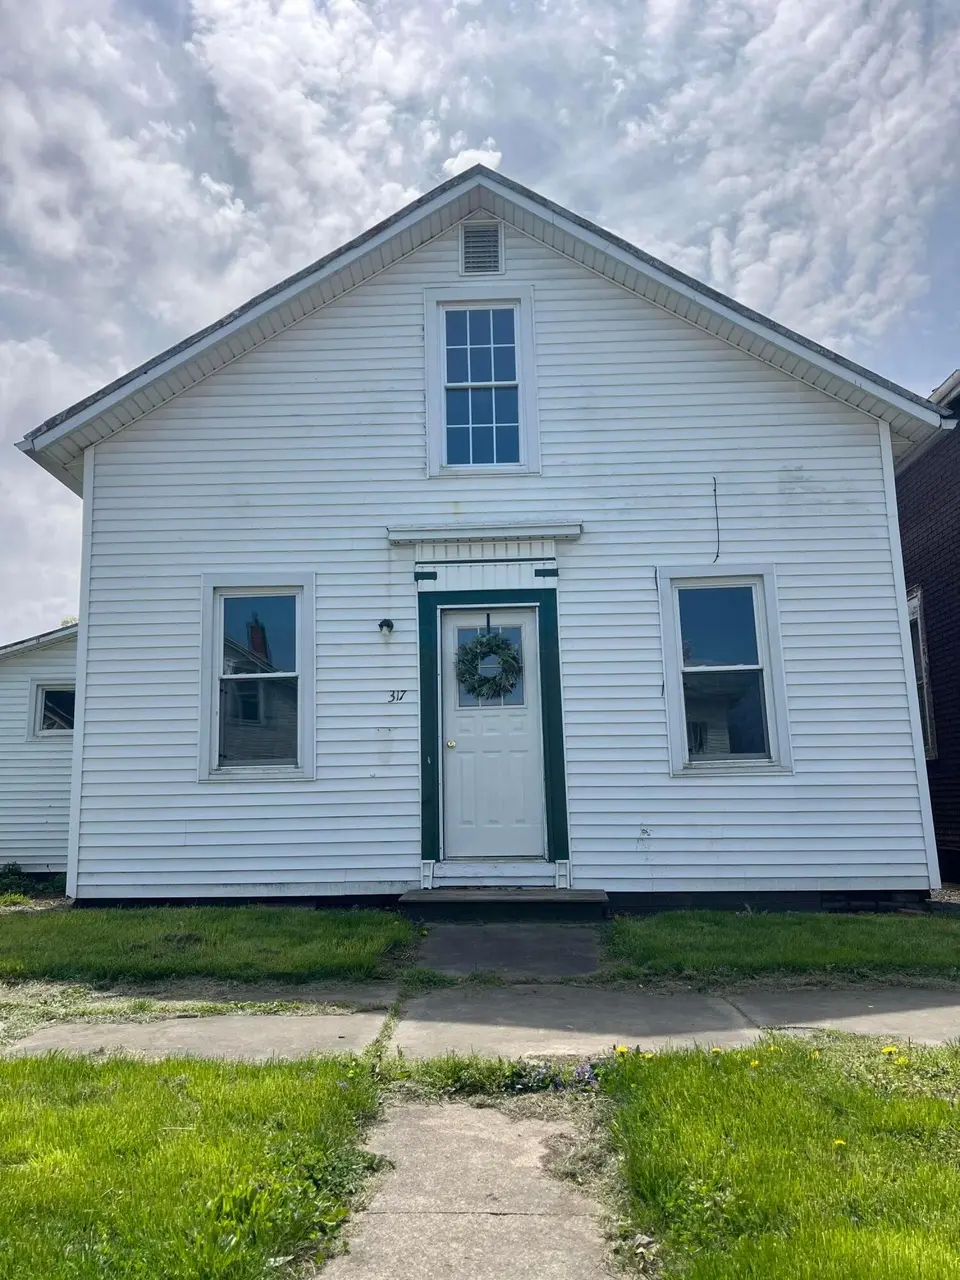
317 E Rensselaer St · Bucyrus, OH
Flood risk 1/10 · Minimal
- FEMA flood zone
- X (unshaded)
- Chance of flooding over 30 yrs
- 0.0%
- Est. flood insurance / yr
- $507 – $1,088
Fire risk 1/10 · Minimal
- Est. fire insurance / yr
- $713 – $1,323
Heat risk 3/10 · Minor
- Hot days now (above 98°F)
- 7 days/yr
- Hot days in 30 yrs
- 17 days/yr
Wind risk 2/10 · Minimal
- Chance of severe wind over 30 yrs
- —
Air-quality risk 2/10 · Minimal
- Unhealthy air days now
- 1 days/yr
- Unhealthy air days in 30 yrs
- 2 days/yr
Risk factors via First Street. Map © Google.
Why this score? — see what drove the F grade
The composite is a weighted blend of 9 inputs, each scored 0–100. Each bar is that input's sub-score; the figure is the points it added to the 100-point composite (weight × sub-score).
- Cash flow +12.2/30.0
- Livability +3.9/5.0
- DSCR +3.6/10.0
- Schools +3.4/10.0
- 1% rule +2.7/10.0
- Rent growth +2.5/5.0
- Condition / age +2.5/5.0
- ARV discount +0.0/15.0
- Appreciation +0.0/10.0
$122,000
🖨 Deal sheet 📄 Offer letter ✓ Due diligence
Listing remarks MLS
Ready for a house without the adventure of remodeling? Here is a sweet 3 bedroom, 1.5 baths ready to be financed by whichever government loan you would like to throw at them, along with a $2,000 appliance credit at closing. This one comes with no surprise expenses and affordable utility costs! An FHA dream already outfitted with GFCI outlets, newer windows, and newer furnace. Matching neutral tones and uniform flooring throughout will have you excited to throw in your belongings and get back to your best life. Start building equity and don't worry about calling for repairs, because you are set! Plenty of parking out back along with your spacious 2 car garage with separate doors and a maintenance free yard that won't take up summer activities that are right around the corner. This one may not be your forever home, but consider leveraging it as a stepping stone for the next one. Located only a few blocks away from local favorites; Mi Cerrito's, Baker's, and the Taphouse!
Key facts
- Plenty of parking
- Newer windows
- Gfci outlets
Tags
Neighborhood map
What this means for you Summary
Snapshot
- This is a 3-bed/1.5-bath single-family listed at $122k.
Deal economics
- At list price, monthly cash flow is $-24 ($-283/yr) — negative.
- To cash-flow at today's rent, offer at most $118k (3.4% below list).
- To meet the 1% rule (rent ≥ 1% of price), the offer needs to be $93k (23.4% below list).
- Recommended offer: $93k (23.4% below list) — sets the bar for 1% rule.
- Cap rate 6.1% vs local median 4.4% in Bucyrus — top-decile yield for the area; either an underpriced asset or a hidden risk that comps aren't pricing in. Stress-test before assuming the spread holds.
Location & tenants
- Location reads 78/100 on livability (#158 in OH, #2,388 nationally) — a middle-class / working-renter tenant base. Strengths: cost of living A+, housing A+, health & safety A+; Watch: employment D, amenities F, commute F.
- Bucyrus City (town): math 37% / reading 46% proficiency, ranked #537 of 656 in OH (top 82%) — families likely to look elsewhere, expect single-tenant / working-renter base with shorter leases.
- Market conditions: 81 active listings in the ZIP; 2 comparable units currently listed for rent nearby; 8 units permitted in Crawford County in 2024 (0 in 5+ unit buildings).
Forward outlook
- Local home prices are declining (-3.0%/yr); year-one equity from $843 of loan paydown is wiped out by about $4k of value loss. Plan a longer hold.
- Crawford County population projected at -22% by 2050 — secular population decline; favor cash flow + early exit over multi-decade hold.
Negotiation context
- It's been on market 107 days — a 9% lower offer ($111k) is reasonable based on typical stale-listing flexibility.
- 3 sale attempts since 2y ago; this cycle's ask has dropped $10k (8%) from the opening price — seller is motivated, your offer sets the floor, not the list.
- Current owner paid $54k; list at $122k implies a 128% gain — meaningful room to come down on a strong offer.
Risks & watch-outs
- Watch-outs: built in 1890 — expect roof / HVAC / electrical / plumbing capex.
Questions for the listing agent
- What do current leases actually rent for vs. the listed asking? Can we see a recent rent roll and the last 12 months of T-12 income?
- It's been on market 107 days. Have you received any prior offers? Is the seller open to a 23% concession, seller financing, or rate buy-down credit?
- Built in 1890 — when were the roof, HVAC, electrical panel, plumbing, and water heater last replaced?
- Why hasn't it sold? Are there any deal-killer items the seller is aware of (foundation, flood, title, zoning, code violations)?
- Is there a deadline driving the sale (1031 exchange, divorce, estate, relocation)? That informs how much negotiation room exists.
- The area grade is low — what's the realistic commute time and amenity access for the typical tenant pool here? Any planned neighborhood developments (good or bad) we should know about?
- What's the average days-on-market for RENTAL listings here right now (not sales)? A rising rental-DOM trend means longer vacancies and softer asking-rent achievability than the comps imply.
- What's the recent tenant-quality profile in this submarket — average credit score on applications, eviction rate, late-payment / NSF rate, and stable-employment percentage? A property-management company in the area should have these aggregated.
- How much new for-sale + rental construction is in the pipeline within 1–3 miles? Heavy new supply typically softens prices + rents 12–24 months out; constrained supply supports both.
Investment metrics
- 1% rule
- 0.77% ✗
- Cap rate
- 6.06%
- Cash-on-cash
- -0.83%
- DSCR
- 0.96
- GRM
- 10.9
CMA / ARV
- ARV (median comp)
- $102,672
- List price
- $122,000
- Delta
- 18.83%
- Verdict
- OVERPRICED
- Comps
- 20 within 1.0 mi
Show comp detail 12 sales within ~0.75 mi
| Address | Dist | Beds/Ba | Sqft | Sold | Price | $/sf | Match |
|---|---|---|---|---|---|---|---|
| 924 E Warren St | 0.41mi | 3/1.0 | 1,180 (+8%) | 1mo | $184,000 | $156 | 64 |
| 809 Wingert | 0.65mi | 3/1.0 | 1,068 (-2%) | 2mo | $110,000 | $103 | 63 |
| 603 Kaler Ave | 0.60mi | 2/1.5 (-1) | 1,126 (+3%) | 8mo | $118,000 | $105 | 55 |
| 325 W Liberty St | 0.54mi | 3/1.0 | 1,222 (+12%) | 2mo | $170,000 | $139 | 51 |
| 561 Virginia Ave | 0.66mi | 3/1.0 | 1,152 (+6%) | 10mo | $109,900 | $95 | 50 |
| 826 S Spring St | 0.65mi | 2/1.0 (-1) | 1,000 (-8%) | 2mo | $124,900 | $125 | 48 |
| 819 High St | 0.71mi | 3/1.5 | 1,194 (+10%) | 10mo | $95,000 | $80 | 43 |
| 427 E Southern Ave | 0.70mi | 3/1.0 | 1,213 (+11%) | 8mo | $61,000 | $50 | 40 |
| 861 S Poplar | 0.68mi | 2/1.0 (-1) | 984 (-10%) | 10mo | $96,700 | $98 | 37 |
| 127 Gaius St | 0.69mi | 3/1.0 | 1,218 (+12%) | 11mo | $174,900 | $144 | 37 |
| 519 Whetstone St | 0.66mi | 2/1.0 (-1) | 1,208 (+11%) | 10mo | $185,000 | $153 | 35 |
| 1022 S East | 0.73mi | 3/1.0 | 1,242 (+14%) | 9mo | $148,700 | $120 | 33 |
Match score weights: distance 35% · size 25% · config 20% · recency 20%. Top-matched comps best support the ARV.
Projected returns pro-forma
-3.0% appreciation · 3.0% rent growth · sell at horizon
- IRR
- -17.7%
- Equity multiple
- 0.38×
- Total profit
- $-21,306
- Equity at exit
- $18,191
- IRR
- -9.9%
- Equity multiple
- 0.40×
- Total profit
- $-20,631
- Equity at exit
- $10,548
Cash invested: $34,160 (down + closing). Projections, not guarantees.
Landlord ↔ Tenant lean methodology
- Overall (STATE)
- 73 Landlord-Friendly
- State Ohio
- 73 Landlord-Friendly · R+6
- County
- — inherits STATE
- City
- — inherits STATE
ZIP-level market 44820
- Home prices YoY
- -27.1%
- Active inventory
- 81
- Price-to-rent
- 10.9×
Monthly cashflow live
- Estimated rent
- $934 medium interval (Pro) →
- Mortgage (P&I)
- −$640
- Tax from tax record
- −$71 /mo · $852/yr
- Insurance
- −$51
- HOA
- −$0
- Vacancy / Maint / Mgmt
- −$196
- Net cashflow
- $-24
Break-even live
UW: 25.0% down · 7.5% · 30yr · 1.5% tax · 5.0% vac · 8.0% maint · 8.0% mgmt
Financing live
Cash to close
- Down payment
- $30,500
- Closing costs
- $3,660
- Reserves months
- —
- Total cash needed
- —
Loan-product check · same deal, 3 products live
Conventional
25% down · 7.5% · 30yr
- Down + closing
- —
- Monthly P&I
- —
- Monthly cashflow
- —
- DSCR
- —
- Eligible?
- —
Personal DTI + credit; lowest rate.
DSCR
20% down · 8.5% · 30yr
- Down + closing
- —
- Monthly P&I
- —
- Monthly cashflow
- —
- DSCR
- —
- Eligible?
- —
No personal income docs; deal must DSCR.
Hard money
10% down · 12.0% · 12mo
- Down + closing
- —
- Monthly P&I
- —
- Monthly cashflow
- —
- DSCR
- —
- Eligible?
- —
Short-term bridge; refi at stabilization.
Rent comps 2 comps
| Address | Beds | Baths | Sqft | Rent | $/sqft | DOM | Units | Dist |
|---|---|---|---|---|---|---|---|---|
| 32 Pinewood Bucyrus, OH | 1.0–2.0 | 1.0 | 720 | $945 | $1.31 | 43d | 1 | 1.26mi |
| 100 Heritage Cir Unit 104 Bucyrus, OH | 3.0 | 1.0 | 950 | $925 | $0.97 | 43d | 1 | 1.44mi |
Listing history 23 events
-
2026-06-18days on market $122,000 Active 107 DOM
-
2026-06-17days on market $122,000 Active 106 DOM
-
2026-06-16days on market $122,000 Active 105 DOM
-
2026-06-15days on market $122,000 Active 104 DOM
-
2026-06-13days on market $122,000 Active 102 DOM
-
2026-06-12days on market $122,000 Active 101 DOM
-
2026-06-09days on market $122,000 Active 98 DOM
-
2026-06-08days on market $122,000 Active 97 DOM
-
2026-06-07days on market $122,000 Active 96 DOM
-
2026-06-05days on market $122,000 Active 94 DOM
-
2026-06-04days on market $122,000 Active 92 DOM
-
2026-06-02days on market $122,000 Active 91 DOM
-
2026-06-01days on market $122,000 Active 90 DOM
-
2026-05-31days on market $122,000 Active 89 DOM
-
2026-03-03$132,000 Active 987-char remark
Show marketing remark (980 chars)
Ready for a house without the adventure of remodeling? Here is a sweet 3 bedroom, 1.5 baths ready to be financed by whichever government loan you would like to throw at them, along with a $2,000 appliance credit at closing. This one comes with no surprise expenses and affordable utility costs! An FHA dream already outfitted with GFCI outlets, newer windows, and a newer furnace. Matching neutral tones and uniform flooring throughout will have you excited to throw in your belongings and get back to your best life. Start building equity and don't worry about calling for repairs, because you are set! Plenty of parking out back along with your spacious 2 car garage with separate doors and a maintenance free yard that won't take up summer activities that are right around the corner. This one may not be your forever home, but consider leveraging it as a stepping stone for the next one. Located around the corner from local favorites; Mi Cerrito's, Taphouse, and Baker's!
-
2026-03-03$132,000 Active 980-char remark
Show marketing remark (980 chars)
Ready for a house without the adventure of remodeling? Here is a sweet 3 bedroom, 1.5 baths ready to be financed by whichever government loan you would like to throw at them, along with a $2,000 appliance credit at closing. This one comes with no surprise expenses and affordable utility costs! An FHA dream already outfitted with GFCI outlets, newer windows, and a newer furnace. Matching neutral tones and uniform flooring throughout will have you excited to throw in your belongings and get back to your best life. Start building equity and don't worry about calling for repairs, because you are set! Plenty of parking out back along with your spacious 2 car garage with separate doors and a maintenance free yard that won't take up summer activities that are right around the corner. This one may not be your forever home, but consider leveraging it as a stepping stone for the next one. Located around the corner from local favorites; Mi Cerrito's, Taphouse, and Baker's!
-
2024-10-07soldstatus $53,500 Closed
-
2024-07-25status Pending
-
2024-07-23price $58,900
-
2024-07-13$59,900 Active
-
2024-07-12soldstatus $32,500
-
2023-06-12soldstatus $16,800
-
2021-10-26soldstatus $20,000
ⓘ Source: listings_history table (triggers on properties + properties_extension) + one-shot
backfill from property_details.listing_events for pre-trigger history.
Tax reassessment forecast OH · Partial reset (capped growth)
- Current annual tax
- $852 · $71/mo
- Projected year-2 tax
- $1,378 · $115/mo
- Expected delta
- +$525/yr (+$44/mo · 61.7%)
ⓘ Screening estimate from a state-policy table — verify with the county assessor before closing.
Climate risk First Street
- Flood 1/10 Low FEMA zone X (unshaded) · 0% chance over 30 yrs
- Wildfire 1/10 Low
- Heat 3/10 Moderate 7 d/yr ≥98°F today · 17 d/yr by 30 yrs out
- Wind 2/10 Low
- Air quality 2/10 Low 1 unhealthy d/yr today · 2 by 30 yrs out
Nearby sold comps map
Loading sold comps map…
Walkable amenities ~0.75 mi
Loading nearby amenities…
Taxation est. · year 1
- Rental income
- $11,211
- − Mortgage interest
- −$6,834
- − Property taxes
- −$852
- − Insurance
- −$610
- − Repairs & maintenance
- −$897
- − Management
- −$897
- − Depreciation
- −$3,549
- Taxable loss
- −$2,428
- Est. tax savings @ 24.0%
- +$583
- After-tax cash flow
- $300/yr
For passive investors: Depreciation is non-cash, so a rental often shows a tax loss while cash-flowing — sheltering income. Rental losses are passive: they offset passive income freely, and up to $25,000/yr can offset ordinary (W-2) income if you actively participate and your MAGI is under $100k (phasing out to $0 by $150k); unused losses carry forward. On sale, claimed depreciation is recaptured at up to 25%, and gains may owe capital-gains tax (a 1031 exchange can defer both). Figures are a year-1 estimate at your 24.0% rate — not tax advice; consult a CPA.
Schools (NCES district)
- District
- Bucyrus City
- NCES district ID
- 3904368
- Math proficiency
- 37% ▼ -15.00%
- Reading proficiency
- 46% ▼ -5.00%
- Median HH income
- $36,819
- Composite
- 34.45/100
- National rank
- #5196
- State rank
- #537 of 656 in OH
Livability — Bucyrus
- Score
- 78/100
- State rank
- #158
- US rank
- #2388
Category grades
Schools grade is shown separately in the Schools card above.
Census & demographics
- Census place
- Bucyrus, OH
- County
- Crawford · 26,873 people
- City population
- 17,265
- Population (ZIP)
- 17,265
- Household income
- $56,942
- Rent vs Own
- Severe rent burden
- 8.2
Population outlook (Crawford County) Hauer SSP2
- Today (2025)
- 39,421 people
- By 2030
- 37,656 · -4.5%
- By 2040
- 34,043 · -13.6%
- By 2050
- 30,617 · -22.3%
- By 2075
- 23,652 · -40.0%
- By 2100
- 17,786 · -54.9%
Race, ethnicity, and origin ACS 2023
- Neighborhood character
- Predominantly White (93%)
- Race & ethnicity
- White 93% Two or more races 3% Hispanic / Latino 2% Asian 1% Black 1%
- Common ancestry
- Iranian 2% Lithuanian 2% Slovak 1%
- Foreign-born
- 1%
- Languages at home
- 97% English-only · Other Asian/Pacific 1% Spanish 1%
Political lean MEDSL · Crawford
- 2024 margin
- Solid R (+53.0) · D 23.1% · R 76.1%
- 2008→2024 swing
- -33.9pp toward R · 2008: -19.0pp · 2024: -53.0pp
- All cycles
- 2024: R+53.0 2020: R+50.9 2016: R+46.8 2012: R+22.7 2008: R+19.0
Not yet ingested
- Civics
- —
Market trends
- HPI YoY
- ▼ -65.64%
- Current HPI
- 176.3548
- Rent YoY
- —
- Metro
- —
- State GDP YoY
- ▲ 1.98%
- F500 in state
- 48
Industry mix (Fortune 500 HQ in OH)
| Industry | F500 HQs | Revenue |
|---|---|---|
| Insurance | 3 | $145B |
|
||
| Industrial Machinery | 3 | $49B |
|
||
| Financial Services | 3 | $24B |
|
||
| Consumer Goods | 2 | $93B |
|
||
| Aerospace / Defense | 2 | $47B |
|
||
| Utilities | 2 | $33B |
|
||
Price history
+560.0% since first listed9 events — show timeline
- 2026-03-03 Listed $132,000 MARMLS
- 2026-03-03 Listed $132,000 CBRMLS
- 2024-10-07 Sold (MLS) $53,500 MARMLS
- 2024-07-25 Pending — MARMLS
- 2024-07-23 Price Changed $58,900 MARMLS
- 2024-07-13 Listed $59,900 MARMLS
- 2024-07-12 Sold (Public Records) $32,500 Public Records
- 2023-06-12 Sold (Public Records) $16,800 Public Records
- 2021-10-26 Sold (Public Records) $20,000 Public Records
Property tax history
+4.3%/yrLatest (2025): $852 · -1.3% YoY. Source: county tax records.
Cash-flow waterfall
monthlySold comps — $/sqft
last 12 mo · ≤1 miLoading sold comps…