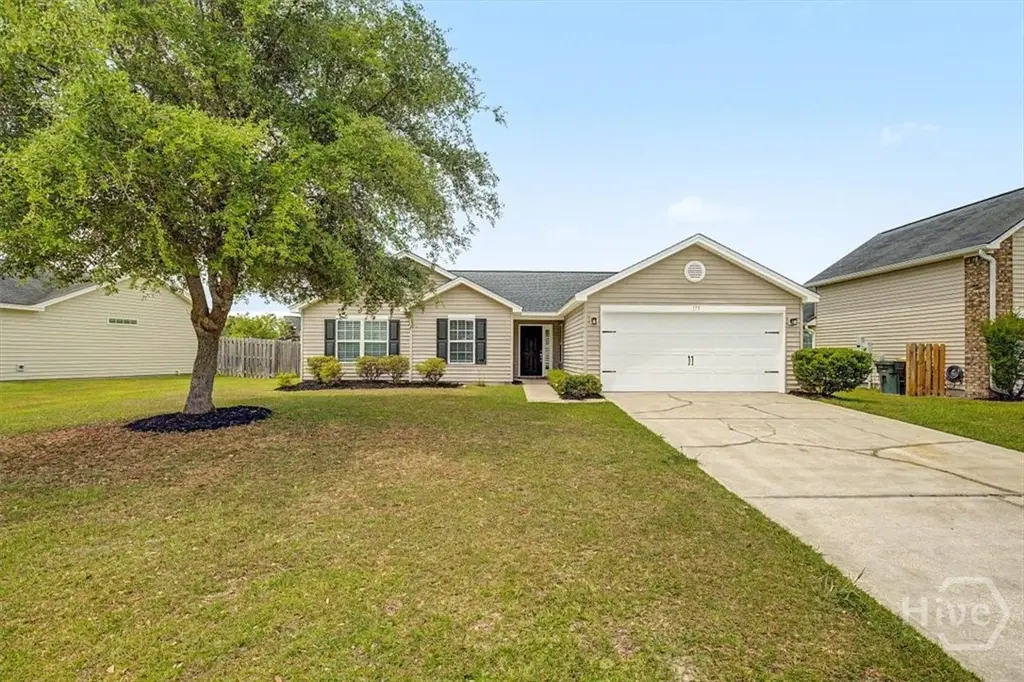
173 Willow Point Cir · Savannah, GA
Flood risk 1/10 · Minimal
- FEMA flood zone
- X (unshaded)
- Chance of flooding over 30 yrs
- 0.0%
- Est. flood insurance / yr
- $507 – $1,088
Fire risk 5/10 · Moderate
- Est. fire insurance / yr
- $963 – $1,789
Heat risk 9/10 · Severe
- Hot days now (above 108°F)
- 7 days/yr
- Hot days in 30 yrs
- 18 days/yr
Wind risk 8/10 · Major
- Chance of severe wind over 30 yrs
- 97.0%
Air-quality risk 3/10 · Minor
- Unhealthy air days now
- 3 days/yr
- Unhealthy air days in 30 yrs
- 3 days/yr
Risk factors via First Street. Map © Google.
Why this score? — see what drove the D grade
The composite is a weighted blend of 9 inputs, each scored 0–100. Each bar is that input's sub-score; the figure is the points it added to the 100-point composite (weight × sub-score).
- ARV discount +13.7/15.0
- Cash flow +8.9/30.0
- Livability +4.3/5.0
- Appreciation +4.1/10.0
- 1% rule +2.7/10.0
- DSCR +2.5/10.0
- Condition / age +2.5/5.0
- Schools +2.0/10.0
- Rent growth +1.6/5.0
$265,000
🖨 Deal sheet (PDF) 📄 Offer letter ✓ Due diligence
Listing remarks
This well-maintained 3-bedroom, 2-bathroom home in Savannah offers over 1,300 square feet of comfortable living in an established neighborhood with quick access to I-95 and I-16, putting major employers like Gulfstream Aerospace, the Georgia Ports Authority, Memorial Health, and the Hyundai Meta Plant just minutes away. The home features dark hardwood-style flooring, an open family room with a recently replaced sliding glass door, and a kitchen with refreshed cabinetry. A full roof replacement was completed in 2026, giving the next owner lasting peace of mind. Fresh interior paint, updated lighting, and modernized hardware throughout deliver a clean, move-in ready feel. Outside, the landsca
Key facts
- Proximity to i-95
- Suburban retreat
- 8,233 sq ft lot
Tags
Property features AI
Finance
- HOA & community: Homeowners association with an annual fee of $818 (about $68.17/month)
Exterior
- Parking: Attached 2-car garage
- Utilities: Public water; Public sewer; Underground utilities
- Home design: Single-family residence; Single-story
- Construction: Vinyl siding
- Exterior features: Underground utilities; Public water; Public sewer; PUD zoning; Located in Willow Point Subdivision
Interior
- Bathrooms: 2 full bathrooms
- Heating & cooling: Central heating (electric); Central air conditioning (electric)
- Interior features: Electric water heater
- Laundry & utility: Dedicated laundry room
Neighborhood map
What this means for you Summary
Snapshot
- This is a 3-bed/2.0-bath single-family listed at $265k.
Deal economics
- At list price, monthly cash flow is $-211 ($-3k/yr) — negative.
- To cash-flow at today's rent, offer at most $228k (14.1% below list).
- To meet the 1% rule (rent ≥ 1% of price), the offer needs to be $204k (23.0% below list).
- Recommended offer: $204k (23.0% below list) — sets the bar for 1% rule.
- Cap rate 5.3% vs local median 4.0% in Savannah — top-decile yield for the area; either an underpriced asset or a hidden risk that comps aren't pricing in. Stress-test before assuming the spread holds.
Location & tenants
- Location reads 86/100 on livability (#1 in GA, #397 nationally) — a professional / high-income tenant draw. Strengths: crime A+, amenities A+, commute A+; Watch: employment D, schools F.
- Savannah-Chatham County (urban): math 20% / reading 26% proficiency, ranked #134 of 174 in GA (top 77%) — low school quality limits family demand, transient renter base, plan for 1-2y turnover.
- Market conditions: Rents falling (-3.5%/yr); 382 active listings in the ZIP; 28 comparable units currently listed for rent nearby; rentals at typical pace (median 26d on market — plan ~3-4 weeks tenant-placement turnaround); solid renter incomes; 2,694 units permitted in Chatham County in 2024 (973 in 5+ unit buildings).
- This rent runs 30% of the median local income ($81k/yr) — at the standard rent-burdened threshold; future hikes will face affordability resistance.
Forward outlook
- Local home prices are declining (-1.9%/yr); year-one equity from $2k of loan paydown is wiped out by about $5k of value loss. Plan a longer hold.
- Chatham County population projected at +33% by 2050 — long-run rental-demand tailwind backs the buy-and-hold thesis.
Negotiation context
- It's been on market 16 days — a 2% lower offer ($261k) is reasonable based on typical stale-listing flexibility.
- 3 sale attempts since 3y ago with the ask held roughly flat each time — persistent listings suggest the price (not the market) is what's stuck; bring a comps-based counter.
Risks & watch-outs
- Climate carrying-cost: severe wind risk, 97% chance of damaging wind over 30y; moderate wildfire risk; extreme-heat days projected 7→18/yr by 2055 (HVAC capex compounding) — expect insurance premiums to compound above CPI over the hold.
Questions for the listing agent
- What do current leases actually rent for vs. the listed asking? Can we see a recent rent roll and the last 12 months of T-12 income?
- What does the HOA fee cover, when was the last increase, and are there any pending special assessments or reserve-fund shortfalls?
- Is there a deadline driving the sale (1031 exchange, divorce, estate, relocation)? That informs how much negotiation room exists.
- Schools are F-rated, which usually means shorter tenancies and higher turnover. Who's the typical renter profile here, and what's been the actual vacancy rate?
- The area grade is low — what's the realistic commute time and amenity access for the typical tenant pool here? Any planned neighborhood developments (good or bad) we should know about?
- What's the average days-on-market for RENTAL listings here right now (not sales)? A rising rental-DOM trend means longer vacancies and softer asking-rent achievability than the comps imply.
- What's the recent tenant-quality profile in this submarket — average credit score on applications, eviction rate, late-payment / NSF rate, and stable-employment percentage? A property-management company in the area should have these aggregated.
- How much new for-sale + rental construction is in the pipeline within 1–3 miles? Heavy new supply typically softens prices + rents 12–24 months out; constrained supply supports both.
Investment metrics
- 1% rule
- 0.77% ✗
- Cap rate
- 5.34%
- Cash-on-cash
- -3.42%
- DSCR
- 0.85
- GRM
- 10.8
CMA / ARV
- ARV (median comp)
- $307,140
- List price
- $265,000
- Delta
- -13.72%
- Verdict
- UNDERPRICED
- Comps
- 20 within 1.0 mi
Show comp detail 12 sales within ~0.75 mi
| Address | Dist | Beds/Ba | Sqft | Sold | Price | $/sf | Match |
|---|---|---|---|---|---|---|---|
| 163 Willow Point Cir | 0.03mi | 3/2.0 | 1,372 (+4%) | 2mo | $280,000 | $204 | 91 |
| 6 Spring Lake Cir | 0.34mi | 3/2.0 | 1,355 (+2%) | 1mo | $268,000 | $198 | 80 |
| 12 Spring Lake Cir | 0.32mi | 3/2.0 | 1,355 (+2%) | 3mo | $305,000 | $225 | 79 |
| 9 Chandler Bluff Dr | 0.56mi | 3/2.0 | 1,365 (+3%) | 3mo | $279,900 | $205 | 66 |
| 97 Crystal Lake Dr | 0.49mi | 3/2.0 | 1,425 (+8%) | 1mo | $339,000 | $238 | 64 |
| 68 Westbourne Way | 0.62mi | 3/2.0 | 1,386 (+5%) | 1mo | $325,000 | $234 | 63 |
| 29 Godley Park Way | 0.65mi | 3/2.5 | 1,320 (-0%) | 6mo | $295,000 | $223 | 62 |
| 22 Hartland Ct | 0.43mi | 3/2.0 | 1,193 (-10%) | 3mo | $269,900 | $226 | 61 |
| 9 Sunbriar Ln | 0.52mi | 3/2.0 | 1,224 (-8%) | 6mo | $240,000 | $196 | 58 |
| 52 Hartland Ct | 0.61mi | 3/2.0 | 1,474 (+11%) | 4mo | $305,000 | $207 | 49 |
| 5 Sunbriar Ln | 0.53mi | 3/2.5 | 1,503 (+13%) | 4mo | $299,900 | $200 | 48 |
| 49 Hartland Ct | 0.59mi | 3/2.0 | 1,474 (+11%) | 8mo | $325,000 | $220 | 46 |
Match score weights: distance 35% · size 25% · config 20% · recency 20%. Top-matched comps best support the ARV.
Projected returns pro-forma
-1.89% appreciation · 0.0% rent growth · sell at horizon
- IRR
- -17.5%
- Equity multiple
- 0.33×
- Total profit
- $-49,823
- Equity at exit
- $52,851
- IRR
- -14.7%
- Equity multiple
- 0.02×
- Total profit
- $-72,475
- Equity at exit
- $46,493
Cash invested: $74,200 (down + closing). Projections, not guarantees.
Landlord ↔ Tenant lean methodology
- Overall (STATE)
- 90 Strongly Landlord-Friendly
- State Georgia
- 90 Strongly Landlord-Friendly · R+3
- County
- — inherits STATE
- City
- — inherits STATE
ZIP-level market 31407
- Home prices YoY
- -0.7%
- Rents YoY
- -3.5%
- Active inventory
- 382
- Price-to-rent
- 10.8×
Monthly cashflow live
- Estimated rent
- $2,039 high interval (Pro) →
- Mortgage (P&I)
- −$1,390
- Tax from tax record
- −$254 /mo · $3,053/yr
- Insurance
- −$110
- HOA
- −$68
- Vacancy / Maint / Mgmt
- −$428
- Net cashflow
- $-211
Break-even live
Sensitivity live
| Price | -10% $-61 | -5% $-136 | +0% $-211 | +5% $-286 | +10% $-361 |
|---|---|---|---|---|---|
| Rent | -10% $-373 | -5% $-292 | +0% $-211 | +5% $-131 | +10% $-50 |
| Rate | -1.0pp $-78 | -0.5pp $-144 | base $-211 | +0.5pp $-280 | +1.0pp $-350 |
UW: 25.0% down · 7.5% · 30yr · 1.5% tax · 5.0% vac · 8.0% maint · 8.0% mgmt
Financing live
Cash to close
- Down payment
- $66,250
- Closing costs
- $7,950
- Reserves months
- —
- Total cash needed
- —
Loan-product check · same deal, 3 products live
Conventional
25% down · 7.5% · 30yr
- Down + closing
- —
- Monthly P&I
- —
- Monthly cashflow
- —
- DSCR
- —
- Eligible?
- —
Personal DTI + credit; lowest rate.
DSCR
20% down · 8.5% · 30yr
- Down + closing
- —
- Monthly P&I
- —
- Monthly cashflow
- —
- DSCR
- —
- Eligible?
- —
No personal income docs; deal must DSCR.
Hard money
10% down · 12.0% · 12mo
- Down + closing
- —
- Monthly P&I
- —
- Monthly cashflow
- —
- DSCR
- —
- Eligible?
- —
Short-term bridge; refi at stabilization.
Rent comps 28 comps
| Address | Beds | Baths | Sqft | Rent | $/sqft | DOM | Units | Dist |
|---|---|---|---|---|---|---|---|---|
| 70 Winter Lake Cir Savannah, GA | 2.0 | 2.5 | 1309 | $1,695 | $1.29 | 45d | 1 | 0.26mi |
| 154 Brickhill Cir Savannah, GA | 3.0 | 2.0 | 1489 | $2,050 | $1.38 | 25d | 1 | 0.35mi |
| 190 Brickhill Cir Savannah, GA | 3.0 | 2.0 | 1843 | $2,250 | $1.22 | 45d | 1 | 0.38mi |
| 11 Summer Lake Way Unit 1244793P Savannah, GA | 3.0 | 2.0 | 1399 | $2,559 | $1.83 | 45d | 1 | 0.39mi |
| 65 Fairgreen St Savannah, GA | 2.0 | 2.5 | 1024 | $1,600 | $1.56 | 16d | 1 | 0.41mi |
| 88 Crystal Lake Dr Savannah, GA | 3.0 | 2.0 | 1812 | $3,450 | $1.90 | 45d | 1 | 0.47mi |
| 125 Fairgreen St Savannah, GA | 2.0 | 2.5 | 1024 | $1,595 | $1.56 | 25d | 1 | 0.50mi |
| 56 Ashleigh Ln Savannah, GA | 3.0 | 2.5 | 1346 | $1,800 | $1.34 | 45d | 1 | 0.58mi |
| 101 Spring Lakes Dr Savannah, GA | 1.0–3.0 | 1.0–2.0 | 1077 | $2,321 | $2.16 | 16d | 17 | 0.68mi |
| 118 Orkney Rd Savannah, GA | 3.0 | 2.5 | 1415 | $2,000 | $1.41 | 45d | 1 | 0.73mi |
| 120 Cromer St Savannah, GA | 3.0 | 2.5 | 1468 | $1,950 | $1.33 | 16d | 1 | 0.75mi |
| 122 Cromer St Savannah, GA | 3.0 | 2.5 | 1464 | $1,950 | $1.33 | 16d | 1 | 0.76mi |
| 250 Goodleigh Cir Savannah, GA | 3.0 | 2.5 | 1791 | $2,087 | $1.17 | 16d | 5 | 0.82mi |
| 2155 Benton Blvd Savannah, GA | 1.0–3.0 | 1.0–2.0 | 1092 | $1,846 | $1.69 | 16d | 18 | 0.82mi |
| 44 Hawkhorn Ct Savannah, GA | 4.0 | 2.0 | 1774 | $2,350 | $1.32 | 45d | 1 | 0.84mi |
| 2080 Benton Blvd Savannah, GA | 1.0–3.0 | 1.0–2.0 | 926 | $1,979 | $2.14 | 23d | 38 | 0.98mi |
| 1601 Riddick Ln Port Wentworth, GA | 3.0 | 2.5 | 1540 | $1,975 | $1.28 | 45d | 18 | 0.99mi |
| 1601 Riddick Ln Port Wentworth, GA | 3.0 | 2.5 | 1540 | $1,984 | $1.29 | 16d | 12 | 0.99mi |
| 56 Rivermoor Ct Savannah, GA | 2.0 | 2.0 | 1138 | $1,595 | $1.40 | 45d | 1 | 1.16mi |
| 1245 Georgia 30 Port Wentworth, GA | 2.0 | 2.0 | 1170 | $1,532 | $1.31 | 23d | 15 | 1.17mi |
| 73 Highlands Blvd Savannah, GA | 1.0–3.0 | 1.0–2.0 | 1410 | $2,399 | $1.70 | 16d | 46 | 1.32mi |
| 72 Lake Shore Blvd Port Wentworth, GA | 3.0 | 2.0 | 1386 | $1,900 | $1.37 | 16d | 1 | 1.33mi |
| 100 Shellbark Way Savannah, GA | 1.0–3.0 | 1.0–2.0 | 1033 | $2,088 | $2.02 | 16d | 32 | 1.37mi |
| 1 Cardinal Ct Port Wentworth, GA | 3.0 | 2.5 | 1750 | $1,849 | $1.06 | 25d | 1 | 1.41mi |
| 1 Saint Augustine Way Unit 1 Port Wentworth, GA | 3.0 | 2.5 | 1750 | $1,650 | $0.94 | 25d | 1 | 1.43mi |
| 18 Saint Augustine Way Unit 18 SAW Port Wentworth, GA | 3.0 | 2.5 | 1750 | $1,650 | $0.94 | 25d | 1 | 1.44mi |
| 7 Saint Augustine Way Unit 7 SAW Port Wentworth, GA | 3.0 | 2.5 | 1750 | $1,750 | $1.00 | 16d | 1 | 1.45mi |
| 31 Saint Augustine Way Unit 31 SAW Port Wentworth, GA | 3.0 | 2.5 | 1750 | $1,899 | $1.09 | 25d | 1 | 1.47mi |
HOA detail
- Monthly dues
- $68 · $816/yr
Listing history 6 events
-
2026-05-11$265,000 Active 897-char remark
-
2023-10-30historical $1,995
-
2023-10-20price $1,995
-
2023-09-25$2,030
-
2023-09-19historical $2,030
-
2023-08-23$2,030
ⓘ Source: listings_history table (triggers on properties + properties_extension) + one-shot
backfill from property_details.listing_events for pre-trigger history.
Tax reassessment forecast GA · Resets to sale price
- Current annual tax
- $3,053 · $254/mo
- Projected year-2 tax
- $3,053 · $254/mo
- Expected delta
- $0/yr ($0/mo · 0.0%)
ⓘ Screening estimate from a state-policy table — verify with the county assessor before closing.
Climate risk First Street
- Flood 1/10 Low FEMA zone X (unshaded) · 0% chance over 30 yrs
- Wildfire 5/10 Major
- Heat 9/10 Extreme 7 d/yr ≥108°F today · 18 d/yr by 30 yrs out
- Wind 8/10 Severe 97% chance of damaging wind over 30 yrs
- Air quality 3/10 Moderate 3 unhealthy d/yr today · 3 by 30 yrs out
Nearby sold comps map
Loading sold comps map…
Walkable amenities ~0.75 mi
Loading nearby amenities…
Taxation est. · year 1
- Rental income
- $24,471
- − Mortgage interest
- −$14,844
- − Property taxes
- −$3,053
- − Insurance
- −$1,325
- − Repairs & maintenance
- −$1,958
- − Management
- −$1,958
- − HOA
- −$816
- − Depreciation
- −$7,709
- Taxable loss
- −$7,191
- Est. tax savings @ 24.0%
- +$1,726
- After-tax cash flow
- $-812/yr
For passive investors: Depreciation is non-cash, so a rental often shows a tax loss while cash-flowing — sheltering income. Rental losses are passive: they offset passive income freely, and up to $25,000/yr can offset ordinary (W-2) income if you actively participate and your MAGI is under $100k (phasing out to $0 by $150k); unused losses carry forward. On sale, claimed depreciation is recaptured at up to 25%, and gains may owe capital-gains tax (a 1031 exchange can defer both). Figures are a year-1 estimate at your 24.0% rate — not tax advice; consult a CPA.
Schools (NCES district)
- District
- Savannah-Chatham County
- NCES district ID
- 1301020
- Math proficiency
- 20% ▼ -11.00%
- Reading proficiency
- 26% ▼ -5.00%
- Median HH income
- $47,443
- Composite
- 20.14/100
- National rank
- #8639
- State rank
- #134 of 174 in GA
Livability — Savannah
- Score
- 86/100
- State rank
- #1
- US rank
- #397
Category grades
Schools grade is shown separately in the Schools card above.
Census & demographics
- Census place
- Savannah, GA
- County
- Chatham County · 271,602 people
- City population
- 216,564
- Metro
- Savannah, GA
- Population (ZIP)
- 24,893
- Household income
- $81,124
- Rent vs Own
- Severe rent burden
- 1341.0
Population outlook (Chatham County) Hauer SSP2
- Today (2025)
- 332,584 people
- By 2030
- 355,508 · +6.9%
- By 2040
- 400,030 · +20.3%
- By 2050
- 443,019 · +33.2%
- By 2075
- 534,579 · +60.7%
- By 2100
- 583,863 · +75.6%
Race, ethnicity, and origin ACS 2023
- Neighborhood character
- Diverse neighborhood (Simpson 0.65)
- Race & ethnicity
- Black 43% White 38% Hispanic / Latino 13% Two or more races 6% Asian 2%
- Hispanic origin (detail)
- Mexican 5% Puerto Rican 3%
- Common ancestry
- Serbian 1% Romanian 1% Italian 1%
- Foreign-born
- 8% · Canada, Vietnam
- Languages at home
- 86% English-only · Spanish 11% Vietnamese 1% Other Asian/Pacific 1%
Political lean MEDSL · Chatham
- 2024 margin
- D (+18.0) · D 58.6% · R 40.6%
- 2008→2024 swing
- +3.6pp toward D · 2008: 14.4pp · 2024: 18.0pp
- All cycles
- 2024: D+18.0 2020: D+18.8 2016: D+14.5 2012: D+12.0 2008: D+14.4
Not yet ingested
- Civics
- —
Market trends
- HPI YoY
- ▼ -1.89%
- Current HPI
- 270.3529
- Rent YoY
- ▼ -3.47%
- Metro
- Savannah, GA
- State GDP YoY
- ▲ 2.66%
- F500 in state
- 28
Industry mix (Fortune 500 HQ in GA)
| Industry | F500 HQs | Revenue |
|---|---|---|
| Paper / Packaging | 2 | $29B |
|
||
| Retail | 1 | $160B |
|
||
| Transportation / Logistics | 1 | $91B |
|
||
| Airlines | 1 | $62B |
|
||
| Consumer Goods | 1 | $47B |
|
||
| Utilities | 1 | $25B |
|
||
Price history
+12461.6% since first listed8 events — show timeline
- 2026-06-17 Sold (MLS) $255,000 Hive MLS
- 2026-05-27 Pending — Hive MLS
- 2026-05-11 Listed $265,000 Hive MLS
- 2023-10-30 Rental Removed $1,995 RENT.
- 2023-10-20 Price Changed $1,995 RENT.
- 2023-09-25 Listed for Rent $2,030 RENT.
- 2023-09-19 Rental Removed $2,030 RENT.
- 2023-08-23 Listed for Rent $2,030 RENT.
Property tax history
+5.3%/yrLatest (2025): $3,053 · +1.9% YoY. Source: county tax records.
Cash-flow waterfall
monthlySold comps — $/sqft
last 12 mo · ≤1 miLoading sold comps…