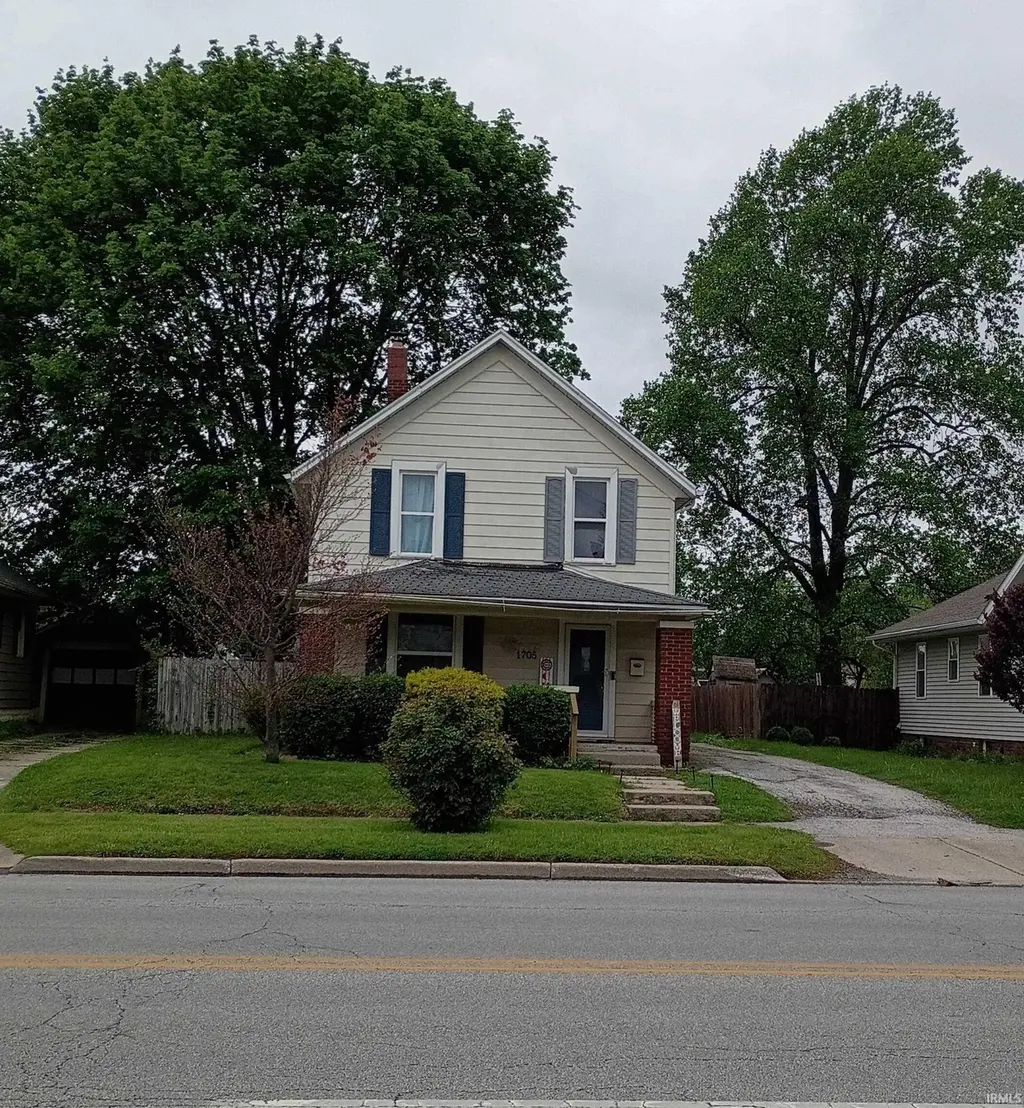
1705 S Washington St · Kokomo, IN
Flood risk 1/10 · Minimal
- FEMA flood zone
- X (unshaded)
- Chance of flooding over 30 yrs
- 0.0%
- Est. flood insurance / yr
- $473 – $860
Fire risk 1/10 · Minimal
- Est. fire insurance / yr
- $717 – $1,331
Heat risk 3/10 · Minor
- Hot days now (above 102°F)
- 7 days/yr
- Hot days in 30 yrs
- 17 days/yr
Wind risk 2/10 · Minimal
- Chance of severe wind over 30 yrs
- —
Air-quality risk 3/10 · Minor
- Unhealthy air days now
- 2 days/yr
- Unhealthy air days in 30 yrs
- 3 days/yr
Risk factors via First Street. Map © Google.
Why this score? — see what drove the C+ grade
The composite is a weighted blend of 9 inputs, each scored 0–100. Each bar is that input's sub-score; the figure is the points it added to the 100-point composite (weight × sub-score).
- Cash flow +24.6/30.0
- ARV discount +15.0/15.0
- DSCR +8.0/10.0
- 1% rule +6.4/10.0
- Livability +3.4/5.0
- Rent growth +3.0/5.0
- Condition / age +2.5/5.0
- Schools +2.1/10.0
- Appreciation +0.0/10.0
$119,900
🖨 Deal sheet 📄 Offer letter ✓ Due diligence
Listing remarks MLS
#6021 FULL OF CHARM! THIS COMPLETELY RENOVATED 2 STORY IS MOVE IN READY! THE 4 BEDRM HOME OFFERS A LG FAMILY RM, FORMAL DINING AREA, ENTRY WAY WITH HALF BATH, KITCHEN WITH PANTRY & UTILITY RM OFF KITCHEN AND A FENCED BACK YARD. UPDATES INCLUDE NEWER REPLACEMENT WINDOWS, FLOORING, PAINT & SIDING. 1ST FLOOR BEDRM CAN BE USED AS A DEN. ACCESS THE DETACHED GARAGE FROM WASHINGTON OR THE ALLEY. CALL FOR AN APPOINTMENT.
Key facts
- Full privacy fence
- Large back yard
- Covered porch patio
Tags
Property features AI
Finance
- Other: Directions: North on Washington or south to 1705 S Washington; Subdivision listed as Other
- Financial info: No financial details provided
- HOA & community: No HOA details provided
Exterior
- Parking: Detached off-street garage with 2 parking spaces
- Security: No security details provided
- Utilities: Public water; Public sewer
- Home design: Single-family residence (site-built); Two stories
- Construction: Aluminum siding; Above-grade finished area reported (detail withheld); Year built not provided
- Exterior features: Patio; Irregular lot; Lot dimensions approximately 50 x 150
Interior
- Kitchen: No kitchen appliance details provided
- Bedrooms: Total of 8 rooms (bedroom count not specified)
- Flooring: No flooring details provided
- Bathrooms: Two full bathrooms; One main-level bathroom
- Heating & cooling: Natural gas heating; Central air conditioning
- Interior features: Full basement
- Laundry & utility: Laundry located on the main level
Neighborhood map
What this means for you Summary
Snapshot
- This is a 3-bed/1.0-bath single-family listed at $120k.
Deal economics
- At list price, monthly cash flow is $249 ($3k/yr) — positive.
- The deal already cash-flows at list — no discount required.
- Meets the 1% rule at list price ($1k rent vs $120k).
- Recommended offer: $116k (3.0% below list) — sets the bar for market timing.
- Cap rate 8.8% vs local median 5.2% in Kokomo — top-decile yield for the area; either an underpriced asset or a hidden risk that comps aren't pricing in. Stress-test before assuming the spread holds.
Location & tenants
- Location reads 68/100 on livability (#227 in IN) — a middle-class / working-renter tenant base. Strengths: cost of living A+, housing A+, health & safety A; Watch: crime D, amenities F, commute F.
- Kokomo School Corporation (urban): math 22% / reading 30% proficiency, ranked #264 of 301 in IN (top 88%) — low school quality limits family demand, transient renter base, plan for 1-2y turnover; 62% free/reduced lunch — lower-income household profile, screen leases tightly.
- Zoned schools: Elwood Haynes Elementary School (math 22% / reading 17%, grade F, #814 of 994 statewide, top 83%, 611 students, 88% FRL); Maple Crest Middle School (math 10% / reading 16%, grade F, #304 of 330 statewide, top 94%, 372 students, 77% FRL); Kokomo High School (math 19% / reading 48%, grade F, #289 of 369 statewide, top 78%, 1,519 students, 58% FRL).
- Market conditions: Rents rising (+1.8%/yr); 232 active listings in the ZIP; 1 comparable units currently listed for rent nearby; 194 units permitted in Howard County in 2024 (0 in 5+ unit buildings).
Forward outlook
- Local home prices are declining (-3.0%/yr); year-one equity from $829 of loan paydown is wiped out by about $4k of value loss. Plan a longer hold.
- Howard County population projected at -11% by 2050 — secular population decline; favor cash flow + early exit over multi-decade hold.
Negotiation context
- It's been on market 53 days — a 3% lower offer ($116k) is reasonable based on typical stale-listing flexibility.
- 3 sale attempts since 12y ago; this cycle's ask has dropped $35k (23%) from the opening price — seller is motivated, your offer sets the floor, not the list.
- Current owner paid $72k; list at $120k implies a 67% gain — meaningful room to come down on a strong offer.
Risks & watch-outs
- Watch-outs: built in 1910 — expect roof / HVAC / electrical / plumbing capex.
Questions for the listing agent
- It's been on market 53 days. Have you received any prior offers? Is the seller open to a 3% concession, seller financing, or rate buy-down credit?
- Built in 1910 — when were the roof, HVAC, electrical panel, plumbing, and water heater last replaced?
- Is there a deadline driving the sale (1031 exchange, divorce, estate, relocation)? That informs how much negotiation room exists.
- Schools are F-rated, which usually means shorter tenancies and higher turnover. Who's the typical renter profile here, and what's been the actual vacancy rate?
- Crime grade is D in this area — have there been break-ins, vandalism, or insurance claims at this property in the last 3 years? What carrier currently insures it and at what premium?
- What's the average days-on-market for RENTAL listings here right now (not sales)? A rising rental-DOM trend means longer vacancies and softer asking-rent achievability than the comps imply.
- What's the recent tenant-quality profile in this submarket — average credit score on applications, eviction rate, late-payment / NSF rate, and stable-employment percentage? A property-management company in the area should have these aggregated.
- How much new for-sale + rental construction is in the pipeline within 1–3 miles? Heavy new supply typically softens prices + rents 12–24 months out; constrained supply supports both.
Investment metrics
- 1% rule
- 1.14% ✓
- Cap rate
- 8.79%
- Cash-on-cash
- 8.90%
- DSCR
- 1.40
- GRM
- 7.3
CMA / ARV
- ARV (on-the-fly)
- $171,072
- Comps found
- 12
Show comp detail 12 sales within ~0.75 mi
| Address | Dist | Beds/Ba | Sqft | Sold | Price | $/sf | Match |
|---|---|---|---|---|---|---|---|
| 1608 S Armstrong St | 0.08mi | 3/1.0 | 1,568 (-1%) | 5mo | $110,000 | $70 | 91 |
| 1709 S Buckeye St | 0.07mi | 2/2.0 (-1) | 1,482 (-6%) | 2mo | $149,000 | $101 | 75 |
| 1520 S Courtland Ave | 0.22mi | 3/1.0 | 1,438 (-9%) | 2mo | $155,000 | $108 | 73 |
| 1424 S Courtland Ave | 0.30mi | 4/1.0 (+1) | 1,656 (+4%) | 4mo | $105,000 | $63 | 70 |
| 1335 S Buckeye St | 0.30mi | 3/3.0 | 1,454 (-8%) | 1mo | $173,000 | $119 | 64 |
| 1110 S Courtland St | 0.55mi | 3/1.5 | 1,458 (-8%) | 1mo | $170,000 | $117 | 59 |
| 1931 S Bell St | 0.48mi | 3/2.0 | 1,414 (-11%) | 0mo | $235,000 | $166 | 56 |
| 721 W Boulevard | 0.47mi | 2/1.0 (-1) | 1,402 (-12%) | 5mo | $184,200 | $131 | 50 |
| 528 Holly Ln | 0.72mi | 3/2.0 | 1,500 (-5%) | 6mo | $182,000 | $121 | 49 |
| 1036 S Webster St | 0.60mi | 3/2.0 | 1,760 (+11%) | 5mo | $175,000 | $99 | 46 |
| 1019 S Courtland Ave | 0.66mi | 4/2.0 (+1) | 1,760 (+11%) | 7mo | $161,000 | $91 | 36 |
| 1106 W Boulevard St | 0.72mi | 2/2.5 (-1) | 1,364 (-14%) | 1mo | $122,000 | $89 | 32 |
Match score weights: distance 35% · size 25% · config 20% · recency 20%. Top-matched comps best support the ARV.
Projected returns pro-forma
-3.0% appreciation · 1.8% rent growth · sell at horizon
- IRR
- -4.2%
- Equity multiple
- 0.85×
- Total profit
- $-5,176
- Equity at exit
- $17,877
- IRR
- 4.1%
- Equity multiple
- 1.28×
- Total profit
- $9,480
- Equity at exit
- $10,367
Cash invested: $33,572 (down + closing). Projections, not guarantees.
Landlord ↔ Tenant lean methodology
- Overall (STATE)
- 90 Strongly Landlord-Friendly
- State Indiana
- 90 Strongly Landlord-Friendly · R+11
- County
- — inherits STATE
- City
- — inherits STATE
ZIP-level market 46902
- Home prices YoY
- -20.7%
- Rents YoY
- 1.8%
- Active inventory
- 232
- Price-to-rent
- 7.3×
Monthly cashflow live
- Estimated rent
- $1,364 medium interval (Pro) →
- Mortgage (P&I)
- −$629
- Tax est. 1.5%
- −$150 /mo · $1,798/yr
- Insurance
- −$50
- HOA
- −$0
- Vacancy / Maint / Mgmt
- −$286
- Net cashflow
- $249
Break-even live
UW: 25.0% down · 7.5% · 30yr · 1.5% tax · 5.0% vac · 8.0% maint · 8.0% mgmt
Financing live
Cash to close
- Down payment
- $29,975
- Closing costs
- $3,597
- Reserves months
- —
- Total cash needed
- —
Loan-product check · same deal, 3 products live
Conventional
25% down · 7.5% · 30yr
- Down + closing
- —
- Monthly P&I
- —
- Monthly cashflow
- —
- DSCR
- —
- Eligible?
- —
Personal DTI + credit; lowest rate.
DSCR
20% down · 8.5% · 30yr
- Down + closing
- —
- Monthly P&I
- —
- Monthly cashflow
- —
- DSCR
- —
- Eligible?
- —
No personal income docs; deal must DSCR.
Hard money
10% down · 12.0% · 12mo
- Down + closing
- —
- Monthly P&I
- —
- Monthly cashflow
- —
- DSCR
- —
- Eligible?
- —
Short-term bridge; refi at stabilization.
Rent comps 1 comps
| Address | Beds | Baths | Sqft | Rent | $/sqft | DOM | Units | Dist |
|---|---|---|---|---|---|---|---|---|
| 430 W Rainbow Cir Kokomo, IN | 3.0 | 1.0–2.5 | 966 | $1,345 | $1.39 | 1d | 6 | 1.31mi |
Listing history 19 events
-
2026-06-19pricedays on market $119,900 Active 53 DOM
-
2026-06-18days on market $154,900 Active 52 DOM
-
2026-06-17days on market $154,900 Active 51 DOM
-
2026-06-16days on market $154,900 Active 50 DOM
-
2026-06-15days on market $154,900 Active 49 DOM
-
2026-06-14days on market $154,900 Active 47 DOM
-
2026-06-13days on market $154,900 Active 46 DOM
-
2026-06-10days on market $154,900 Active 44 DOM
-
2026-06-09days on market $154,900 Active 43 DOM
-
2026-06-08days on market $154,900 Active 42 DOM
-
2026-06-07days on market $154,900 Active 41 DOM
-
2026-06-02days on market $154,900 Active 36 DOM
-
2026-06-01days on market $154,900 Active 35 DOM
-
2026-05-31days on market $154,900 Active 34 DOM
-
2026-05-30days on market $154,900 Active 33 DOM
-
2026-04-27$154,900 Active
-
2018-07-20$87,500
-
2014-07-21soldstatus $71,800 428-char remark
Show marketing remark (428 chars)
#6021 FULL OF CHARM! THIS COMPLETELY RENOVATED 2 STORY IS MOVE IN READY! THE 4 BEDRM HOME OFFERS A LG FAMILY RM, FORMAL DINING AREA, ENTRY WAY WITH HALF BATH, KITCHEN WITH PANTRY & UTILITY RM OFF KITCHEN AND A FENCED BACK YARD. UPDATES INCLUDE NEWER REPLACEMENT WINDOWS, FLOORING, PAINT & SIDING. 1ST FLOOR BEDRM CAN BE USED AS A DEN. ACCESS THE DETACHED GARAGE FROM WASHINGTON OR THE ALLEY. CALL FOR AN APPOINTMENT.
-
2014-01-20$78,500 428-char remark
Show marketing remark (428 chars)
#6021 FULL OF CHARM! THIS COMPLETELY RENOVATED 2 STORY IS MOVE IN READY! THE 4 BEDRM HOME OFFERS A LG FAMILY RM, FORMAL DINING AREA, ENTRY WAY WITH HALF BATH, KITCHEN WITH PANTRY & UTILITY RM OFF KITCHEN AND A FENCED BACK YARD. UPDATES INCLUDE NEWER REPLACEMENT WINDOWS, FLOORING, PAINT & SIDING. 1ST FLOOR BEDRM CAN BE USED AS A DEN. ACCESS THE DETACHED GARAGE FROM WASHINGTON OR THE ALLEY. CALL FOR AN APPOINTMENT.
ⓘ Source: listings_history table (triggers on properties + properties_extension) + one-shot
backfill from property_details.listing_events for pre-trigger history.
Climate risk First Street
- Flood 1/10 Low FEMA zone X (unshaded) · 0% chance over 30 yrs
- Wildfire 1/10 Low
- Heat 3/10 Moderate 7 d/yr ≥102°F today · 17 d/yr by 30 yrs out
- Wind 2/10 Low
- Air quality 3/10 Moderate 2 unhealthy d/yr today · 3 by 30 yrs out
Nearby sold comps map
Loading sold comps map…
Walkable amenities ~0.75 mi
Loading nearby amenities…
Taxation est. · year 1
- Rental income
- $16,369
- − Mortgage interest
- −$6,716
- − Property taxes
- −$1,798
- − Insurance
- −$600
- − Repairs & maintenance
- −$1,310
- − Management
- −$1,310
- − Depreciation
- −$3,488
- Taxable income
- $1,148
- Est. tax owed @ 24.0%
- −$275
- After-tax cash flow
- $2,713/yr
For passive investors: Depreciation is non-cash, so a rental often shows a tax loss while cash-flowing — sheltering income. Rental losses are passive: they offset passive income freely, and up to $25,000/yr can offset ordinary (W-2) income if you actively participate and your MAGI is under $100k (phasing out to $0 by $150k); unused losses carry forward. On sale, claimed depreciation is recaptured at up to 25%, and gains may owe capital-gains tax (a 1031 exchange can defer both). Figures are a year-1 estimate at your 24.0% rate — not tax advice; consult a CPA.
Schools (NCES district)
- District
- Kokomo School Corporation
- NCES district ID
- 1805370
- Math proficiency
- 22% ▼ -8.00%
- Reading proficiency
- 30% ▼ -5.00%
- Median HH income
- $35,804
- Composite
- 21.5/100
- National rank
- #8325
- State rank
- #264 of 301 in IN
Livability — Kokomo
- Score
- 68/100
- State rank
- #227
- US rank
- #9912
Category grades
Schools grade is shown separately in the Schools card above.
Census & demographics
- Census place
- Kokomo, IN
- County
- Howard County · 75,099 people
- City population
- 75,099
- Metro
- Kokomo, IN
- Population (ZIP)
- 37,017
- Household income
- $62,126
- Rent vs Own
- Severe rent burden
- 1262.0
Population outlook (Howard County) Hauer SSP2
- Today (2025)
- 81,522 people
- By 2030
- 80,104 · -1.7%
- By 2040
- 76,708 · -5.9%
- By 2050
- 72,880 · -10.6%
- By 2075
- 64,016 · -21.5%
- By 2100
- 51,705 · -36.6%
Race, ethnicity, and origin ACS 2023
- Neighborhood character
- Predominantly White (81%)
- Race & ethnicity
- White 81% Black 9% Two or more races 5% Hispanic / Latino 4% Asian 3%
- Common ancestry
- Italian 2% Lithuanian 1% Slovak 1%
- Foreign-born
- 3% · Canada, Vietnam, China
- Languages at home
- 96% English-only · Vietnamese 1% Other Asian/Pacific 1% Spanish 1%
Political lean MEDSL · Howard
- 2024 margin
- Solid R (+35.3) · D 31.4% · R 66.7% · Other 1.8%
- 2008→2024 swing
- -29.1pp toward R · 2008: -6.2pp · 2024: -35.3pp
- All cycles
- 2024: R+35.3 2020: R+32.4 2016: R+33.9 2012: R+14.3 2008: R+6.2
Not yet ingested
- Civics
- —
Market trends
- HPI YoY
- ▼ -61.76%
- Current HPI
- 236.8237
- Rent YoY
- ▲ 1.80%
- Metro
- Kokomo, IN
- State GDP YoY
- ▲ 2.90%
- F500 in state
- 18
Industry mix (Fortune 500 HQ in IN)
| Industry | F500 HQs | Revenue |
|---|---|---|
| Industrial Machinery | 2 | $37B |
|
||
| Healthcare | 1 | $177B |
|
||
| Pharmaceuticals | 1 | $45B |
|
||
| Metals / Steel | 1 | $18B |
|
||
| Agriculture | 1 | $17B |
|
||
| Packaging | 1 | $12B |
|
||
Price history
+97.3% since first listed4 events — show timeline
- 2026-04-27 Listed $154,900 IRMLS
- 2018-07-20 Listed $87,500 IRMLS
- 2014-07-21 Sold (MLS) $71,800 IRMLS
- 2014-01-20 Listed $78,500 IRMLS
Property tax history
-68.3%/yrLatest (2018): $5 · -4.8% YoY. Source: county tax records.
Cash-flow waterfall
monthlySold comps — $/sqft
last 12 mo · ≤1 miLoading sold comps…