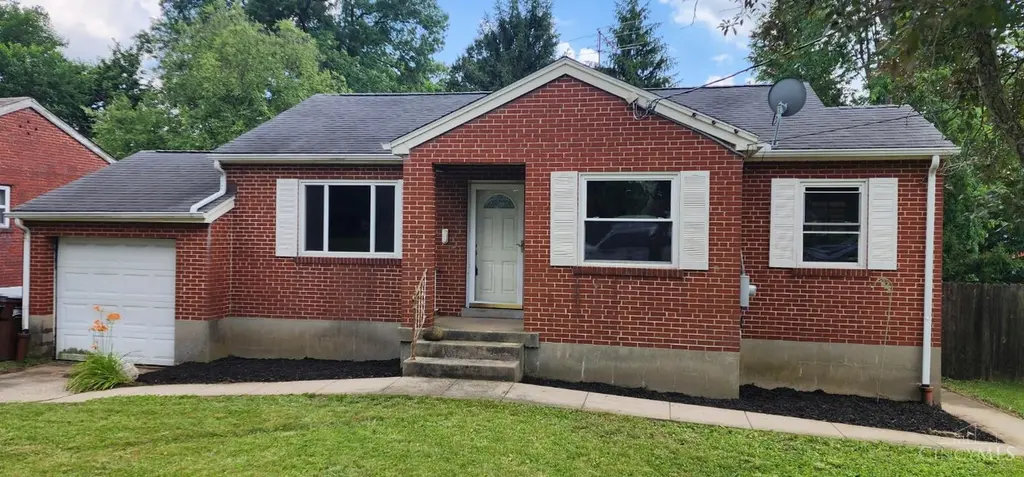
1409 Adams · Mount Healthy, OH
Flood risk 1/10 · Minimal
- FEMA flood zone
- X (unshaded)
- Chance of flooding over 30 yrs
- 0.0%
- Est. flood insurance / yr
- $473 – $860
Fire risk 1/10 · Minimal
- Est. fire insurance / yr
- $713 – $1,323
Heat risk 4/10 · Minor
- Hot days now (above 103°F)
- 7 days/yr
- Hot days in 30 yrs
- 19 days/yr
Wind risk 2/10 · Minimal
- Chance of severe wind over 30 yrs
- 1.0%
Air-quality risk 3/10 · Minor
- Unhealthy air days now
- 2 days/yr
- Unhealthy air days in 30 yrs
- 3 days/yr
Risk factors via First Street. Map © Google.
Why this score? — see what drove the B grade
The composite is a weighted blend of 9 inputs, each scored 0–100. Each bar is that input's sub-score; the figure is the points it added to the 100-point composite (weight × sub-score).
- Cash flow +25.0/30.0
- ARV discount +15.0/15.0
- DSCR +8.2/10.0
- Appreciation +7.0/10.0
- 1% rule +6.5/10.0
- Livability +3.9/5.0
- Rent growth +2.5/5.0
- Condition / age +2.2/5.0
- Schools +1.6/10.0
$104,900
🖨 Deal sheet (PDF) 📄 Offer letter ✓ Due diligence
Listing remarks
Brick Cape Cod with tons of potential and a functional floor plan. Fenced backyard with access from both the walkout kitchen and walkout basement, ideal for future outdoor living or pet‑friendly tenants. Spacious bedrooms and a bright living room offer a solid layout for cosmetic updates. Great value‑add opportunity for an investor or savvy DIYer to renovate, rent, or resell. Being sold as‑is. Agent owned.
Key facts
- Walkout basement
- Walkout kitchen
- Fenced backyard
Tags
Property features AI
Finance
- Other: Zoned residential; Lot is less than 0.5 acre (about 0.158 acres)
- Financial info: Lease not considered
- HOA & community: No homeowners association
Exterior
- Parking: Attached garage (front/side access) with 1 garage space
- Security: No specific security features provided
- Utilities: Public water; Public sewer; Natural gas
- Home design: Cape Cod style single-family home; One level
- Construction: Brick construction; Block foundation; Year built not provided
- Exterior features: Metal fencing; Vinyl windows; Shingle roof
Interior
- Kitchen: Walkout kitchen; Kitchen approximately 12 x 9; Dishwasher, Oven/Range
- Bedrooms: Two bedrooms, each approximately 12 x 12 on level 1 (primary 12 x 12)
- Flooring: No flooring details provided
- Bathrooms: One full bathroom on level 1
- Heating & cooling: Forced air heating (gas); Central air conditioning; Gas water heating
- Interior features: 4 total rooms; Full basement with concrete floor, unfinished and walkout; Handyman condition noted
- Laundry & utility: No specific laundry details provided
Neighborhood map
What this means for you Summary
Snapshot
- This is a 2-bed/1.0-bath single-family listed at $105k. Condition is rated fair.
Deal economics
- At list price, monthly cash flow is $229 ($3k/yr) — positive.
- The deal already cash-flows at list — no discount required.
- Meets the 1% rule at list price ($1k rent vs $105k).
- Cap rate 8.9% vs local median 6.4% in Mount Healthy — top-decile yield for the area; either an underpriced asset or a hidden risk that comps aren't pricing in. Stress-test before assuming the spread holds.
Location & tenants
- Location reads 77/100 on livability (#189 in OH, #2,906 nationally) — a middle-class / working-renter tenant base. Strengths: commute A+, cost of living A+, housing A+; Watch: crime F, amenities F, employment D-.
- Mt Healthy City (suburban): math 12% / reading 24% proficiency, ranked #636 of 656 in OH (top 97%) — low school quality limits family demand, transient renter base, plan for 1-2y turnover; 75% free/reduced lunch — lower-income household profile, screen leases tightly.
- Zoned schools: Mt. Healthy South Elementary School (math 12% / reading 20%, grade F, #1,371 of 1,584 statewide, top 87%, 651 students, 0% FRL); Mt Healthy Junior High School (math 13% / reading 26%, grade F, #610 of 654 statewide, top 94%, 457 students, 0% FRL); Mt Healthy High School (math 5% / reading 25%, grade F, #704 of 781 statewide, top 90%, 828 students, 0% FRL) — zoned schools average 0% FRL vs 75% district-wide (75 pts lower); this property's tenant base skews higher-income than the district average.
- Market conditions: 4 active listings in the ZIP; 8 comparable units currently listed for rent nearby; rentals at typical pace (median 25d on market — plan ~3-4 weeks tenant-placement turnaround); 801 units permitted in Hamilton County in 2024 (190 in 5+ unit buildings).
Forward outlook
- In year one you build about $5k of equity ($725 loan paydown + $4k appreciation (4.0% local appreciation)).
- At projected returns (4.0% appreciation + 3.0% rent growth), your $29k cash investment doubles in ~4 years — after that, you're playing with house money.
- By year 7, paydown + projected appreciation supports a ~$32k cash-out refi (75% LTV) — recoverable capital for the next deal without selling this one.
Negotiation context
- Only 1 days on market — expect competitive offers; lowballing is unlikely to land.
Risks & watch-outs
- Watch-outs: built in 1947 — expect roof / HVAC / electrical / plumbing capex.
Questions for the listing agent
- Have any recent inspections been done? Can we get a copy of the seller's disclosures and any deferred-maintenance estimates?
- Built in 1947 — when were the roof, HVAC, electrical panel, plumbing, and water heater last replaced?
- Is there a deadline driving the sale (1031 exchange, divorce, estate, relocation)? That informs how much negotiation room exists.
- Crime grade is F in this area — have there been break-ins, vandalism, or insurance claims at this property in the last 3 years? What carrier currently insures it and at what premium?
- What's the average days-on-market for RENTAL listings here right now (not sales)? A rising rental-DOM trend means longer vacancies and softer asking-rent achievability than the comps imply.
- What's the recent tenant-quality profile in this submarket — average credit score on applications, eviction rate, late-payment / NSF rate, and stable-employment percentage? A property-management company in the area should have these aggregated.
- How much new for-sale + rental construction is in the pipeline within 1–3 miles? Heavy new supply typically softens prices + rents 12–24 months out; constrained supply supports both.
Investment metrics
- 1% rule
- 1.15% ✓
- Cap rate
- 8.92%
- Cash-on-cash
- 9.38%
- DSCR
- 1.42
- GRM
- 7.2
CMA / ARV
- ARV (on-the-fly)
- $169,670
- Comps found
- 12
Show comp detail 12 sales within ~0.75 mi
| Address | Dist | Beds/Ba | Sqft | Sold | Price | $/sf | Match |
|---|---|---|---|---|---|---|---|
| 1469 Hill Ave | 0.23mi | 2/1.0 | 844 (-6%) | 0mo | $159,900 | $189 | 80 |
| 7841 Seward Ave | 0.10mi | 2/1.0 | 865 (-3%) | 14mo | $165,000 | $191 | 78 |
| 7829 Seward Ave | 0.12mi | 2/1.5 | 855 (-4%) | 12mo | $205,000 | $240 | 75 |
| 1436 Hill Ave | 0.16mi | 3/1.0 (+1) | 939 (+5%) | 10mo | $198,000 | $211 | 71 |
| 1461 Hill Ave | 0.22mi | 3/1.5 (+1) | 884 (-1%) | 13mo | $185,000 | $209 | 70 |
| 1315 Newport Dr | 0.49mi | 3/1.0 (+1) | 918 (+3%) | 5mo | $131,500 | $143 | 63 |
| 1405 Meredith Dr | 0.40mi | 3/1.0 (+1) | 962 (+8%) | 2mo | $193,500 | $201 | 61 |
| 7933 Hickman St | 0.37mi | 2/1.0 | 840 (-6%) | 14mo | $160,000 | $190 | 61 |
| 7345 Hickman St | 0.64mi | 2/1.0 | 875 (-2%) | 8mo | $158,500 | $181 | 60 |
| 1372 Riviera Pl | 0.59mi | 2/1.0 | 962 (+8%) | 8mo | $175,000 | $182 | 52 |
| 7832 Lincoln Ave | 0.62mi | 3/1.0 (+1) | 985 (+10%) | 3mo | $152,750 | $155 | 46 |
| 1320 Ovid Ave | 0.50mi | 3/2.0 (+1) | 1,000 (+12%) | 10mo | $188,000 | $188 | 39 |
Match score weights: distance 35% · size 25% · config 20% · recency 20%. Top-matched comps best support the ARV.
Projected returns pro-forma
4.05% appreciation · 3.0% rent growth · sell at horizon
- IRR
- 18.8%
- Equity multiple
- 2.13×
- Total profit
- $33,244
- Equity at exit
- $53,521
- IRR
- 19.3%
- Equity multiple
- 4.09×
- Total profit
- $90,850
- Equity at exit
- $87,807
Cash invested: $29,372 (down + closing). Projections, not guarantees.
Landlord ↔ Tenant lean methodology
- Overall (STATE)
- 73 Landlord-Friendly
- State Ohio
- 73 Landlord-Friendly · R+6
- County
- — inherits STATE
- City
- — inherits STATE
ZIP-level market 45321
- Home prices YoY
- 2.1%
- Active inventory
- 4
- Price-to-rent
- 7.2×
Monthly cashflow live
- Estimated rent
- $1,208 high interval (Pro) →
- Mortgage (P&I)
- −$550
- Tax est. 1.5%
- −$131 /mo · $1,574/yr
- Insurance
- −$44
- HOA
- −$0
- Vacancy / Maint / Mgmt
- −$254
- Net cashflow
- $229
Break-even live
Sensitivity live
| Price | -10% $302 | -5% $266 | +0% $229 | +5% $193 | +10% $157 |
|---|---|---|---|---|---|
| Rent | -10% $134 | -5% $182 | +0% $229 | +5% $277 | +10% $325 |
| Rate | -1.0pp $282 | -0.5pp $256 | base $229 | +0.5pp $202 | +1.0pp $175 |
UW: 25.0% down · 7.5% · 30yr · 1.5% tax · 5.0% vac · 8.0% maint · 8.0% mgmt
Financing live
Cash to close
- Down payment
- $26,225
- Closing costs
- $3,147
- Reserves months
- —
- Total cash needed
- —
Loan-product check · same deal, 3 products live
Conventional
25% down · 7.5% · 30yr
- Down + closing
- —
- Monthly P&I
- —
- Monthly cashflow
- —
- DSCR
- —
- Eligible?
- —
Personal DTI + credit; lowest rate.
DSCR
20% down · 8.5% · 30yr
- Down + closing
- —
- Monthly P&I
- —
- Monthly cashflow
- —
- DSCR
- —
- Eligible?
- —
No personal income docs; deal must DSCR.
Hard money
10% down · 12.0% · 12mo
- Down + closing
- —
- Monthly P&I
- —
- Monthly cashflow
- —
- DSCR
- —
- Eligible?
- —
Short-term bridge; refi at stabilization.
Rent comps 8 comps
| Address | Beds | Baths | Sqft | Rent | $/sqft | DOM | Units | Dist |
|---|---|---|---|---|---|---|---|---|
| 7701 Clovernook Ave Cincinnati, OH | 1.0–2.0 | 1.0–1.5 | 787 | $1,365 | $1.73 | 25d | 1 | 0.22mi |
| 7419 Werner Ave Unit 8 Cincinnati, OH | 1.0 | 1.0 | 700 | $850 | $1.21 | 25d | 1 | 0.79mi |
| 1667 Lakenoll Dr Mt Healthy, OH | 1.0–2.0 | 1.0–1.5 | 817 | $1,385 | $1.69 | 5d | 7 | 0.84mi |
| 8565 Daly Rd Unit 8565 5 Cincinnati, OH | 2.0 | 1.0 | 1100 | $1,299 | $1.18 | 25d | 1 | 1.01mi |
| 8565 Daly Rd Unit 8565 4 Cincinnati, OH | 1.0 | 1.0 | 790 | $1,050 | $1.33 | 25d | 1 | 1.01mi |
| 7777 Compton Lake Dr Cincinnati, OH | 1.0 | 1.5 | 740 | $1,125 | $1.52 | 5d | 3 | 1.08mi |
| 8543 Cottonwood Dr Unit 4 Cincinnati, OH | 1.0 | 1.0 | 731 | $925 | $1.27 | 9d | 1 | 1.36mi |
| 1385 W Galbraith Rd Cincinnati, OH | 1.0 | 1.0 | 576 | $850 | $1.48 | 25d | 1 | 1.38mi |
Listing history 2 events
-
2026-06-13remarks 409-char remark
-
2026-06-13$104,900 Active 1 DOM
ⓘ Source: listings_history table (triggers on properties + properties_extension) + one-shot
backfill from property_details.listing_events for pre-trigger history.
Climate risk First Street
- Flood 1/10 Low FEMA zone X (unshaded) · 0% chance over 30 yrs
- Wildfire 1/10 Low
- Heat 4/10 Moderate 7 d/yr ≥103°F today · 19 d/yr by 30 yrs out
- Wind 2/10 Low 100% chance of damaging wind over 30 yrs
- Air quality 3/10 Moderate 2 unhealthy d/yr today · 3 by 30 yrs out
Nearby sold comps map
Loading sold comps map…
Walkable amenities ~0.75 mi
Loading nearby amenities…
Taxation est. · year 1
- Rental income
- $14,498
- − Mortgage interest
- −$5,876
- − Property taxes
- −$1,574
- − Insurance
- −$524
- − Repairs & maintenance
- −$1,160
- − Management
- −$1,160
- − Depreciation
- −$3,052
- Taxable income
- $1,152
- Est. tax owed @ 24.0%
- −$277
- After-tax cash flow
- $2,477/yr
For passive investors: Depreciation is non-cash, so a rental often shows a tax loss while cash-flowing — sheltering income. Rental losses are passive: they offset passive income freely, and up to $25,000/yr can offset ordinary (W-2) income if you actively participate and your MAGI is under $100k (phasing out to $0 by $150k); unused losses carry forward. On sale, claimed depreciation is recaptured at up to 25%, and gains may owe capital-gains tax (a 1031 exchange can defer both). Figures are a year-1 estimate at your 24.0% rate — not tax advice; consult a CPA.
Condition & rehab AI · 12 photos
This home has moderate potential for improvement with updates to the kitchen, bathroom, HVAC, and landscaping. It offers a functional floor plan and a fenced backyard, making it a good value for cosmetic updates.
Repairs flagged
- Moderate kitchen cabinets — Older cabinets and countertops need updating.
- Major bathroom fixtures — Old fixtures and dated tile need replacement.
- Moderate HVAC system — Older system may need maintenance or replacement.
- Minor landscaping — Basic landscaping could be improved with some updates.
Value-add opportunities
- Both Updating kitchen cabinets and countertops — Improves both resale and rental value.
- Both Replacing bathroom fixtures and tile — Significant improvement in both resale and rental value.
- Both Upgrading HVAC system — Enhances comfort and energy efficiency, improving both resale and rental value.
- Both Landscaping improvements — Enhances curb appeal and property value
Renovation cost estimate screening
| Repair item | Severity | Est. cost |
|---|---|---|
| kitchen cabinets · Older cabinets and countertops need updating. | Moderate | $3,000–15,000 |
| bathroom fixtures · Old fixtures and dated tile need replacement. | Major | $15,000–50,000 |
| HVAC system · Older system may need maintenance or replacement. | Moderate | $3,000–15,000 |
| landscaping · Basic landscaping could be improved with some updates. | Minor | $500–3,000 |
| Total estimated repair cost · 4 items | $21,500–83,000 |
Value-add ROI direction
- Both Updating kitchen cabinets and countertops — Improves both resale and rental value. ↑
- Both Replacing bathroom fixtures and tile — Significant improvement in both resale and rental value. ↑
- Both Upgrading HVAC system — Enhances comfort and energy efficiency, improving both resale and rental value. ↑
- Both Landscaping improvements — Enhances curb appeal and property value ↑
ⓘ Cost ranges are severity-bucket heuristics (US national rule-of-thumb). Get contractor quotes + a written scope before underwriting a rehab budget.
Schools (NCES district)
- District
- Mt Healthy City
- NCES district ID
- 3904441
- Math proficiency
- 12% ▼ -21.00%
- Reading proficiency
- 24% ▼ -9.00%
- Median HH income
- $42,699
- Composite
- 15.51/100
- National rank
- #9303
- State rank
- #636 of 656 in OH
Livability — Mount Healthy
- Score
- 77/100
- State rank
- #189
- US rank
- #2906
Category grades
Schools grade is shown separately in the Schools card above.
Census & demographics
- Census place
- Mount Healthy, OH
- County
- Preble · 42,634 people
- Population (ZIP)
- 1,254
- Household income
- $67,153
- Rent vs Own
- Severe rent burden
- 12.3
Population outlook (Hamilton County) Hauer SSP2
- Today (2025)
- 826,054 people
- By 2030
- 830,947 · +0.6%
- By 2040
- 832,319 · +0.8%
- By 2050
- 822,428 · -0.4%
- By 2075
- 788,688 · -4.5%
- By 2100
- 710,674 · -14.0%
Race, ethnicity, and origin ACS 2023
- Neighborhood character
- Predominantly White (97%)
- Race & ethnicity
- White 97% Two or more races 2%
- Common ancestry
- Iranian 3% Lithuanian 2%
- Foreign-born
- 0%
- Languages at home
- 99% English-only · French/Haitian/Cajun 1%
Political lean MEDSL · Hamilton
- 2024 margin
- D (+14.9) · D 57.0% · R 42.1%
- 2008→2024 swing
- +7.9pp toward D · 2008: 7.0pp · 2024: 14.9pp
- All cycles
- 2024: D+14.9 2020: D+15.9 2016: D+9.5 2012: D+4.9 2008: D+7.0
Not yet ingested
- Civics
- —
Market trends
- HPI YoY
- ▲ 4.05%
- Current HPI
- 199.5416
- Rent YoY
- —
- Metro
- —
- State GDP YoY
- ▲ 1.98%
- F500 in state
- 48
Industry mix (Fortune 500 HQ in OH)
| Industry | F500 HQs | Revenue |
|---|---|---|
| Insurance | 3 | $145B |
|
||
| Industrial Machinery | 3 | $49B |
|
||
| Financial Services | 3 | $24B |
|
||
| Consumer Goods | 2 | $93B |
|
||
| Aerospace / Defense | 2 | $47B |
|
||
| Utilities | 2 | $33B |
|
||
Price history
1 event — show timeline
- 2026-06-12 Listed $104,900 Cincy MLS
Cash-flow waterfall
monthlySold comps — $/sqft
last 12 mo · ≤1 miLoading sold comps…