 🌊 Lakefront
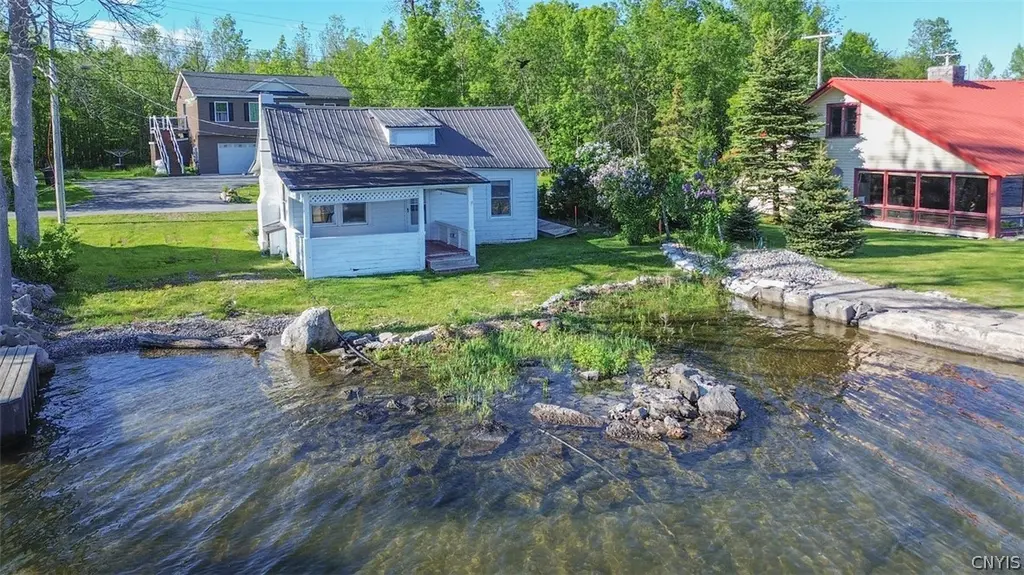
27038 Independence Point Rd · Chaumont, NY
Flood risk 6/10 · Moderate
- FEMA flood zone
- X
- Chance of flooding over 30 yrs
- 0.74%
- Est. flood insurance / yr
- $507 – $1,088
Fire risk 1/10 · Minimal
- Est. fire insurance / yr
- $691 – $1,283
Heat risk 1/10 · Minimal
- Hot days now (above 92°F)
- 7 days/yr
- Hot days in 30 yrs
- 15 days/yr
Wind risk 1/10 · Minimal
- Chance of severe wind over 30 yrs
- 1.0%
Air-quality risk 3/10 · Minor
- Unhealthy air days now
- 2 days/yr
- Unhealthy air days in 30 yrs
- 3 days/yr
Risk factors via First Street. Map © Google.
Why this score? — see what drove the D grade
The composite is a weighted blend of 9 inputs, each scored 0–100. Each bar is that input's sub-score; the figure is the points it added to the 100-point composite (weight × sub-score).
- Appreciation +10.0/10.0
- Cash flow +7.8/30.0
- ARV discount +7.5/15.0
- Schools +4.7/10.0
- Livability +3.2/5.0
- Rent growth +2.5/5.0
- Condition / age +2.5/5.0
- DSCR +1.9/10.0
- 1% rule +1.8/10.0
$249,900
🖨 Deal sheet 📄 Offer letter ✓ Due diligence
Listing remarks
Location, Location!!! Come check out this Historic Independence Point Cottage which is a rare find! This 2-bedroom 1 bath camp is situated on Sawmill Bay where you will watch all the sailboats go buy and gorgeous sunrises! This gem is ready for new owners and summer fun! Newer metal roof, everything works, covered front porch, shed, beautiful wood floors and incredible views!! This is located on a very private dead-end road where you can walk right into the village for dinner or groceries! The Historic CYC yacht club is also on this road! This is truly a rare opportunity to pick up a cottage in this neighborhood that nothing ever comes on the market! Call today before it's too late!
Key facts
- Covered front porch
- Incredible views
- 4,791 sq ft lot
Tags
Property features AI
Finance
- Other: Irregular, secluded lot; Lot dimensions approximately 59 x 84; Private road / right of way frontage; Waterfront on Sawmill Bay with beach access and bay front; Approximately 52 feet of frontage
- HOA & community: Annual association fee of $150
Exterior
- Parking: No garage
- Utilities: Cable available; Circuit breaker electrical service; Septic tank; Water from lake/river (Lake, River)
- Home design: Single-story home; Resale property; Has view
- Construction: Metal roof; Wood siding; Stone foundation; Existing (previously built)
- Exterior features: Dirt driveway; Open porch; Porch; Shed(s) / storage
Interior
- Kitchen: Electric oven; Electric range; Refrigerator
- Bedrooms: 2 bedrooms on the main level
- Flooring: Hardwood; Laminate; Varies
- Bathrooms: 1 full bathroom on the main level
- Heating & cooling: Electric heating; Wood heating; Wall furnace
- Interior features: Country kitchen; Kitchen and family room combo; Bedroom on main level; See remarks / other interior features
- Laundry & utility: Electric water heater
Neighborhood map
What this means for you Summary
Snapshot
- This is a 2-bed/1.0-bath single-family listed at $250k.
Deal economics
- At list price, monthly cash flow is $-277 ($-3k/yr) — negative.
- To cash-flow at today's rent, offer at most $201k (19.6% below list).
- To meet the 1% rule (rent ≥ 1% of price), the offer needs to be $170k (32.0% below list).
- Recommended offer: $170k (32.0% below list) — sets the bar for 1% rule.
Location & tenants
- Location reads 65/100 on livability (#708 in NY) — a middle-class / working-renter tenant base. Strengths: employment A+, housing A+, cost of living B; Watch: health & safety D, crime F, amenities F.
- Lyme Central School District (rural): math 55% / reading 50% proficiency, ranked #408 of 755 in NY (top 54%) — acceptable for families but not a draw, mixed tenant base, ~2y average lease.
- Market conditions: 23 active listings in the ZIP; 196 units permitted in Jefferson County in 2024 (0 in 5+ unit buildings).
Forward outlook
- In year one you build about $27k of equity ($2k loan paydown + $25k appreciation (10.0% local appreciation)).
- Jefferson County population projected at -12% by 2050 — secular population decline; favor cash flow + early exit over multi-decade hold.
- By year 2, paydown + projected appreciation supports a ~$43k cash-out refi (75% LTV) — recoverable capital for the next deal without selling this one.
Negotiation context
- It's been on market 16 days — a 2% lower offer ($246k) is reasonable based on typical stale-listing flexibility.
- 2 sale attempts since 12y ago with the ask held roughly flat each time — persistent listings suggest the price (not the market) is what's stuck; bring a comps-based counter.
- Current owner paid $80k; list at $250k implies a 212% gain — meaningful room to come down on a strong offer.
Risks & watch-outs
- Watch-outs: built in 1920 — expect roof / HVAC / electrical / plumbing capex.
- Climate carrying-cost: major flood risk — expect insurance premiums to compound above CPI over the hold.
Questions for the listing agent
- What do current leases actually rent for vs. the listed asking? Can we see a recent rent roll and the last 12 months of T-12 income?
- Built in 1920 — when were the roof, HVAC, electrical panel, plumbing, and water heater last replaced?
- What does the HOA fee cover, when was the last increase, and are there any pending special assessments or reserve-fund shortfalls?
- Is there a deadline driving the sale (1031 exchange, divorce, estate, relocation)? That informs how much negotiation room exists.
- Crime grade is F in this area — have there been break-ins, vandalism, or insurance claims at this property in the last 3 years? What carrier currently insures it and at what premium?
- The area grade is low — what's the realistic commute time and amenity access for the typical tenant pool here? Any planned neighborhood developments (good or bad) we should know about?
- This sits on a lake — are riparian / water-frontage rights deeded with the parcel? Any dock permits, shoreline easements, or HOA water-use restrictions?
- What's the documented flood / surge / shoreline-erosion history here (FEMA AND non-FEMA — e.g., storm surge, creek backup, septic-field saturation)?
- Any water-quality or seasonal algae-bloom issues that affect tenant satisfaction or short-term-rental demand?
- What's the average days-on-market for RENTAL listings here right now (not sales)? A rising rental-DOM trend means longer vacancies and softer asking-rent achievability than the comps imply.
- What's the recent tenant-quality profile in this submarket — average credit score on applications, eviction rate, late-payment / NSF rate, and stable-employment percentage? A property-management company in the area should have these aggregated.
- How much new for-sale + rental construction is in the pipeline within 1–3 miles? Heavy new supply typically softens prices + rents 12–24 months out; constrained supply supports both.
Investment metrics
- 1% rule
- 0.68% ✗
- Cap rate
- 4.96%
- Cash-on-cash
- -4.76%
- DSCR
- 0.79
- GRM
- 12.2
CMA / ARV
No comps found within radius.
Projected returns pro-forma
10.0% appreciation · 3.0% rent growth · sell at horizon
- IRR
- 20.9%
- Equity multiple
- 2.69×
- Total profit
- $118,392
- Equity at exit
- $225,130
- IRR
- 19.0%
- Equity multiple
- 6.18×
- Total profit
- $362,462
- Equity at exit
- $485,501
Cash invested: $69,972 (down + closing). Projections, not guarantees.
Landlord ↔ Tenant lean methodology
- Overall (STATE)
- 15 Strongly Tenant-Friendly
- State New York
- 15 Strongly Tenant-Friendly · D+10
- County
- — inherits STATE
- City
- — inherits STATE
ZIP-level market 13622
- Home prices YoY
- 2.0%
- Active inventory
- 23
- Price-to-rent
- 12.2×
Monthly cashflow live
- Estimated rent
- $1,700 medium interval (Pro) →
- Mortgage (P&I)
- −$1,311
- Tax from tax record
- −$193 /mo · $2,317/yr
- Insurance
- −$104
- HOA
- −$13
- Vacancy / Maint / Mgmt
- −$357
- Net cashflow
- $-277
Break-even live
UW: 25.0% down · 7.5% · 30yr · 1.5% tax · 5.0% vac · 8.0% maint · 8.0% mgmt
Financing live
Cash to close
- Down payment
- $62,475
- Closing costs
- $7,497
- Reserves months
- —
- Total cash needed
- —
Loan-product check · same deal, 3 products live
Conventional
25% down · 7.5% · 30yr
- Down + closing
- —
- Monthly P&I
- —
- Monthly cashflow
- —
- DSCR
- —
- Eligible?
- —
Personal DTI + credit; lowest rate.
DSCR
20% down · 8.5% · 30yr
- Down + closing
- —
- Monthly P&I
- —
- Monthly cashflow
- —
- DSCR
- —
- Eligible?
- —
No personal income docs; deal must DSCR.
Hard money
10% down · 12.0% · 12mo
- Down + closing
- —
- Monthly P&I
- —
- Monthly cashflow
- —
- DSCR
- —
- Eligible?
- —
Short-term bridge; refi at stabilization.
HOA detail
- Monthly dues
- $13 · $156/yr
Listing history 12 events
-
2026-06-18days on market $249,900 Active 16 DOM
-
2026-06-17days on market $249,900 Active 15 DOM
-
2026-06-16days on market $249,900 Active 14 DOM
-
2026-06-15days on market $249,900 Active 13 DOM
-
2026-06-13days on market $249,900 Active 11 DOM
-
2026-06-12days on market $249,900 Active 10 DOM
-
2026-06-09days on market $249,900 Active 7 DOM
-
2026-06-08days on market $249,900 Active 6 DOM
-
2026-06-07days on market $249,900 Active 5 DOM
-
2026-06-07days on market $249,900 Active 4 DOM
-
2026-06-03remarks 691-char remark
-
2026-06-03$249,900 Active 1 DOM
ⓘ Source: listings_history table (triggers on properties + properties_extension) + one-shot
backfill from property_details.listing_events for pre-trigger history.
Tax reassessment forecast NY · Partial reset (capped growth)
- Current annual tax
- $2,317 · $193/mo
- Projected year-2 tax
- $3,270 · $273/mo
- Expected delta
- +$953/yr (+$79/mo · 41.1%)
ⓘ Screening estimate from a state-policy table — verify with the county assessor before closing.
Climate risk First Street
- Flood 6/10 Major FEMA zone X · 74% chance over 30 yrs
- Wildfire 1/10 Low
- Heat 1/10 Low 7 d/yr ≥92°F today · 15 d/yr by 30 yrs out
- Wind 1/10 Low 100% chance of damaging wind over 30 yrs
- Air quality 3/10 Moderate 2 unhealthy d/yr today · 3 by 30 yrs out
Nearby sold comps map
Loading sold comps map…
Walkable amenities ~0.75 mi
Loading nearby amenities…
Taxation est. · year 1
- Rental income
- $20,404
- − Mortgage interest
- −$13,998
- − Property taxes
- −$2,317
- − Insurance
- −$1,250
- − Repairs & maintenance
- −$1,632
- − Management
- −$1,632
- − HOA
- −$156
- − Depreciation
- −$7,270
- Taxable loss
- −$7,851
- Est. tax savings @ 24.0%
- +$1,884
- After-tax cash flow
- $-1,445/yr
For passive investors: Depreciation is non-cash, so a rental often shows a tax loss while cash-flowing — sheltering income. Rental losses are passive: they offset passive income freely, and up to $25,000/yr can offset ordinary (W-2) income if you actively participate and your MAGI is under $100k (phasing out to $0 by $150k); unused losses carry forward. On sale, claimed depreciation is recaptured at up to 25%, and gains may owe capital-gains tax (a 1031 exchange can defer both). Figures are a year-1 estimate at your 24.0% rate — not tax advice; consult a CPA.
Schools (NCES district)
- District
- Lyme Central School District
- NCES district ID
- 3617880
- Math proficiency
- 55% ▬ 0.00%
- Reading proficiency
- 50% ▬ 0.00%
- Median HH income
- $50,713
- Composite
- 46.85/100
- National rank
- #5197
- State rank
- #408 of 755 in NY
Livability — Chaumont
- Score
- 65/100
- State rank
- #708
- US rank
- #13451
Category grades
Schools grade is shown separately in the Schools card above.
Census & demographics
- Population (ZIP)
- 2,100
Population outlook (Jefferson County) Hauer SSP2
- Today (2025)
- 111,748 people
- By 2030
- 109,370 · -2.1%
- By 2040
- 103,828 · -7.1%
- By 2050
- 98,523 · -11.8%
- By 2075
- 91,422 · -18.2%
- By 2100
- 78,214 · -30.0%
Race, ethnicity, and origin ACS 2023
- Neighborhood character
- Predominantly White (90%)
- Race & ethnicity
- White 90% Two or more races 4% Black 4% Hispanic / Latino 2%
- Common ancestry
- Lithuanian 11% Italian 4% Romanian 2%
- Foreign-born
- 4% · Canada, Jamaica
- Languages at home
- 96% English-only · Spanish 2% Russian/Polish/Slavic 1% Arabic 1%
Political lean MEDSL · Jefferson
- 2024 margin
- Strong R (+23.6) · D 38.2% · R 61.8%
- 2008→2024 swing
- -18.3pp toward R · 2008: -5.3pp · 2024: -23.6pp
- All cycles
- 2024: R+23.6 2020: R+19.0 2016: R+22.4 2012: R+2.9 2008: R+5.3
Not yet ingested
- Civics
- —
Market trends
- HPI YoY
- ▲ 10.18%
- Current HPI
- 511.6638
- Rent YoY
- —
- Metro
- —
- State GDP YoY
- ▲ 2.60%
- F500 in state
- 92
Industry mix (Fortune 500 HQ in NY)
| Industry | F500 HQs | Revenue |
|---|---|---|
| Financial Services | 10 | $950B |
|
||
| Consumer Goods | 9 | $162B |
|
||
| Insurance | 4 | $225B |
|
||
| Telecommunications | 2 | $144B |
|
||
| Pharmaceuticals | 2 | $112B |
|
||
| Media / Entertainment | 2 | $69B |
|
||
Price history
+212.4% since first listed4 events — show timeline
- 2026-06-01 Listed $249,900 CNYIS
- 2014-05-13 Listing Removed — CNYIS
- 2014-04-24 Listed $109,900 CNYIS
- 2004-08-31 Sold (Public Records) $80,000 Public Records
Property tax history
+3.2%/yrLatest (2025): $2,317 · +28.4% YoY. Source: county tax records.
Cash-flow waterfall
monthlySold comps — $/sqft
last 12 mo · ≤1 miLoading sold comps…