 🔨 Auction
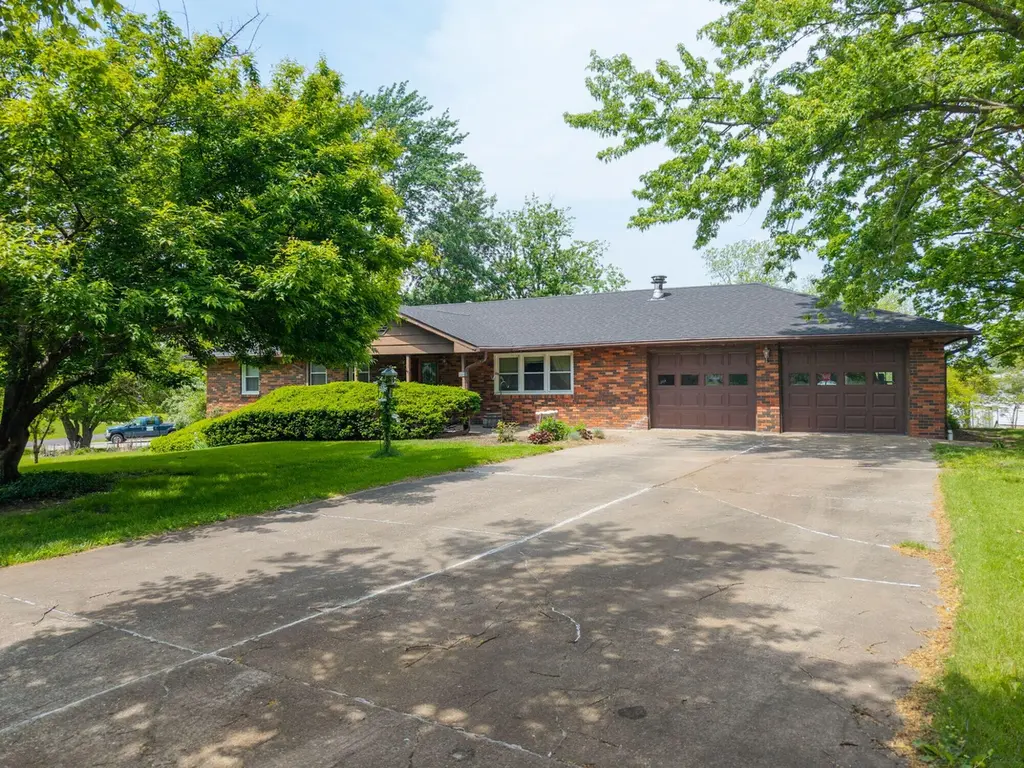
7721 E Sunny Vale Dr · Columbia, MO
Flood risk 1/10 · Minimal
- FEMA flood zone
- X (unshaded)
- Chance of flooding over 30 yrs
- 0.0%
- Est. flood insurance / yr
- $473 – $860
Fire risk 2/10 · Minimal
- Est. fire insurance / yr
- $1,054 – $1,958
Heat risk 4/10 · Minor
- Hot days now (above 105°F)
- 7 days/yr
- Hot days in 30 yrs
- 19 days/yr
Wind risk 2/10 · Minimal
- Chance of severe wind over 30 yrs
- —
Air-quality risk 2/10 · Minimal
- Unhealthy air days now
- 1 days/yr
- Unhealthy air days in 30 yrs
- 1 days/yr
Risk factors via First Street. Map © Google.
Why this score? — see what drove the F grade
The composite is a weighted blend of 9 inputs, each scored 0–100. Each bar is that input's sub-score; the figure is the points it added to the 100-point composite (weight × sub-score).
- ARV discount +7.5/15.0
- Cash flow +7.3/30.0
- Rent growth +5.0/5.0
- Livability +4.2/5.0
- Schools +3.1/10.0
- Condition / age +2.5/5.0
- 1% rule +1.5/10.0
- DSCR +1.4/10.0
- Appreciation +0.0/10.0
$80,000
🖨 Deal sheet 📄 Offer letter ✓ Due diligence
Listing remarks
This is an online reserve auction. The starting bid of $80,000 does not reflect the selling price. Opportunity awaits in Sunrise Estates! This brick ranch home offers 2,200+ finished sq. ft. and is ready for your updates and personal vision. Features include 3 bedrooms, 3 full bathrooms, enclosed sunporch, family room with fireplace, primary suite, attached 2-car garage, and finished walkout basement with wood stove insert, full bathroom, storage, and non-conforming bedroom (no closet). Additional excavated rear garage with 9'7'' overhead door provides ideal workshop or storage space. Excellent opportunity for flippers, investors, or buyers looking to make a home their own.
Key facts
- Primary suite
- Brick ranch home
- Enclosed sunporch
Tags
Property features AI
Exterior
- Parking: Attached garage with 3 spaces
- Utilities: Public water
- Home design: Single-family residence; Residential property
- Construction: Below-grade finished area present
- Exterior features: Covered patio/porch; Deck; Front porch; Cleared lot; Paved road access
Interior
- Kitchen: Water softener (owned)
- Flooring: Carpet
- Bathrooms: 3 full bathrooms
- Heating & cooling: Central air conditioning; Natural gas heating
- Interior features: Central vacuum; Walk-out basement access; Fireplace in the living room
Neighborhood map
What this means for you Summary
Snapshot
- This is a 3-bed/3.0-bath single-family listed at $80k.
Deal economics
- At list price, monthly cash flow is $-359 ($-4k/yr) — negative.
- The deal already cash-flows at list — no discount required.
- Meets the 1% rule at list price ($2k rent vs $80k).
- Recommended offer: $79k (1.5% below list) — sets the bar for market timing.
- Cap rate 4.7% vs local median 2.9% in Columbia — top-decile yield for the area; either an underpriced asset or a hidden risk that comps aren't pricing in. Stress-test before assuming the spread holds.
Location & tenants
- Location reads 83/100 on livability (#9 in MO, #862 nationally) — a professional / high-income tenant draw. Strengths: amenities A+, commute A+, cost of living A+; Watch: crime D+.
- Columbia 93 (urban): math 30% / reading 43% proficiency, ranked #194 of 324 in MO (top 60%) — families likely to look elsewhere, expect single-tenant / working-renter base with shorter leases.
- Zoned schools: Cedar Ridge Elem. (math 27% / reading 42%, grade F, #676 of 1,115 statewide, top 66%, 472 students, 43% FRL); Oakland Middle School (math 17% / reading 25%, grade F, #342 of 391 statewide, top 88%, 544 students, 59% FRL); Muriel W. Battle High School (math 7% / reading 47%, grade F, #420 of 521 statewide, top 82%, 1,581 students, 48% FRL).
- Market conditions: Rents rising fast (+10.3%/yr); 355 active listings in the ZIP; 4 comparable units currently listed for rent nearby; rentals lingering (median 44d on market — plan ~5-8 weeks vacancy on turnover, expect pricing pressure); 50% of comp listings sitting > 30 days — soft ceiling on asking rent; 1,303 units permitted in Boone County in 2024 (549 in 5+ unit buildings).
- This rent runs 43% of the median local income ($48k/yr) — at the standard rent-burdened threshold; future hikes will face affordability resistance.
Forward outlook
- Local home prices are declining (-3.0%/yr); year-one equity from $2k of loan paydown is wiped out by about $8k of value loss. Plan a longer hold.
- Boone County population projected at +36% by 2050 — long-run rental-demand tailwind backs the buy-and-hold thesis.
Negotiation context
- It's been on market 29 days — a 2% lower offer ($79k) is reasonable based on typical stale-listing flexibility.
Risks & watch-outs
- Watch-outs: property tax is 3.2% of price.
Questions for the listing agent
- What do current leases actually rent for vs. the listed asking? Can we see a recent rent roll and the last 12 months of T-12 income?
- Built in 1968 — when were the roof, HVAC, electrical panel, plumbing, and water heater last replaced?
- Property tax is high relative to price — has the assessment been appealed recently, and will the sale trigger a re-assessment?
- Is there a deadline driving the sale (1031 exchange, divorce, estate, relocation)? That informs how much negotiation room exists.
- Schools are B-rated — typically a magnet for longer-tenancy family renters. What's the average tenant stay here, and is there a school-zone premium baked into asking?
- Crime grade is D in this area — have there been break-ins, vandalism, or insurance claims at this property in the last 3 years? What carrier currently insures it and at what premium?
- The area grade is low — what's the realistic commute time and amenity access for the typical tenant pool here? Any planned neighborhood developments (good or bad) we should know about?
- What's the average days-on-market for RENTAL listings here right now (not sales)? A rising rental-DOM trend means longer vacancies and softer asking-rent achievability than the comps imply.
- What's the recent tenant-quality profile in this submarket — average credit score on applications, eviction rate, late-payment / NSF rate, and stable-employment percentage? A property-management company in the area should have these aggregated.
- How much new for-sale + rental construction is in the pipeline within 1–3 miles? Heavy new supply typically softens prices + rents 12–24 months out; constrained supply supports both.
Investment metrics
- 1% rule
- 0.65% ✗
- Cap rate
- 4.68%
- Cash-on-cash
- -5.76%
- DSCR
- 0.74
- GRM
- 12.8
CMA / ARV
- ARV (median comp)
- $266,990
- List price
- $80,000
- Delta
- -70.04%
- Verdict
- UNDERPRICED
- Comps
- 20 within 1.0 mi
Show comp detail 5 sales within ~0.75 mi
| Address | Dist | Beds/Ba | Sqft | Sold | Price | $/sf | Match |
|---|---|---|---|---|---|---|---|
| 7340 E Southern Dr | 0.50mi | 4/2.0 (+1) | 2,380 (+4%) | 11mo | $249,000 | $105 | 53 |
| 7380 E Sunny Vale Dr | 0.48mi | 3/2.0 | 2,444 (+6%) | 14mo | $265,000 | $108 | 51 |
| 560 NW West Park Ln | 0.25mi | 3/2.0 | 2,010 (-12%) | 16mo | $235,000 | $117 | 50 |
| 7440 E Sunny Vale Dr | 0.39mi | 4/2.5 (+1) | 2,152 (-6%) | 22mo | $264,500 | $123 | 46 |
| 70 N Luna Ln | 0.59mi | 3/2.5 | 1,970 (-14%) | 12mo | $397,800 | $202 | 37 |
Match score weights: distance 35% · size 25% · config 20% · recency 20%. Top-matched comps best support the ARV.
Projected returns pro-forma
-3.0% appreciation · 8.0% rent growth · sell at horizon
- IRR
- -21.2%
- Equity multiple
- 0.24×
- Total profit
- $-57,013
- Equity at exit
- $39,809
- IRR
- -6.6%
- Equity multiple
- 0.50×
- Total profit
- $-37,599
- Equity at exit
- $23,084
Cash invested: $74,757 (down + closing). Projections, not guarantees.
Landlord ↔ Tenant lean methodology
- Overall (STATE)
- 81 Strongly Landlord-Friendly
- State Missouri
- 81 Strongly Landlord-Friendly · R+10
- County
- — inherits STATE
- City
- — inherits STATE
ZIP-level market 65201
- Rents YoY
- 10.3%
- Active inventory
- 355
- Price-to-rent
- 3.8×
Monthly cashflow live
- Estimated rent
- $1,732 medium interval (Pro) →
- Mortgage (P&I)
- −$1,400
- Tax from tax record
- −$216 /mo · $2,592/yr
- Insurance
- −$111
- HOA
- −$0
- Vacancy / Maint / Mgmt
- −$364
- Net cashflow
- $-359
Break-even live
UW: 25.0% down · 7.5% · 30yr · 1.5% tax · 5.0% vac · 8.0% maint · 8.0% mgmt
Financing live
Cash to close
- Down payment
- $66,747
- Closing costs
- $8,010
- Reserves months
- —
- Total cash needed
- —
Loan-product check · same deal, 3 products live
Conventional
25% down · 7.5% · 30yr
- Down + closing
- —
- Monthly P&I
- —
- Monthly cashflow
- —
- DSCR
- —
- Eligible?
- —
Personal DTI + credit; lowest rate.
DSCR
20% down · 8.5% · 30yr
- Down + closing
- —
- Monthly P&I
- —
- Monthly cashflow
- —
- DSCR
- —
- Eligible?
- —
No personal income docs; deal must DSCR.
Hard money
10% down · 12.0% · 12mo
- Down + closing
- —
- Monthly P&I
- —
- Monthly cashflow
- —
- DSCR
- —
- Eligible?
- —
Short-term bridge; refi at stabilization.
Rent comps 4 comps
| Address | Beds | Baths | Sqft | Rent | $/sqft | DOM | Units | Dist |
|---|---|---|---|---|---|---|---|---|
| 61 N Broadview Ct Columbia, MO | 3.0 | 2.0 | 1850 | $1,775 | $0.96 | 43d | 1 | 0.65mi |
| 7452 Noah Ct Columbia, MO | 4.0 | 3.0 | 1644 | $1,625 | $0.99 | 43d | 1 | 0.73mi |
| 7455 Noah Ct Columbia, MO | 4.0 | 3.0 | 1644 | $1,625 | $0.99 | 21d | 1 | 0.76mi |
| 7900 E Saint Charles Rd Columbia, MO | 3.0 | 2.0 | 1610 | $1,675 | $1.04 | 13d | 1 | 0.77mi |
Listing history 10 events
-
2026-06-10status $80,000 Pending 29 DOM
-
2026-06-09days on market $80,000 Active 29 DOM
-
2026-06-08days on market $80,000 Active 28 DOM
-
2026-06-07days on market $80,000 Active 27 DOM
-
2026-06-05days on market $80,000 Active 24 DOM
-
2026-06-03days on market $80,000 Active 23 DOM
-
2026-06-02days on market $80,000 Active 22 DOM
-
2026-05-31days on market $80,000 Active 20 DOM
-
2026-05-30days on market $80,000 Active 19 DOM
-
2026-05-11$80,000 Active 682-char remark
ⓘ Source: listings_history table (triggers on properties + properties_extension) + one-shot
backfill from property_details.listing_events for pre-trigger history.
Tax reassessment forecast MO · Resets to sale price
- Current annual tax
- $2,592 · $216/mo
- Projected year-2 tax
- $2,592 · $216/mo
- Expected delta
- $0/yr ($0/mo · 0.0%)
ⓘ Screening estimate from a state-policy table — verify with the county assessor before closing.
Climate risk First Street
- Flood 1/10 Low FEMA zone X (unshaded) · 0% chance over 30 yrs
- Wildfire 2/10 Low
- Heat 4/10 Moderate 7 d/yr ≥105°F today · 19 d/yr by 30 yrs out
- Wind 2/10 Low
- Air quality 2/10 Low 1 unhealthy d/yr today · 1 by 30 yrs out
Nearby sold comps map
Loading sold comps map…
Walkable amenities ~0.75 mi
Loading nearby amenities…
Taxation est. · year 1
- Rental income
- $20,788
- − Mortgage interest
- −$14,956
- − Property taxes
- −$2,592
- − Insurance
- −$1,335
- − Repairs & maintenance
- −$1,663
- − Management
- −$1,663
- − Depreciation
- −$7,767
- Taxable loss
- −$9,188
- Est. tax savings @ 24.0%
- +$2,205
- After-tax cash flow
- $-2,101/yr
For passive investors: Depreciation is non-cash, so a rental often shows a tax loss while cash-flowing — sheltering income. Rental losses are passive: they offset passive income freely, and up to $25,000/yr can offset ordinary (W-2) income if you actively participate and your MAGI is under $100k (phasing out to $0 by $150k); unused losses carry forward. On sale, claimed depreciation is recaptured at up to 25%, and gains may owe capital-gains tax (a 1031 exchange can defer both). Figures are a year-1 estimate at your 24.0% rate — not tax advice; consult a CPA.
Schools (NCES district)
- District
- Columbia 93
- NCES district ID
- 2901000
- Math proficiency
- 30% ▼ -12.00%
- Reading proficiency
- 43% ▼ -4.00%
- Median HH income
- $46,547
- Composite
- 31.21/100
- National rank
- #6036
- State rank
- #194 of 324 in MO
Livability — Columbia
- Score
- 83/100
- State rank
- #9
- US rank
- #862
Category grades
Schools grade is shown separately in the Schools card above.
Census & demographics
- County
- Boone County · 158,877 people
- City population
- 158,877
- Metro
- Columbia, MO
- Population (ZIP)
- 50,011
- Household income
- $48,113
- Rent vs Own
- Severe rent burden
- 4323.0
Population outlook (Boone County) Hauer SSP2
- Today (2025)
- 202,891 people
- By 2030
- 217,799 · +7.3%
- By 2040
- 246,789 · +21.6%
- By 2050
- 276,116 · +36.1%
- By 2075
- 348,426 · +71.7%
- By 2100
- 400,856 · +97.6%
Race, ethnicity, and origin ACS 2023
- Neighborhood character
- Predominantly White (74%)
- Race & ethnicity
- White 74% Black 8% Two or more races 7% Asian 7% Hispanic / Latino 6%
- Hispanic origin (detail)
- Mexican 5%
- Common ancestry
- Slovak 2% Italian 2% Romanian 2%
- Foreign-born
- 9% · China, Canada, Vietnam
- Languages at home
- 88% English-only · Spanish 4% Chinese 2% Other Indo-European 2%
Political lean MEDSL · Boone
- 2024 margin
- Lean D (+9.8) · D 53.9% · R 44.1% · Other 2.1%
- 2008→2024 swing
- -2.2pp toward R · 2008: 12.0pp · 2024: 9.8pp
- All cycles
- 2024: D+9.8 2020: D+12.5 2016: D+5.9 2012: D+3.1 2008: D+12.0
Not yet ingested
- Civics
- —
Market trends
- HPI YoY
- ▼ -170.32%
- Current HPI
- 195.2059
- Rent YoY
- ▲ 10.33%
- Metro
- Columbia, MO
- State GDP YoY
- ▲ 1.84%
- F500 in state
- 20
Industry mix (Fortune 500 HQ in MO)
| Industry | F500 HQs | Revenue |
|---|---|---|
| Healthcare | 1 | $163B |
|
||
| Insurance | 1 | $21B |
|
||
| Industrial Technology | 1 | $17B |
|
||
| Retail | 1 | $16B |
|
||
| Industrial Distribution | 1 | $10B |
|
||
| Utilities | 1 | $9B |
|
||
Price history
2 events — show timeline
- 2026-06-09 Pending — CBORMLS
- 2026-05-11 Listed $80,000 CBORMLS
Property tax history
+2.4%/yrLatest (2025): $2,592 · +0.0% YoY. Source: county tax records.
Cash-flow waterfall
monthlySold comps — $/sqft
last 12 mo · ≤1 miLoading sold comps…