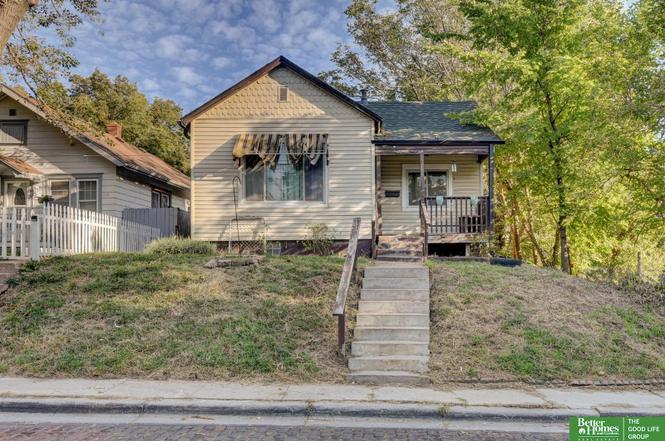
1914 Bancroft St · Omaha, NE
Flood risk 1/10 · Minimal
- FEMA flood zone
- X (unshaded)
- Chance of flooding over 30 yrs
- 0.0%
- Est. flood insurance / yr
- $473 – $860
Fire risk 2/10 · Minimal
- Est. fire insurance / yr
- $1,161 – $2,155
Heat risk 3/10 · Minor
- Hot days now (above 103°F)
- 7 days/yr
- Hot days in 30 yrs
- 14 days/yr
Wind risk 2/10 · Minimal
- Chance of severe wind over 30 yrs
- —
Air-quality risk 1/10 · Minimal
- Unhealthy air days now
- 0 days/yr
- Unhealthy air days in 30 yrs
- 0 days/yr
Risk factors via First Street. Map © Google.
Why this score? — see what drove the C grade
The composite is a weighted blend of 9 inputs, each scored 0–100. Each bar is that input's sub-score; the figure is the points it added to the 100-point composite (weight × sub-score).
- Cash flow +21.1/30.0
- ARV discount +12.4/15.0
- DSCR +6.7/10.0
- 1% rule +5.8/10.0
- Livability +4.2/5.0
- Rent growth +2.7/5.0
- Condition / age +2.5/5.0
- Schools +2.1/10.0
- Appreciation +0.0/10.0
$110,000
🖨 Deal sheet 📄 Offer letter ✓ Due diligence
Listing remarks MLS
Immaculate! Completely Updated New Vinyl Siding, Gutters, Awnings, Roof Gables, Insulation. Interior Has Newer Carpet, Partially Finished Basement With 2 Year Old Furnace, Some
Key facts
- South omaha location
- Local amenities
- 6,480 sq ft lot
Tags
Neighborhood map
What this means for you Summary
Snapshot
- This is a 2-bed/1.0-bath single-family listed at $110k.
Deal economics
- At list price, monthly cash flow is $157 ($2k/yr) — positive.
- The deal already cash-flows at list — no discount required.
- Meets the 1% rule at list price ($1k rent vs $110k).
- Cap rate 8.0% vs local median 3.6% in Omaha — top-decile yield for the area; either an underpriced asset or a hidden risk that comps aren't pricing in. Stress-test before assuming the spread holds.
Location & tenants
- Location reads 84/100 on livability (#7 in NE, #663 nationally) — a professional / high-income tenant draw. Strengths: amenities A+, commute A+, cost of living A+; Watch: crime F.
- Omaha Public Schools (urban): math 20% / reading 28% proficiency, ranked #110 of 111 in NE (top 99%) — low school quality limits family demand, transient renter base, plan for 1-2y turnover; 62% free/reduced lunch — lower-income household profile, screen leases tightly.
- Zoned schools: Castelar Elementary School (math 11% / reading 20%, grade F, #479 of 502 statewide, top 95%, 519 students, 0% FRL); Norris Middle School (math 11% / reading 16%, grade F, #126 of 128 statewide, top 98%, 1,187 students, 0% FRL); South High School (math 11% / reading 13%, grade F, #254 of 261 statewide, top 98%, 2,686 students, 0% FRL) — zoned schools average 0% FRL vs 62% district-wide (62 pts lower); this property's tenant base skews higher-income than the district average.
- Market conditions: Rents flat; 73 active listings in the ZIP; 40 comparable units currently listed for rent nearby; rentals at typical pace (median 24d on market — plan ~3-4 weeks tenant-placement turnaround); 4,539 units permitted in Douglas County in 2024 (2,583 in 5+ unit buildings).
Forward outlook
- Local home prices are declining (-3.0%/yr); year-one equity from $761 of loan paydown is wiped out by about $3k of value loss. Plan a longer hold.
- Douglas County population projected at +28% by 2050 — long-run rental-demand tailwind backs the buy-and-hold thesis.
Negotiation context
- Only 6 days on market — expect competitive offers; lowballing is unlikely to land.
- 2 sale attempts since 23y ago with the ask held roughly flat each time — persistent listings suggest the price (not the market) is what's stuck; bring a comps-based counter.
Risks & watch-outs
- Watch-outs: built in 1920 — expect roof / HVAC / electrical / plumbing capex.
Questions for the listing agent
- Built in 1920 — when were the roof, HVAC, electrical panel, plumbing, and water heater last replaced?
- Is there a deadline driving the sale (1031 exchange, divorce, estate, relocation)? That informs how much negotiation room exists.
- Crime grade is F in this area — have there been break-ins, vandalism, or insurance claims at this property in the last 3 years? What carrier currently insures it and at what premium?
- What's the average days-on-market for RENTAL listings here right now (not sales)? A rising rental-DOM trend means longer vacancies and softer asking-rent achievability than the comps imply.
- What's the recent tenant-quality profile in this submarket — average credit score on applications, eviction rate, late-payment / NSF rate, and stable-employment percentage? A property-management company in the area should have these aggregated.
- How much new for-sale + rental construction is in the pipeline within 1–3 miles? Heavy new supply typically softens prices + rents 12–24 months out; constrained supply supports both.
Investment metrics
- 1% rule
- 1.08% ✓
- Cap rate
- 8.01%
- Cash-on-cash
- 6.12%
- DSCR
- 1.27
- GRM
- 7.7
CMA / ARV
- ARV (on-the-fly)
- $123,300
- Comps found
- 12
Show comp detail 12 sales within ~0.75 mi
| Address | Dist | Beds/Ba | Sqft | Sold | Price | $/sf | Match |
|---|---|---|---|---|---|---|---|
| 1914 Bancroft St | 0.00mi | 2/1.5 | 900 (0%) | 6mo | $98,000 | $109 | 93 |
| 2933 S 18th St | 0.19mi | 2/1.0 | 896 (-0%) | 4mo | $158,000 | $176 | 88 |
| 2428 S 19th St | 0.11mi | 2/1.5 | 952 (+6%) | 6mo | $105,000 | $110 | 78 |
| 2507 Bancroft St | 0.40mi | 2/1.0 | 852 (-5%) | 7mo | $87,500 | $103 | 67 |
| 1902 S 14th St | 0.59mi | 2/1.0 | 872 (-3%) | 1mo | $185,000 | $212 | 66 |
| 1416 Dorcas St | 0.47mi | 2/1.0 | 987 (+10%) | 3mo | $92,500 | $94 | 59 |
| 2328 S 10 St | 0.63mi | 2/1.0 | 942 (+5%) | 6mo | $145,000 | $154 | 58 |
| 1724 S 17th St | 0.54mi | 2/1.0 | 790 (-12%) | 1mo | $147,000 | $186 | 53 |
| 2508 S 26th St | 0.45mi | 1/1.0 (-1) | 812 (-10%) | 5mo | $100,000 | $123 | 53 |
| 2766 Dupont St | 0.59mi | 2/1.0 | 828 (-8%) | 14mo | $167,500 | $202 | 48 |
| 2510 S 26th St | 0.45mi | 1/1.0 (-1) | 784 (-13%) | 5mo | $100,000 | $128 | 48 |
| 2329 S 11th St | 0.60mi | 2/1.0 | 988 (+10%) | 12mo | $135,000 | $137 | 46 |
Match score weights: distance 35% · size 25% · config 20% · recency 20%. Top-matched comps best support the ARV.
Projected returns pro-forma
-3.0% appreciation · 0.85% rent growth · sell at horizon
- IRR
- -9.4%
- Equity multiple
- 0.67×
- Total profit
- $-10,312
- Equity at exit
- $16,401
- IRR
- -3.2%
- Equity multiple
- 0.81×
- Total profit
- $-5,878
- Equity at exit
- $9,511
Cash invested: $30,800 (down + closing). Projections, not guarantees.
Landlord ↔ Tenant lean methodology
- Overall (STATE)
- 83 Strongly Landlord-Friendly
- State Nebraska
- 83 Strongly Landlord-Friendly · R+13
- County
- — inherits STATE
- City
- — inherits STATE
ZIP-level market 68108
- Home prices YoY
- -19.0%
- Rents YoY
- 0.8%
- Active inventory
- 73
- Price-to-rent
- 7.7×
Monthly cashflow live
- Estimated rent
- $1,190 high interval (Pro) →
- Mortgage (P&I)
- −$577
- Tax from tax record
- −$161 /mo · $1,926/yr
- Insurance
- −$46
- HOA
- −$0
- Vacancy / Maint / Mgmt
- −$250
- Net cashflow
- $157
Break-even live
UW: 25.0% down · 7.5% · 30yr · 1.5% tax · 5.0% vac · 8.0% maint · 8.0% mgmt
Financing live
Cash to close
- Down payment
- $27,500
- Closing costs
- $3,300
- Reserves months
- —
- Total cash needed
- —
Loan-product check · same deal, 3 products live
Conventional
25% down · 7.5% · 30yr
- Down + closing
- —
- Monthly P&I
- —
- Monthly cashflow
- —
- DSCR
- —
- Eligible?
- —
Personal DTI + credit; lowest rate.
DSCR
20% down · 8.5% · 30yr
- Down + closing
- —
- Monthly P&I
- —
- Monthly cashflow
- —
- DSCR
- —
- Eligible?
- —
No personal income docs; deal must DSCR.
Hard money
10% down · 12.0% · 12mo
- Down + closing
- —
- Monthly P&I
- —
- Monthly cashflow
- —
- DSCR
- —
- Eligible?
- —
Short-term bridge; refi at stabilization.
Rent comps 40 comps
| Address | Beds | Baths | Sqft | Rent | $/sqft | DOM | Units | Dist |
|---|---|---|---|---|---|---|---|---|
| 2416 S 16th St Unit 2426 Omaha, NE | 1.0 | 1.0 | 1005 | $850 | $0.85 | 23d | 1 | 0.24mi |
| 1618 Martha St Unit 2 (Top) Omaha, NE | 3.0 | 1.0 | 1117 | $1,150 | $1.03 | 43d | 1 | 0.33mi |
| 2201 Vinton St Omaha, NE | 2.0 | 1.0 | 890 | $1,029 | $1.16 | 3d | 2 | 0.39mi |
| 2716 S 25th St Omaha, NE | 2.0 | 1.0 | 1040 | $1,250 | $1.20 | 43d | 1 | 0.40mi |
| 2612 S 12th St Omaha, NE | 3.0 | 2.0 | 1100 | $2,100 | $1.91 | 14d | 1 | 0.45mi |
| 1911 S 14th St Unit 1 Omaha, NE | 2.0 | 1.0 | 836 | $1,000 | $1.20 | 43d | 1 | 0.60mi |
| 1937 S 12th St Unit 3 Omaha, NE | 1.0 | 1.0 | 700 | $620 | $0.89 | 3d | 1 | 0.65mi |
| 1730 S 11th St Unit 35 Omaha, NE | 1.0 | 1.0 | 610 | $1,075 | $1.76 | 43d | 1 | 0.74mi |
| 1730 S 11th St Unit 22 Omaha, NE | 1.0 | 1.0 | 610 | $1,075 | $1.76 | 3d | 1 | 0.74mi |
| 1416 S 16th St Unit 105 Omaha, NE | 1.0 | 1.0 | 900 | $925 | $1.03 | 3d | 1 | 0.78mi |
| 3810 S 13th St Omaha, NE | 1.0–2.0 | 1.0 | 775 | $1,000 | $1.29 | 14d | 3 | 0.81mi |
| 1440 S 13th St Unit 203 Omaha, NE | 1.0 | 1.0 | 641 | $1,290 | $2.01 | 23d | 1 | 0.81mi |
| 1440 S 13th St Unit 205 Omaha, NE | 1.0 | 1.0 | 650 | $1,300 | $2.00 | 23d | 1 | 0.81mi |
| 1440 S 13th St Omaha, NE | 1.0 | 1.0 | 645 | $1,295 | $2.01 | 10d | 2 | 0.81mi |
| 1440 S 13th St Omaha, NE | 2.0 | 1.0–2.0 | 707 | $1,860 | $2.63 | 43d | 6 | 0.81mi |
| 3814 S 24th St Unit 2 Omaha, NE | 1.0 | 1.0 | 850 | $950 | $1.12 | 3d | 1 | 0.84mi |
| 3814 S 24th St Unit 3 Omaha, NE | 1.0 | 1.0 | 850 | $800 | $0.94 | 43d | 1 | 0.84mi |
| 3814 S 24th St Unit 4 Omaha, NE | 2.0 | 1.0 | 850 | $850 | $1.00 | 43d | 1 | 0.84mi |
| 1402 S 13th St Unit 2 Omaha, NE | 1.0 | 1.0 | 589 | $725 | $1.23 | 43d | 1 | 0.88mi |
| 1910 1/2 S 8th St Omaha, NE | 2.0 | 1.0 | 1116 | $1,350 | $1.21 | 3d | 1 | 0.88mi |
| 1911 Park Ave Apt 4 Omaha, NE | 1.0 | 1.0 | 700 | $725 | $1.04 | 23d | 1 | 0.89mi |
| 2011 S 7th St Omaha, NE | 2.0 | 1.0 | 750 | $975 | $1.30 | 14d | 1 | 0.93mi |
| 1323 S 12th St Omaha, NE | 1.0–2.0 | 1.0–2.0 | 958 | $2,100 | $2.19 | 2d | 1 | 0.94mi |
| 1233 1/2 S 14th St Omaha, NE | 1.0 | 1.0 | 576 | $1,000 | $1.74 | 43d | 1 | 0.96mi |
| 2415 E St Unit 4 Omaha, NE | 3.0 | 1.0 | 1000 | $1,150 | $1.15 | 14d | 1 | 0.99mi |
| 1109 S 22nd St Omaha, NE | 1.0 | 1.0 | 800 | $1,100 | $1.38 | 43d | 1 | 1.01mi |
| 1517 S 8th St Omaha, NE | 1.0–2.0 | 1.0–2.0 | 865 | $2,000 | $2.31 | 1d | 90 | 1.03mi |
| 3311 S 32nd Ave Unit GBR3311 Omaha, NE | 2.0 | 1.0 | 800 | $1,095 | $1.37 | 43d | 1 | 1.07mi |
| 913 Forest Ave Unit 913-1 Omaha, NE | 2.0 | 2.0 | 1100 | $1,695 | $1.54 | 14d | 1 | 1.11mi |
| 4131 S 25th St Apt 16 Omaha, NE | 1.0 | 1.0 | 700 | $725 | $1.04 | 43d | 1 | 1.12mi |
| 1311 S 9th St Omaha, NE | 1.0 | 1.0 | 743 | $1,350 | $1.82 | 1d | 37 | 1.13mi |
| 925 Pierce St Unit 112 Omaha, NE | 2.0 | 2.0 | 1086 | $1,795 | $1.65 | 3d | 1 | 1.14mi |
| 925 Pierce St Unit 223 Omaha, NE | 2.0 | 1.0 | 1056 | $1,600 | $1.52 | 23d | 1 | 1.14mi |
| 925 Pierce St Apt 219 Omaha, NE | 1.0 | 1.0 | 715 | $1,395 | $1.95 | 3d | 1 | 1.14mi |
| 925 Pierce St Unit 123 Omaha, NE | 2.0 | 1.0 | 1056 | $1,895 | $1.79 | 43d | 1 | 1.14mi |
| 1012 S 24th St Omaha, NE | 1.0–3.0 | 1.0 | 918 | $1,050 | $1.14 | 3d | 5 | 1.16mi |
| 1325 S 30th Ave Unit 1 Omaha, NE | 1.0 | 1.0 | 600 | $950 | $1.58 | 14d | 1 | 1.17mi |
| 1330 S 30th Ave #2 Omaha, NE | 1.0 | 1.0 | 600 | $750 | $1.25 | 3d | 1 | 1.19mi |
| 1330 S 30th Ave #3 Omaha, NE | 2.0 | 1.0 | 700 | $845 | $1.21 | 43d | 1 | 1.19mi |
| 815 Pierce St Omaha, NE | 3.0 | 1.0 | 968 | $1,500 | $1.55 | 23d | 1 | 1.19mi |
Listing history 7 events
-
2026-01-06soldstatus $101,049
-
2025-10-07status Pending
-
2025-10-01$110,000 New
-
2003-10-01soldstatus $52,000
-
2003-09-26soldstatus $51,950 176-char remark
Show marketing remark (176 chars)
Immaculate! Completely Updated New Vinyl Siding, Gutters, Awnings, Roof Gables, Insulation. Interior Has Newer Carpet, Partially Finished Basement With 2 Year Old Furnace, Some
-
2003-08-25$51,950 176-char remark
Show marketing remark (176 chars)
Immaculate! Completely Updated New Vinyl Siding, Gutters, Awnings, Roof Gables, Insulation. Interior Has Newer Carpet, Partially Finished Basement With 2 Year Old Furnace, Some
-
2003-08-25historical 176-char remark
Show marketing remark (176 chars)
Immaculate! Completely Updated New Vinyl Siding, Gutters, Awnings, Roof Gables, Insulation. Interior Has Newer Carpet, Partially Finished Basement With 2 Year Old Furnace, Some
ⓘ Source: listings_history table (triggers on properties + properties_extension) + one-shot
backfill from property_details.listing_events for pre-trigger history.
Tax reassessment forecast NE · Resets to sale price
- Current annual tax
- $1,926 · $161/mo
- Projected year-2 tax
- $1,926 · $161/mo
- Expected delta
- $0/yr ($0/mo · 0.0%)
ⓘ Screening estimate from a state-policy table — verify with the county assessor before closing.
Climate risk First Street
- Flood 1/10 Low FEMA zone X (unshaded) · 0% chance over 30 yrs
- Wildfire 2/10 Low
- Heat 3/10 Moderate 7 d/yr ≥103°F today · 14 d/yr by 30 yrs out
- Wind 2/10 Low
- Air quality 1/10 Low 0 unhealthy d/yr today · 0 by 30 yrs out
Nearby sold comps map
Loading sold comps map…
Walkable amenities ~0.75 mi
Loading nearby amenities…
Taxation est. · year 1
- Rental income
- $14,282
- − Mortgage interest
- −$6,162
- − Property taxes
- −$1,926
- − Insurance
- −$550
- − Repairs & maintenance
- −$1,143
- − Management
- −$1,143
- − Depreciation
- −$3,200
- Taxable income
- $159
- Est. tax owed @ 24.0%
- −$38
- After-tax cash flow
- $1,846/yr
For passive investors: Depreciation is non-cash, so a rental often shows a tax loss while cash-flowing — sheltering income. Rental losses are passive: they offset passive income freely, and up to $25,000/yr can offset ordinary (W-2) income if you actively participate and your MAGI is under $100k (phasing out to $0 by $150k); unused losses carry forward. On sale, claimed depreciation is recaptured at up to 25%, and gains may owe capital-gains tax (a 1031 exchange can defer both). Figures are a year-1 estimate at your 24.0% rate — not tax advice; consult a CPA.
Schools (NCES district)
- District
- Omaha Public Schools
- NCES district ID
- 3174820
- Math proficiency
- 20% ▼ -10.00%
- Reading proficiency
- 28% ▼ -5.00%
- Median HH income
- $46,039
- Composite
- 20.83/100
- National rank
- #8502
- State rank
- #110 of 111 in NE
Livability — Omaha
- Score
- 84/100
- State rank
- #7
- US rank
- #663
Category grades
Schools grade is shown separately in the Schools card above.
Census & demographics
- Census place
- Omaha, NE
- County
- Douglas County · 538,646 people
- City population
- 552,986
- Metro
- Omaha-Council Bluffs, NE-IA
- Population (ZIP)
- 14,578
- Household income
- $53,609
- Rent vs Own
- Severe rent burden
- 511.0
Population outlook (Douglas County) Hauer SSP2
- Today (2025)
- 625,245 people
- By 2030
- 661,613 · +5.8%
- By 2040
- 732,395 · +17.1%
- By 2050
- 801,988 · +28.3%
- By 2075
- 968,637 · +54.9%
- By 2100
- 1,101,871 · +76.2%
Race, ethnicity, and origin ACS 2023
- Neighborhood character
- Diverse neighborhood (Simpson 0.57)
- Race & ethnicity
- Hispanic / Latino 47% White 45% Two or more races 18% Black 2% Native American 2% Asian 1%
- Hispanic origin (detail)
- Mexican 33%
- Common ancestry
- Romanian 3% Lithuanian 2% Portuguese 2%
- Foreign-born
- 21% · Canada
- Languages at home
- 57% English-only · Spanish 40% Korean 2%
Political lean MEDSL · Douglas
- 2024 margin
- D (+10.2) · D 54.4% · R 44.2% · Other 1.4%
- 2008→2024 swing
- +5.5pp toward D · 2008: 4.6pp · 2024: 10.2pp
- All cycles
- 2024: D+10.2 2020: D+11.3 2016: D+1.4 2012: R+4.3 2008: D+4.6
Not yet ingested
- Civics
- —
Market trends
- HPI YoY
- ▼ -75.17%
- Current HPI
- 320.3596
- Rent YoY
- ▲ 0.85%
- Metro
- Omaha-Council Bluffs, NE-IA
- State GDP YoY
- ▲ 0.68%
- F500 in state
- 2
Industry mix (Fortune 500 HQ in NE)
| Industry | F500 HQs | Revenue |
|---|---|---|
| Conglomerate | 1 | $371B |
|
||
Price history
+94.5% since first listed7 events — show timeline
- 2026-01-06 Sold (Public Records) $101,049 Public Records
- 2025-10-07 Pending — GPRMLS
- 2025-10-01 Listed $110,000 GPRMLS
- 2003-10-01 Sold (Public Records) $52,000 Public Records
- 2003-09-26 Sold (MLS) $51,950 GPRMLS
- 2003-08-25 Listing Removed — GPRMLS
- 2003-08-25 Listed $51,950 GPRMLS
Property tax history
+8.2%/yrLatest (2025): $1,926 · +0.5% YoY. Source: county tax records.
Cash-flow waterfall
monthlySold comps — $/sqft
last 12 mo · ≤1 miLoading sold comps…