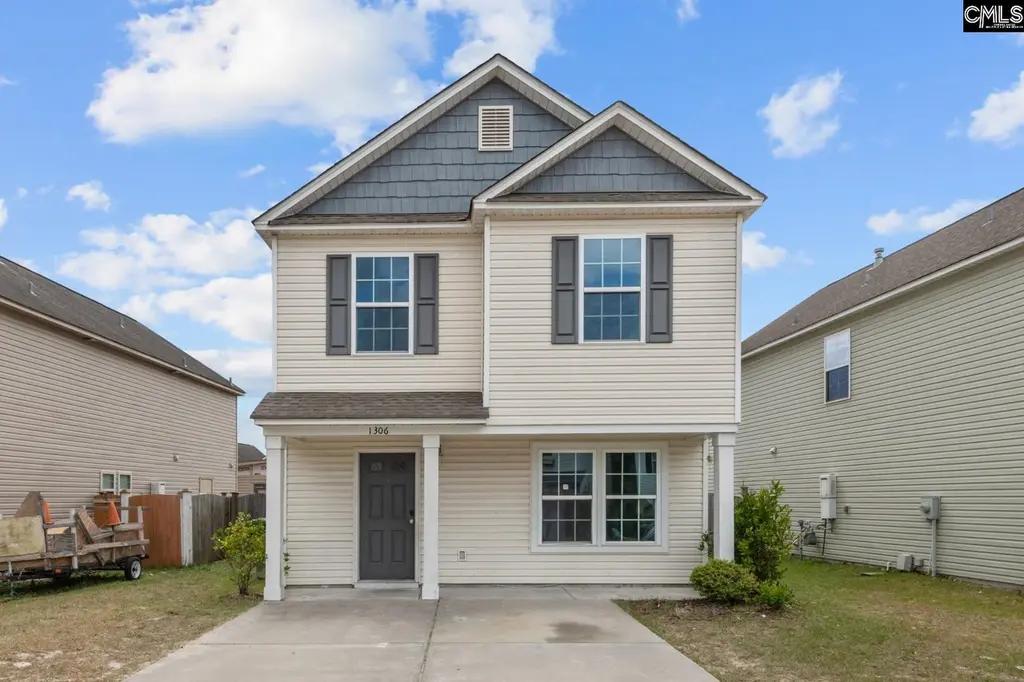
1306 Rabon Pond Dr · Dentsville, SC
Flood risk 1/10 · Minimal
- FEMA flood zone
- X (unshaded)
- Chance of flooding over 30 yrs
- 0.0%
- Est. flood insurance / yr
- $507 – $1,088
Fire risk 3/10 · Minor
- Est. fire insurance / yr
- $783 – $1,453
Heat risk 7/10 · Major
- Hot days now (above 108°F)
- 7 days/yr
- Hot days in 30 yrs
- 17 days/yr
Wind risk 6/10 · Moderate
- Chance of severe wind over 30 yrs
- 67.0%
Air-quality risk 3/10 · Minor
- Unhealthy air days now
- 3 days/yr
- Unhealthy air days in 30 yrs
- 3 days/yr
Risk factors via First Street. Map © Google.
Why this score? — see what drove the D grade
The composite is a weighted blend of 9 inputs, each scored 0–100. Each bar is that input's sub-score; the figure is the points it added to the 100-point composite (weight × sub-score).
- Cash flow +13.0/30.0
- ARV discount +9.1/15.0
- DSCR +3.9/10.0
- Schools +3.6/10.0
- Livability +3.6/5.0
- 1% rule +2.9/10.0
- Rent growth +2.6/5.0
- Condition / age +2.5/5.0
- Appreciation +0.0/10.0
$219,900
🖨 Deal sheet 📄 Offer letter ✓ Due diligence
Listing remarks
Come see this beautiful and updated home located so conveniently in the heart of Columbia. This property is only minutes from I-77 I-20 making it a quick and easy commute anywhere you would need to be within the Columbia area including Fort Jackson, Downtown, Williams Brice, USC just to name a few. This home has been renovated and is ready for its next owner! Home sits on a large lot and has access through the back gate as well as the front driveway, making it very easy to store extra vehicles, trailers, or whatever you need. Updates include LVP flooring throughout, living areas, brand new tankless water heater, new paint throughout new fixtures, new lighting fixtures, so much more. This is
Key facts
- Large lot
- Updated home
- Back gate access
Tags
Neighborhood map
What this means for you Summary
Snapshot
- This is a 3-bed/3.0-bath single-family listed at $220k.
Deal economics
- At list price, monthly cash flow is $-13 ($-161/yr) — negative.
- To cash-flow at today's rent, offer at most $218k (1.1% below list).
- To meet the 1% rule (rent ≥ 1% of price), the offer needs to be $173k (21.4% below list).
- Recommended offer: $173k (21.4% below list) — sets the bar for 1% rule.
Location & tenants
- Location reads 71/100 on livability (#50 in SC) — a middle-class / working-renter tenant base. Strengths: cost of living A+, health & safety A+, housing A; Watch: amenities D+, crime F, commute F.
- Richland 02 (suburban): math 35% / reading 47% proficiency, ranked #29 of 80 in SC (top 36%) — families likely to look elsewhere, expect single-tenant / working-renter base with shorter leases.
- Zoned schools: Windsor Elementary (math 21% / reading 23%, grade F, #475 of 597 statewide, top 81%, 537 students, 100% FRL) — zoned schools average 100% FRL vs 38% district-wide (62 pts higher); higher-poverty schools than district average — tighter screening recommended.
- Zoned-school proficiency averages 22% at this address vs 41% district-wide (-19 pts) — the specific schools serving this property underperform the Richland 02 average; the district grade overstates school quality for this exact location.
- Market conditions: Rents flat; 341 active listings in the ZIP; 10 comparable units currently listed for rent nearby; rentals at typical pace (median 15d on market — plan ~3-4 weeks tenant-placement turnaround); 3,472 units permitted in Richland County in 2024 (1,096 in 5+ unit buildings).
- This rent runs 33% of the median local income ($62k/yr) — at the standard rent-burdened threshold; future hikes will face affordability resistance.
Forward outlook
- Local home prices are declining (-3.0%/yr); year-one equity from $2k of loan paydown is wiped out by about $7k of value loss. Plan a longer hold.
- Richland County population projected at +30% by 2050 — long-run rental-demand tailwind backs the buy-and-hold thesis.
Negotiation context
- It's been on market 23 days — a 2% lower offer ($217k) is reasonable based on typical stale-listing flexibility.
Risks & watch-outs
- Climate carrying-cost: major wind risk, 67% chance of damaging wind over 30y; extreme-heat days projected 7→17/yr by 2055 (HVAC capex compounding) — expect insurance premiums to compound above CPI over the hold.
Questions for the listing agent
- What do current leases actually rent for vs. the listed asking? Can we see a recent rent roll and the last 12 months of T-12 income?
- Is there a deadline driving the sale (1031 exchange, divorce, estate, relocation)? That informs how much negotiation room exists.
- Schools are D-rated, which usually means shorter tenancies and higher turnover. Who's the typical renter profile here, and what's been the actual vacancy rate?
- Crime grade is F in this area — have there been break-ins, vandalism, or insurance claims at this property in the last 3 years? What carrier currently insures it and at what premium?
- The area grade is low — what's the realistic commute time and amenity access for the typical tenant pool here? Any planned neighborhood developments (good or bad) we should know about?
- What's the average days-on-market for RENTAL listings here right now (not sales)? A rising rental-DOM trend means longer vacancies and softer asking-rent achievability than the comps imply.
- What's the recent tenant-quality profile in this submarket — average credit score on applications, eviction rate, late-payment / NSF rate, and stable-employment percentage? A property-management company in the area should have these aggregated.
- How much new for-sale + rental construction is in the pipeline within 1–3 miles? Heavy new supply typically softens prices + rents 12–24 months out; constrained supply supports both.
Investment metrics
- 1% rule
- 0.79% ✗
- Cap rate
- 6.22%
- Cash-on-cash
- -0.26%
- DSCR
- 0.99
- GRM
- 10.6
CMA / ARV
- ARV (on-the-fly)
- $227,752
- Comps found
- 1
Show comp detail 1 sale within ~0.75 mi
| Address | Dist | Beds/Ba | Sqft | Sold | Price | $/sf | Match |
|---|---|---|---|---|---|---|---|
| 908 Yarrow | 0.03mi | 3/2.5 | 1,421 (+4%) | 9mo | $236,000 | $166 | 84 |
Match score weights: distance 35% · size 25% · config 20% · recency 20%. Top-matched comps best support the ARV.
Projected returns pro-forma
-3.0% appreciation · 0.21% rent growth · sell at horizon
- IRR
- -19.6%
- Equity multiple
- 0.33×
- Total profit
- $-41,266
- Equity at exit
- $32,788
- IRR
- -19.0%
- Equity multiple
- 0.10×
- Total profit
- $-55,590
- Equity at exit
- $19,013
Cash invested: $61,572 (down + closing). Projections, not guarantees.
Landlord ↔ Tenant lean methodology
- Overall (STATE)
- 90 Strongly Landlord-Friendly
- State South Carolina
- 90 Strongly Landlord-Friendly · R+6
- County
- — inherits STATE
- City
- — inherits STATE
ZIP-level market 29223
- Rents YoY
- 0.2%
- Active inventory
- 341
- Price-to-rent
- 10.6×
Monthly cashflow live
- Estimated rent
- $1,727 high interval (Pro) →
- Mortgage (P&I)
- −$1,153
- Tax from tax record
- −$133 /mo · $1,599/yr
- Insurance
- −$92
- HOA
- −$0
- Vacancy / Maint / Mgmt
- −$363
- Net cashflow
- $-13
Break-even live
UW: 25.0% down · 7.5% · 30yr · 1.5% tax · 5.0% vac · 8.0% maint · 8.0% mgmt
Financing live
Cash to close
- Down payment
- $54,975
- Closing costs
- $6,597
- Reserves months
- —
- Total cash needed
- —
Loan-product check · same deal, 3 products live
Conventional
25% down · 7.5% · 30yr
- Down + closing
- —
- Monthly P&I
- —
- Monthly cashflow
- —
- DSCR
- —
- Eligible?
- —
Personal DTI + credit; lowest rate.
DSCR
20% down · 8.5% · 30yr
- Down + closing
- —
- Monthly P&I
- —
- Monthly cashflow
- —
- DSCR
- —
- Eligible?
- —
No personal income docs; deal must DSCR.
Hard money
10% down · 12.0% · 12mo
- Down + closing
- —
- Monthly P&I
- —
- Monthly cashflow
- —
- DSCR
- —
- Eligible?
- —
Short-term bridge; refi at stabilization.
Rent comps 10 comps
| Address | Beds | Baths | Sqft | Rent | $/sqft | DOM | Units | Dist |
|---|---|---|---|---|---|---|---|---|
| 712 Blazing Star Trl Columbia, SC | 3.0 | 2.0 | 1100 | $1,699 | $1.54 | 3d | 1 | 0.09mi |
| 1152 Rabon Pond Dr Columbia, SC | 3.0 | 2.5 | 1522 | $1,799 | $1.18 | 11d | 1 | 0.22mi |
| 381 Valley Heights Ln Columbia, SC | 3.0 | 2.5 | 1471 | $1,719 | $1.17 | 23d | 1 | 0.37mi |
| 113 Charleswood Dr Columbia, SC | 4.0 | 1.5 | 1196 | $1,555 | $1.30 | 3d | 1 | 0.59mi |
| 125 Charleswood Dr Columbia, SC | 3.0 | 1.0 | 1074 | $1,350 | $1.26 | 23d | 1 | 0.61mi |
| 237 Foxhunt Rd Columbia, SC | 3.0 | 1.5 | 1008 | $1,250 | $1.24 | 14d | 1 | 0.79mi |
| 137 Carr Ln Columbia, SC | 3.0 | 2.5 | 1250 | $1,900 | $1.52 | 3d | 1 | 1.12mi |
| 109 Summer Vale Dr Columbia, SC | 4.0 | 2.5 | 1800 | $2,150 | $1.19 | 3d | 1 | 1.16mi |
| 500 Rockhaven Dr Columbia, SC | 3.0 | 2.0 | 1064 | $1,649 | $1.55 | 23d | 1 | 1.32mi |
| 2058 Mapleton Dr Columbia, SC | 3.0 | 2.5 | 1476 | $1,995 | $1.35 | 21d | 1 | 1.39mi |
Listing history 3 events
-
2026-04-24status Pending
-
2026-04-21price $219,900
-
2026-04-01$224,900 Active
ⓘ Source: listings_history table (triggers on properties + properties_extension) + one-shot
backfill from property_details.listing_events for pre-trigger history.
Tax reassessment forecast SC · Resets to sale price
- Current annual tax
- $1,599 · $133/mo
- Projected year-2 tax
- $1,599 · $133/mo
- Expected delta
- $0/yr ($0/mo · 0.0%)
ⓘ Screening estimate from a state-policy table — verify with the county assessor before closing.
Climate risk First Street
- Flood 1/10 Low FEMA zone X (unshaded) · 0% chance over 30 yrs
- Wildfire 3/10 Moderate
- Heat 7/10 Severe 7 d/yr ≥108°F today · 17 d/yr by 30 yrs out
- Wind 6/10 Major 67% chance of damaging wind over 30 yrs
- Air quality 3/10 Moderate 3 unhealthy d/yr today · 3 by 30 yrs out
Nearby sold comps map
Loading sold comps map…
Walkable amenities ~0.75 mi
Loading nearby amenities…
Taxation est. · year 1
- Rental income
- $20,729
- − Mortgage interest
- −$12,318
- − Property taxes
- −$1,599
- − Insurance
- −$1,100
- − Repairs & maintenance
- −$1,658
- − Management
- −$1,658
- − Depreciation
- −$6,397
- Taxable loss
- −$4,001
- Est. tax savings @ 24.0%
- +$960
- After-tax cash flow
- $799/yr
For passive investors: Depreciation is non-cash, so a rental often shows a tax loss while cash-flowing — sheltering income. Rental losses are passive: they offset passive income freely, and up to $25,000/yr can offset ordinary (W-2) income if you actively participate and your MAGI is under $100k (phasing out to $0 by $150k); unused losses carry forward. On sale, claimed depreciation is recaptured at up to 25%, and gains may owe capital-gains tax (a 1031 exchange can defer both). Figures are a year-1 estimate at your 24.0% rate — not tax advice; consult a CPA.
Schools (NCES district)
- District
- Richland 02
- NCES district ID
- 4503390
- Math proficiency
- 35% ▼ -15.00%
- Reading proficiency
- 47% ▼ -5.00%
- Median HH income
- $59,684
- Composite
- 36.2/100
- National rank
- #4730
- State rank
- #29 of 80 in SC
Livability — Dentsville
- Score
- 71/100
- State rank
- #50
- US rank
- #6940
Category grades
Schools grade is shown separately in the Schools card above.
Census & demographics
- County
- Richland County · 389,530 people
- City population
- 52,835
- Metro
- Columbia, SC
- Population (ZIP)
- 53,074
- Household income
- $62,408
- Rent vs Own
- Severe rent burden
- 2857.0
Population outlook (Richland County) Hauer SSP2
- Today (2025)
- 459,667 people
- By 2030
- 487,524 · +6.1%
- By 2040
- 542,035 · +17.9%
- By 2050
- 595,371 · +29.5%
- By 2075
- 732,998 · +59.5%
- By 2100
- 820,415 · +78.5%
Race, ethnicity, and origin ACS 2023
- Neighborhood character
- Diverse neighborhood (Simpson 0.60)
- Race & ethnicity
- Black 57% White 23% Hispanic / Latino 11% Two or more races 6% Asian 4%
- Hispanic origin (detail)
- Mexican 5% Puerto Rican 2%
- Common ancestry
- Slovak 1% Serbian 1% Italian 1%
- Foreign-born
- 10% · Canada, South Korea
- Languages at home
- 86% English-only · Spanish 8% Other Indo-European 2% Korean 1%
Political lean MEDSL · Richland
- 2024 margin
- Solid D (+34.6) · D 66.4% · R 31.8% · Other 1.8%
- 2008→2024 swing
- +5.7pp toward D · 2008: 28.9pp · 2024: 34.6pp
- All cycles
- 2024: D+34.6 2020: D+38.3 2016: D+32.9 2012: D+33.3 2008: D+28.9
Not yet ingested
- Civics
- —
Market trends
- HPI YoY
- ▼ -135.96%
- Current HPI
- 195.3158
- Rent YoY
- ▲ 0.21%
- Metro
- Columbia, SC
- State GDP YoY
- ▲ 4.51%
- F500 in state
- 2
Industry mix (Fortune 500 HQ in SC)
| Industry | F500 HQs | Revenue |
|---|---|---|
| Packaging | 1 | $7B |
|
||
Price history
-2.2% since first listed3 events — show timeline
- 2026-04-24 Pending — Consolidated MLS
- 2026-04-21 Price Changed $219,900 Consolidated MLS
- 2026-04-01 Listed $224,900 Consolidated MLS
Property tax history
+29.9%/yrLatest (2025): $1,599 · +2.8% YoY. Source: county tax records.
Cash-flow waterfall
monthlySold comps — $/sqft
last 12 mo · ≤1 miLoading sold comps…