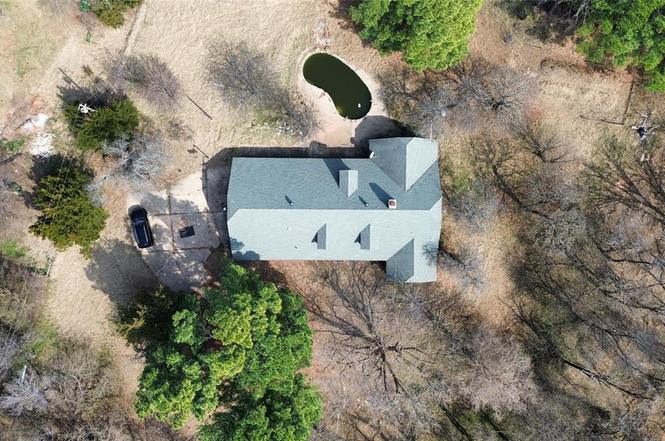
6704 Hidden Hills Dr · Edmond, OK
Flood risk 1/10 · Minimal
- FEMA flood zone
- X (unshaded)
- Chance of flooding over 30 yrs
- 0.0%
- Est. flood insurance / yr
- $507 – $1,088
Fire risk 5/10 · Moderate
- Est. fire insurance / yr
- $2,463 – $4,575
Heat risk 5/10 · Moderate
- Hot days now (above 109°F)
- 7 days/yr
- Hot days in 30 yrs
- 18 days/yr
Wind risk 2/10 · Minimal
- Chance of severe wind over 30 yrs
- 2.0%
Air-quality risk 2/10 · Minimal
- Unhealthy air days now
- 2 days/yr
- Unhealthy air days in 30 yrs
- 2 days/yr
Risk factors via First Street. Map © Google.
Why this score? — see what drove the C- grade
The composite is a weighted blend of 9 inputs, each scored 0–100. Each bar is that input's sub-score; the figure is the points it added to the 100-point composite (weight × sub-score).
- ARV discount +15.0/15.0
- Cash flow +14.3/30.0
- DSCR +4.4/10.0
- 1% rule +4.0/10.0
- Livability +3.9/5.0
- Schools +3.6/10.0
- Rent growth +3.1/5.0
- Condition / age +2.5/5.0
- Appreciation +0.0/10.0
$320,000
🖨 Deal sheet (PDF) 📄 Offer letter ✓ Due diligence
Listing remarks
* * Back on market at no fault of seller after buyer elected not to proceed. Offers received and seller is reviewing. * * Great opportunity for investors, flippers, or buyers looking to renovate and create their own custom home. Located in the desirable Hidden Hills addition of Edmond, this property sits on 2.35 wooded acres, offering privacy, space, and strong upside potential. The home features a large layout ready for updates and redesign, making it an ideal project for a full remodel or value-add renovation. The main level offers open concept living, dining, and kitchen spaces, along with three bedrooms downstairs including a primary suite with en suite bathroom. Upstairs you'll fi
Key facts
- Wooded acres
- Large covered patio
- Backyard shed
Tags
Property features AI
Finance
- Other: Homestead exempt; Located in Hidden Hills addition
- Financial info: Not assumable
- HOA & community: No mandatory association dues
Exterior
- Parking: 2-car garage
- Security: No storm shelter
- Utilities: No specific utility details provided
- Home design: Single family residence; Residential property; Two levels; West-facing
- Construction: Frame and stone construction; Composition roof; Slab foundation; Built existing (no new construction year provided)
- Exterior features: Greenbelt; Interior lot; Rural setting; Wooded lot; Chain link fencing; Private outdoor pool
Interior
- Kitchen: No appliance details provided
- Bedrooms: 4 bedrooms
- Flooring: No flooring details provided
- Bathrooms: 2 full bathrooms; 1 half bathroom
- Heating & cooling: No heating or cooling details provided
- Interior features: Two living areas; Dining area; Wood-burning fireplace; Covered porch; Patio (covered); Porch; Outbuildings; Rain gutters
- Laundry & utility: No laundry details provided
Neighborhood map
What this means for you Summary
Snapshot
- This is a 4-bed/3.0-bath single-family listed at $320k.
Deal economics
- At list price, monthly cash flow is $59 ($706/yr) — positive.
- The deal already cash-flows at list — no discount required.
- To meet the 1% rule (rent ≥ 1% of price), the offer needs to be $288k (10.0% below list).
- Recommended offer: $288k (10.0% below list) — sets the bar for 1% rule.
- Cap rate 6.5% vs local median 3.4% in Edmond — top-decile yield for the area; either an underpriced asset or a hidden risk that comps aren't pricing in. Stress-test before assuming the spread holds.
Location & tenants
- Location reads 78/100 on livability (#6 in OK, #2,383 nationally) — a middle-class / working-renter tenant base. Strengths: employment A+, housing A+, crime A-; Watch: health & safety C-, commute F.
- Edmond (suburban): math 38% / reading 40% proficiency, ranked #11 of 270 in OK (top 4%) — families likely to look elsewhere, expect single-tenant / working-renter base with shorter leases.
- Zoned schools: Redbud Es (616 students, 0% FRL); Sequoyah Ms (math 40% / reading 34%, grade F, #17 of 345 statewide, top 6%, 1,006 students, 0% FRL); Memorial Hs (math 44% / reading 56%, grade D+, #4 of 447 statewide, top 1%, 2,605 students, 0% FRL) — zoned schools average 0% FRL vs 22% district-wide (22 pts lower); this property's tenant base skews higher-income than the district average.
- Market conditions: Rents rising (+2.5%/yr); 769 active listings in the ZIP; 2 comparable units currently listed for rent nearby; solid renter incomes; 5,365 units permitted in Oklahoma County in 2024 (569 in 5+ unit buildings).
- This rent runs 31% of the median local income ($110k/yr) — at the standard rent-burdened threshold; future hikes will face affordability resistance.
Forward outlook
- Local home prices are declining (-3.0%/yr); year-one equity from $2k of loan paydown is wiped out by about $10k of value loss. Plan a longer hold.
- Oklahoma County population projected at +41% by 2050 — long-run rental-demand tailwind backs the buy-and-hold thesis.
Negotiation context
- It's been on market 56 days — a 3% lower offer ($310k) is reasonable based on typical stale-listing flexibility.
- 3 sale attempts with the ask held roughly flat each time — persistent listings suggest the price (not the market) is what's stuck; bring a comps-based counter.
Risks & watch-outs
- Climate carrying-cost: moderate wildfire risk; extreme-heat days projected 7→18/yr by 2055 (HVAC capex compounding) — expect insurance premiums to compound above CPI over the hold.
Questions for the listing agent
- It's been on market 56 days. Have you received any prior offers? Is the seller open to a 10% concession, seller financing, or rate buy-down credit?
- Built in 1975 — when were the roof, HVAC, electrical panel, plumbing, and water heater last replaced?
- Is there a deadline driving the sale (1031 exchange, divorce, estate, relocation)? That informs how much negotiation room exists.
- Schools are A-rated — typically a magnet for longer-tenancy family renters. What's the average tenant stay here, and is there a school-zone premium baked into asking?
- What's the average days-on-market for RENTAL listings here right now (not sales)? A rising rental-DOM trend means longer vacancies and softer asking-rent achievability than the comps imply.
- What's the recent tenant-quality profile in this submarket — average credit score on applications, eviction rate, late-payment / NSF rate, and stable-employment percentage? A property-management company in the area should have these aggregated.
- How much new for-sale + rental construction is in the pipeline within 1–3 miles? Heavy new supply typically softens prices + rents 12–24 months out; constrained supply supports both.
Investment metrics
- 1% rule
- 0.90% ✗
- Cap rate
- 6.51%
- Cash-on-cash
- 0.79%
- DSCR
- 1.04
- GRM
- 9.3
CMA / ARV
- ARV (on-the-fly)
- $534,280
- Comps found
- 12
Show comp detail 12 sales within ~0.75 mi
| Address | Dist | Beds/Ba | Sqft | Sold | Price | $/sf | Match |
|---|---|---|---|---|---|---|---|
| 6796 Stone Valley Dr | 0.19mi | 4/3.5 | 3,033 (+5%) | 3mo | $522,500 | $172 | 79 |
| 14600 Fontella Ln | 0.37mi | 4/3.0 | 2,845 (-2%) | 3mo | $510,000 | $179 | 78 |
| 14674 Fontella Ln | 0.33mi | 5/3.0 (+1) | 2,641 (-9%) | 1mo | $399,900 | $151 | 65 |
| 2651 Sedonia Ct | 0.47mi | 3/3.0 (-1) | 2,722 (-6%) | 3mo | $526,000 | $193 | 61 |
| 2286 Vellano Ln | 0.53mi | 4/4.5 | 2,997 (+4%) | 4mo | $615,000 | $205 | 60 |
| 6451 Valley Ridge Dr | 0.34mi | 4/3.5 | 3,250 (+12%) | 3mo | $599,900 | $185 | 59 |
| 6471 Stone Hill Dr | 0.59mi | 3/3.5 (-1) | 3,076 (+6%) | 2mo | $675,000 | $219 | 53 |
| 14551 Billy Dr | 0.60mi | 3/2.5 (-1) | 3,051 (+6%) | 4mo | $530,000 | $174 | 52 |
| 2554 Rivanna Way | 0.58mi | 4/3.0 | 3,264 (+13%) | 1mo | $669,000 | $205 | 50 |
| 2473 Vellano Ln | 0.43mi | 4/4.0 | 3,277 (+14%) | 4mo | $567,500 | $173 | 50 |
| 1921 Bella Sera Dr | 0.67mi | 3/3.5 (-1) | 3,284 (+14%) | 2mo | $710,000 | $216 | 37 |
| 14500 Billy Dr | 0.66mi | 3/3.0 (-1) | 2,464 (-15%) | 4mo | $310,000 | $126 | 36 |
Match score weights: distance 35% · size 25% · config 20% · recency 20%. Top-matched comps best support the ARV.
Projected returns pro-forma
-3.0% appreciation · 2.49% rent growth · sell at horizon
- IRR
- -15.6%
- Equity multiple
- 0.45×
- Total profit
- $-49,529
- Equity at exit
- $47,713
- IRR
- -8.0%
- Equity multiple
- 0.51×
- Total profit
- $-44,085
- Equity at exit
- $27,668
Cash invested: $89,600 (down + closing). Projections, not guarantees.
Landlord ↔ Tenant lean methodology
- Overall (STATE)
- 83 Strongly Landlord-Friendly
- State Oklahoma
- 83 Strongly Landlord-Friendly · R+20
- County
- — inherits STATE
- City
- — inherits STATE
ZIP-level market 73034
- Rents YoY
- 2.5%
- Active inventory
- 769
- Price-to-rent
- 9.3×
Monthly cashflow live
- Estimated rent
- $2,879 medium interval (Pro) →
- Mortgage (P&I)
- −$1,678
- Tax from tax record
- −$404 /mo · $4,846/yr
- Insurance
- −$133
- HOA
- −$0
- Vacancy / Maint / Mgmt
- −$605
- Net cashflow
- $59
Break-even live
Sensitivity live
| Price | -10% $240 | -5% $149 | +0% $59 | +5% $-32 | +10% $-122 |
|---|---|---|---|---|---|
| Rent | -10% $-169 | -5% $-55 | +0% $59 | +5% $173 | +10% $286 |
| Rate | -1.0pp $220 | -0.5pp $140 | base $59 | +0.5pp $-24 | +1.0pp $-108 |
UW: 25.0% down · 7.5% · 30yr · 1.5% tax · 5.0% vac · 8.0% maint · 8.0% mgmt
Financing live
Cash to close
- Down payment
- $80,000
- Closing costs
- $9,600
- Reserves months
- —
- Total cash needed
- —
Loan-product check · same deal, 3 products live
Conventional
25% down · 7.5% · 30yr
- Down + closing
- —
- Monthly P&I
- —
- Monthly cashflow
- —
- DSCR
- —
- Eligible?
- —
Personal DTI + credit; lowest rate.
DSCR
20% down · 8.5% · 30yr
- Down + closing
- —
- Monthly P&I
- —
- Monthly cashflow
- —
- DSCR
- —
- Eligible?
- —
No personal income docs; deal must DSCR.
Hard money
10% down · 12.0% · 12mo
- Down + closing
- —
- Monthly P&I
- —
- Monthly cashflow
- —
- DSCR
- —
- Eligible?
- —
Short-term bridge; refi at stabilization.
Rent comps 2 comps
| Address | Beds | Baths | Sqft | Rent | $/sqft | DOM | Units | Dist |
|---|---|---|---|---|---|---|---|---|
| 2082 Vaquero Ct Edmond, OK | 5.0 | 3.5 | 3611 | $4,000 | $1.11 | 4d | 1 | 0.51mi |
| 6029 Covey Run Dr Edmond, OK | 4.0 | 2.0 | 2831 | $2,995 | $1.06 | 12d | 1 | 0.74mi |
Listing history 10 events
-
2026-05-16status Pending
-
2026-05-14status Active
-
2026-04-29status Pending
-
2026-03-04$320,000 Active
-
2025-04-18historical
-
2025-03-24price $424,900
-
2025-03-18$429,900 Active
-
2021-09-20soldstatus $380,000
-
1995-10-31soldstatus $125,000
-
1983-04-01soldstatus $166,000
ⓘ Source: listings_history table (triggers on properties + properties_extension) + one-shot
backfill from property_details.listing_events for pre-trigger history.
Tax reassessment forecast OK · Resets to sale price
- Current annual tax
- $4,846 · $404/mo
- Projected year-2 tax
- $4,846 · $404/mo
- Expected delta
- $0/yr ($0/mo · 0.0%)
ⓘ Screening estimate from a state-policy table — verify with the county assessor before closing.
Climate risk First Street
- Flood 1/10 Low FEMA zone X (unshaded) · 0% chance over 30 yrs
- Wildfire 5/10 Major
- Heat 5/10 Major 7 d/yr ≥109°F today · 18 d/yr by 30 yrs out
- Wind 2/10 Low 2% chance of damaging wind over 30 yrs
- Air quality 2/10 Low 2 unhealthy d/yr today · 2 by 30 yrs out
Nearby sold comps map
Loading sold comps map…
Walkable amenities ~0.75 mi
Loading nearby amenities…
Taxation est. · year 1
- Rental income
- $34,544
- − Mortgage interest
- −$17,925
- − Property taxes
- −$4,846
- − Insurance
- −$1,600
- − Repairs & maintenance
- −$2,764
- − Management
- −$2,764
- − Depreciation
- −$9,309
- Taxable loss
- −$4,663
- Est. tax savings @ 24.0%
- +$1,119
- After-tax cash flow
- $1,825/yr
For passive investors: Depreciation is non-cash, so a rental often shows a tax loss while cash-flowing — sheltering income. Rental losses are passive: they offset passive income freely, and up to $25,000/yr can offset ordinary (W-2) income if you actively participate and your MAGI is under $100k (phasing out to $0 by $150k); unused losses carry forward. On sale, claimed depreciation is recaptured at up to 25%, and gains may owe capital-gains tax (a 1031 exchange can defer both). Figures are a year-1 estimate at your 24.0% rate — not tax advice; consult a CPA.
Schools (NCES district)
- District
- Edmond
- NCES district ID
- 4010590
- Math proficiency
- 38% ▼ -12.00%
- Reading proficiency
- 40% ▼ -12.00%
- Median HH income
- $73,212
- Composite
- 35.88/100
- National rank
- #4814
- State rank
- #11 of 270 in OK
Livability — Edmond
- Score
- 78/100
- State rank
- #6
- US rank
- #2383
Category grades
Schools grade is shown separately in the Schools card above.
Census & demographics
- County
- Oklahoma County · 771,644 people
- City population
- 177,083
- Metro
- Oklahoma City, OK
- Population (ZIP)
- 48,831
- Household income
- $109,700
- Rent vs Own
- Severe rent burden
- 1198.0
Population outlook (Oklahoma County) Hauer SSP2
- Today (2025)
- 911,875 people
- By 2030
- 982,413 · +7.7%
- By 2040
- 1,130,468 · +24.0%
- By 2050
- 1,288,422 · +41.3%
- By 2075
- 1,711,482 · +87.7%
- By 2100
- 2,088,448 · +129.0%
Race, ethnicity, and origin ACS 2023
- Neighborhood character
- Predominantly White (76%)
- Race & ethnicity
- White 76% Two or more races 10% Hispanic / Latino 8% Asian 4% Black 3% Native American 3%
- Hispanic origin (detail)
- Mexican 4%
- Common ancestry
- Italian 4% Slovak 3% Lithuanian 3%
- Foreign-born
- 6% · Canada, China, Vietnam
- Languages at home
- 92% English-only · Spanish 4% Other Indo-European 1% Chinese 1%
Political lean MEDSL · Oklahoma
- 2024 margin
- Toss-up / Even · D 48.0% · R 49.7% · Other 2.3%
- 2008→2024 swing
- +15.1pp toward D · 2008: -16.8pp · 2024: -1.7pp
- All cycles
- 2024: R+1.7 2020: R+1.1 2016: R+10.5 2012: R+16.7 2008: R+16.8
Not yet ingested
- Civics
- —
Market trends
- HPI YoY
- ▼ -164.67%
- Current HPI
- 223.1391
- Rent YoY
- ▲ 2.49%
- Metro
- Oklahoma City, OK
- State GDP YoY
- ▲ 1.55%
- F500 in state
- 6
Industry mix (Fortune 500 HQ in OK)
| Industry | F500 HQs | Revenue |
|---|---|---|
| Energy | 3 | $48B |
|
||
Price history
+92.8% since first listed10 events — show timeline
- 2026-05-16 Pending — MLSOK
- 2026-05-14 Relisted — MLSOK
- 2026-04-29 Pending — MLSOK
- 2026-03-04 Listed $320,000 MLSOK
- 2025-04-18 Listing Removed — MLSOK
- 2025-03-24 Price Changed $424,900 MLSOK
- 2025-03-18 Listed $429,900 MLSOK
- 2021-09-20 Sold (Public Records) $380,000 Public Records
- 1995-10-31 Sold (Public Records) $125,000 Public Records
- 1983-04-01 Sold (Public Records) $166,000 Public Records
Property tax history
+5.6%/yrLatest (2025): $4,846 · +5.1% YoY. Source: county tax records.
Cash-flow waterfall
monthlySold comps — $/sqft
last 12 mo · ≤1 miLoading sold comps…