 Multi-family
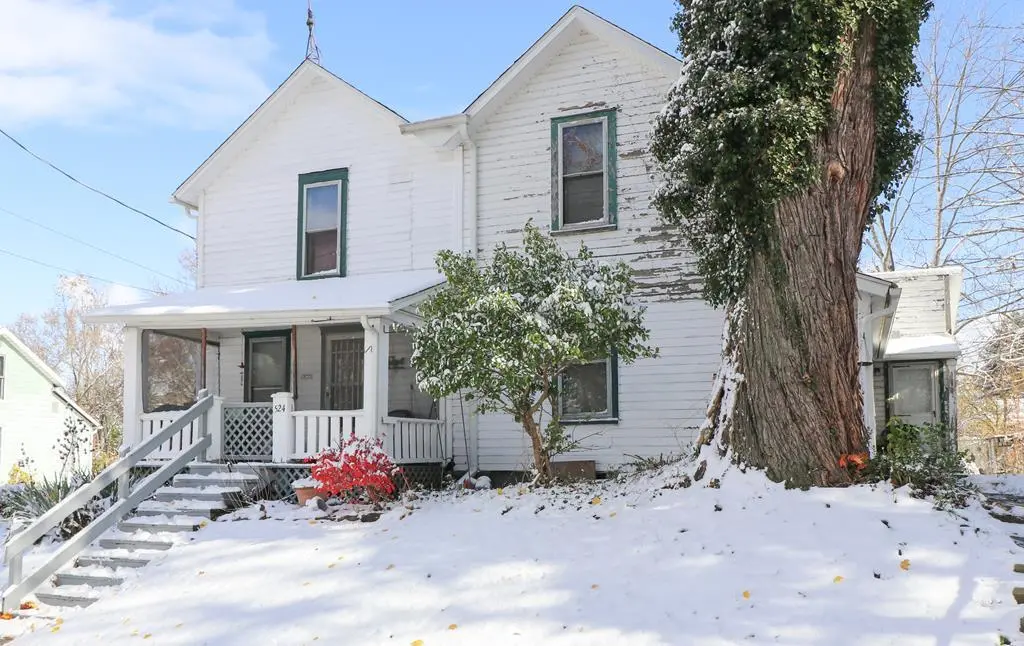
524 Lida St · Mansfield, OH
Flood risk 1/10 · Minimal
- FEMA flood zone
- X (unshaded)
- Chance of flooding over 30 yrs
- 0.0%
- Est. flood insurance / yr
- $473 – $860
Fire risk 1/10 · Minimal
- Est. fire insurance / yr
- $713 – $1,323
Heat risk 3/10 · Minor
- Hot days now (above 96°F)
- 7 days/yr
- Hot days in 30 yrs
- 17 days/yr
Wind risk 2/10 · Minimal
- Chance of severe wind over 30 yrs
- —
Air-quality risk 2/10 · Minimal
- Unhealthy air days now
- 1 days/yr
- Unhealthy air days in 30 yrs
- 1 days/yr
Risk factors via First Street. Map © Google.
Why this score? — see what drove the B+ grade
The composite is a weighted blend of 9 inputs, each scored 0–100. Each bar is that input's sub-score; the figure is the points it added to the 100-point composite (weight × sub-score).
- Cash flow +30.0/30.0
- ARV discount +15.0/15.0
- 1% rule +10.0/10.0
- DSCR +10.0/10.0
- Livability +3.8/5.0
- Rent growth +2.5/5.0
- Condition / age +2.5/5.0
- Schools +2.3/10.0
- Appreciation +0.0/10.0
$87,900
🖨 Deal sheet 📄 Offer letter ✓ Due diligence
Multi-family units
County records classify this as Multi-Family (2-4 Unit). Listing-text estimate: 1 unit. estimate disagrees with records
Listing remarks MLS
This property offers a significant opportunity for generating passive income. The roof has been replaced within the past two years. The first unit features four bedrooms, three upstairs and one downstairs, a spacious living area, dining room, an enclosed porch, and a first-floor bedroom and bathroom. The second unit comprises one bedroom, one bathroom, a well-appointed kitchen, and living room. Its location in a quiet neighborhood, within close proximity to the highway, and downtown, adds considerable value.
Key facts
- Quiet neighborhood
- Roof replaced
- Built 1890
Tags
Neighborhood map
What this means for you Summary
Snapshot
- This is a 4-bed/2.0-bath multifamily listed at $88k.
Deal economics
- At list price, monthly cash flow is $838 ($10k/yr) — positive.
- The deal already cash-flows at list — no discount required.
- Meets the 1% rule at list price ($2k rent vs $88k).
- Recommended offer: $77k (12.0% below list) — sets the bar for market timing.
- Cap rate 17.7% vs local median 4.2% in Mansfield — top-decile yield for the area; either an underpriced asset or a hidden risk that comps aren't pricing in. Stress-test before assuming the spread holds.
Location & tenants
- Location reads 76/100 on livability (#224 in OH, #3,525 nationally) — a middle-class / working-renter tenant base. Strengths: commute A+, cost of living A+, housing A+; Watch: schools C-, crime D-, amenities D-.
- Mansfield City (urban): math 24% / reading 33% proficiency, ranked #590 of 656 in OH (top 90%) — low school quality limits family demand, transient renter base, plan for 1-2y turnover; 80% free/reduced lunch — lower-income household profile, screen leases tightly.
- Market conditions: 122 active listings in the ZIP; 1 comparable units currently listed for rent nearby; 145 units permitted in Richland County in 2024 (0 in 5+ unit buildings).
- This rent runs 32% of the median local income ($65k/yr) — at the standard rent-burdened threshold; future hikes will face affordability resistance.
Forward outlook
- Local home prices are declining (-3.0%/yr); year-one equity from $608 of loan paydown is wiped out by about $3k of value loss. Plan a longer hold.
- Richland County population projected at -18% by 2050 — secular population decline; favor cash flow + early exit over multi-decade hold.
- At projected returns (-3.0% appreciation + 3.0% rent growth), your $25k cash investment doubles in ~3 years — after that, you're playing with house money.
Negotiation context
- It's been on market 217 days — a 12% lower offer ($77k) is reasonable based on typical stale-listing flexibility.
Risks & watch-outs
- Watch-outs: built in 1890 — expect roof / HVAC / electrical / plumbing capex.
Questions for the listing agent
- It's been on market 217 days. Have you received any prior offers? Is the seller open to a 12% concession, seller financing, or rate buy-down credit?
- Built in 1890 — when were the roof, HVAC, electrical panel, plumbing, and water heater last replaced?
- Why hasn't it sold? Are there any deal-killer items the seller is aware of (foundation, flood, title, zoning, code violations)?
- Is there a deadline driving the sale (1031 exchange, divorce, estate, relocation)? That informs how much negotiation room exists.
- Crime grade is D in this area — have there been break-ins, vandalism, or insurance claims at this property in the last 3 years? What carrier currently insures it and at what premium?
- What's the average days-on-market for RENTAL listings here right now (not sales)? A rising rental-DOM trend means longer vacancies and softer asking-rent achievability than the comps imply.
- What's the recent tenant-quality profile in this submarket — average credit score on applications, eviction rate, late-payment / NSF rate, and stable-employment percentage? A property-management company in the area should have these aggregated.
- How much new apartment / multifamily construction is in the pipeline within 1–3 miles? Heavy new supply (>2% of stock underway) typically softens rents 12–24 months out; light construction supports rent growth.
Investment metrics
- 1% rule
- 1.97% ✓
- Cap rate
- 17.73%
- Cash-on-cash
- 40.84%
- DSCR
- 2.82
- GRM
- 4.2
CMA / ARV
- ARV (median comp)
- $111,423
- List price
- $87,900
- Delta
- -21.11%
- Verdict
- UNDERPRICED
- Comps
- 3 within 1.0 mi
Projected returns pro-forma
-3.0% appreciation · 3.0% rent growth · sell at horizon
- IRR
- 37.3%
- Equity multiple
- 2.59×
- Total profit
- $39,088
- Equity at exit
- $13,106
- IRR
- 43.9%
- Equity multiple
- 5.17×
- Total profit
- $102,650
- Equity at exit
- $7,600
Cash invested: $24,612 (down + closing). Projections, not guarantees.
Landlord ↔ Tenant lean methodology
- Overall (STATE)
- 73 Landlord-Friendly
- State Ohio
- 73 Landlord-Friendly · R+6
- County
- — inherits STATE
- City
- — inherits STATE
ZIP-level market 44903
- Home prices YoY
- -27.7%
- Active inventory
- 122
- Price-to-rent
- 8.2×
Monthly cashflow live
- Estimated rent
- $1,731 medium interval (Pro) →
- Mortgage (P&I)
- −$461
- Tax from tax record
- −$32 /mo · $387/yr
- Insurance
- −$37
- HOA
- −$0
- Vacancy / Maint / Mgmt
- −$364
- Net cashflow
- $838
Break-even live
2-unit breakdown (identical units grouped — click to expand)
| Units | Beds | Baths | Est. rent |
|---|---|---|---|
| 1× unit | 4 | 1 | $895 |
| 1× unit | 1 | 1 | $835 |
| Total (2 units) | $1,731 | ||
UW: 25.0% down · 7.5% · 30yr · 1.5% tax · 5.0% vac · 8.0% maint · 8.0% mgmt
Financing live
Cash to close
- Down payment
- $21,975
- Closing costs
- $2,637
- Reserves months
- —
- Total cash needed
- —
Loan-product check · same deal, 3 products live
Conventional
25% down · 7.5% · 30yr
- Down + closing
- —
- Monthly P&I
- —
- Monthly cashflow
- —
- DSCR
- —
- Eligible?
- —
Personal DTI + credit; lowest rate.
DSCR
20% down · 8.5% · 30yr
- Down + closing
- —
- Monthly P&I
- —
- Monthly cashflow
- —
- DSCR
- —
- Eligible?
- —
No personal income docs; deal must DSCR.
Hard money
10% down · 12.0% · 12mo
- Down + closing
- —
- Monthly P&I
- —
- Monthly cashflow
- —
- DSCR
- —
- Eligible?
- —
Short-term bridge; refi at stabilization.
Rent comps 1 comps
| Address | Beds | Baths | Sqft | Rent | $/sqft | DOM | Units | Dist |
|---|---|---|---|---|---|---|---|---|
| 243 W 1st St Mansfield, OH | 4.0 | 1.0 | 1470 | $1,195 | $0.81 | 43d | 1 | 1.18mi |
Listing history 16 events
-
2026-06-18days on market $87,900 Active 217 DOM
-
2026-06-17days on market $87,900 Active 216 DOM
-
2026-06-16days on market $87,900 Active 215 DOM
-
2026-06-15days on market $87,900 Active 214 DOM
-
2026-06-14days on market $87,900 Active 212 DOM
-
2026-06-12days on market $87,900 Active 211 DOM
-
2026-06-09days on market $87,900 Active 208 DOM
-
2026-06-08days on market $87,900 Active 207 DOM
-
2026-06-07days on market $87,900 Active 206 DOM
-
2026-06-05days on market $87,900 Active 203 DOM
-
2026-06-03days on market $87,900 Active 202 DOM
-
2026-06-02days on market $87,900 Active 201 DOM
-
2026-06-01days on market $87,900 Active 200 DOM
-
2026-05-31days on market $87,900 Active 199 DOM
-
2026-05-30days on market $87,900 Active 198 DOM
-
2025-11-13$87,900 Active 513-char remark
Show marketing remark (513 chars)
This property offers a significant opportunity for generating passive income. The roof has been replaced within the past two years. The first unit features four bedrooms, three upstairs and one downstairs, a spacious living area, dining room, an enclosed porch, and a first-floor bedroom and bathroom. The second unit comprises one bedroom, one bathroom, a well-appointed kitchen, and living room. Its location in a quiet neighborhood, within close proximity to the highway, and downtown, adds considerable value.
ⓘ Source: listings_history table (triggers on properties + properties_extension) + one-shot
backfill from property_details.listing_events for pre-trigger history.
Tax reassessment forecast OH · Partial reset (capped growth)
- Current annual tax
- $387 · $32/mo
- Projected year-2 tax
- $879 · $73/mo
- Expected delta
- +$492/yr (+$41/mo · 127.3%)
ⓘ Screening estimate from a state-policy table — verify with the county assessor before closing.
Climate risk First Street
- Flood 1/10 Low FEMA zone X (unshaded) · 0% chance over 30 yrs
- Wildfire 1/10 Low
- Heat 3/10 Moderate 7 d/yr ≥96°F today · 17 d/yr by 30 yrs out
- Wind 2/10 Low
- Air quality 2/10 Low 1 unhealthy d/yr today · 1 by 30 yrs out
Nearby sold comps map
Loading sold comps map…
Walkable amenities ~0.75 mi
Loading nearby amenities…
Taxation est. · year 1
- Rental income
- $20,772
- − Mortgage interest
- −$4,924
- − Property taxes
- −$387
- − Insurance
- −$440
- − Repairs & maintenance
- −$1,662
- − Management
- −$1,662
- − Depreciation
- −$2,557
- Taxable income
- $9,142
- Est. tax owed @ 24.0%
- −$2,194
- After-tax cash flow
- $7,858/yr
For passive investors: Depreciation is non-cash, so a rental often shows a tax loss while cash-flowing — sheltering income. Rental losses are passive: they offset passive income freely, and up to $25,000/yr can offset ordinary (W-2) income if you actively participate and your MAGI is under $100k (phasing out to $0 by $150k); unused losses carry forward. On sale, claimed depreciation is recaptured at up to 25%, and gains may owe capital-gains tax (a 1031 exchange can defer both). Figures are a year-1 estimate at your 24.0% rate — not tax advice; consult a CPA.
Schools (NCES district)
- District
- Mansfield City
- NCES district ID
- 3904429
- Math proficiency
- 24% ▼ -19.00%
- Reading proficiency
- 33% ▼ -12.00%
- Median HH income
- $32,435
- Composite
- 23.25/100
- National rank
- #7934
- State rank
- #590 of 656 in OH
Livability — Mansfield
- Score
- 76/100
- State rank
- #224
- US rank
- #3525
Category grades
Schools grade is shown separately in the Schools card above.
Census & demographics
- Census place
- Mansfield, OH
- County
- Richland · 128,966 people
- City population
- 16,349
- Metro
- Mansfield, OH
- Population (ZIP)
- 26,804
- Household income
- $65,421
- Rent vs Own
- Severe rent burden
- 9.5
Population outlook (Richland County) Hauer SSP2
- Today (2025)
- 115,577 people
- By 2030
- 111,669 · -3.4%
- By 2040
- 103,323 · -10.6%
- By 2050
- 95,135 · -17.7%
- By 2075
- 76,719 · -33.6%
- By 2100
- 57,188 · -50.5%
Race, ethnicity, and origin ACS 2023
- Neighborhood character
- Predominantly White (80%)
- Race & ethnicity
- White 80% Two or more races 9% Black 9% Hispanic / Latino 2% Asian 1%
- Common ancestry
- Slovak 2% Iranian 1% Romanian 1%
- Foreign-born
- 1%
- Languages at home
- 97% English-only · Spanish 1% Other Indo-European 1%
Political lean MEDSL · Richland
- 2024 margin
- Solid R (+42.3) · D 28.4% · R 70.8%
- 2008→2024 swing
- -28.8pp toward R · 2008: -13.6pp · 2024: -42.3pp
- All cycles
- 2024: R+42.3 2020: R+39.7 2016: R+37.5 2012: R+20.1 2008: R+13.6
Not yet ingested
- Civics
- —
Market trends
- HPI YoY
- ▼ -92.50%
- Current HPI
- 241.9342
- Rent YoY
- —
- Metro
- —
- State GDP YoY
- ▲ 1.98%
- F500 in state
- 48
Industry mix (Fortune 500 HQ in OH)
| Industry | F500 HQs | Revenue |
|---|---|---|
| Insurance | 3 | $145B |
|
||
| Industrial Machinery | 3 | $49B |
|
||
| Financial Services | 3 | $24B |
|
||
| Consumer Goods | 2 | $93B |
|
||
| Aerospace / Defense | 2 | $47B |
|
||
| Utilities | 2 | $33B |
|
||
Price history
1 event — show timeline
- 2025-11-13 Listed $87,900 MARMLS
Property tax history
-7.2%/yrLatest (2025): $387 · -8.6% YoY. Source: county tax records.
Cash-flow waterfall
monthlySold comps — $/sqft
last 12 mo · ≤1 miLoading sold comps…