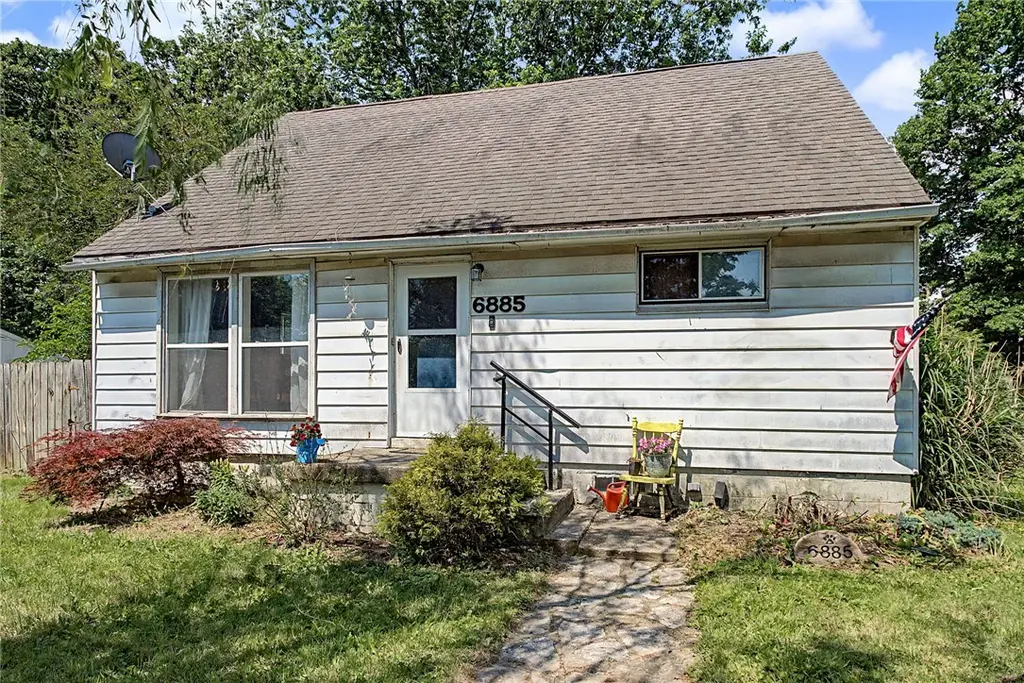
6885 Keats Dr · Vandalia, OH
Flood risk 1/10 · Minimal
- FEMA flood zone
- X (unshaded)
- Chance of flooding over 30 yrs
- 0.0%
- Est. flood insurance / yr
- $473 – $860
Fire risk 1/10 · Minimal
- Est. fire insurance / yr
- $713 – $1,323
Heat risk 3/10 · Minor
- Hot days now (above 103°F)
- 7 days/yr
- Hot days in 30 yrs
- 18 days/yr
Wind risk 2/10 · Minimal
- Chance of severe wind over 30 yrs
- —
Air-quality risk 3/10 · Minor
- Unhealthy air days now
- 2 days/yr
- Unhealthy air days in 30 yrs
- 4 days/yr
Risk factors via First Street. Map © Google.
Why this score? — see what drove the B- grade
The composite is a weighted blend of 9 inputs, each scored 0–100. Each bar is that input's sub-score; the figure is the points it added to the 100-point composite (weight × sub-score).
- Cash flow +26.1/30.0
- ARV discount +9.4/15.0
- DSCR +8.8/10.0
- 1% rule +7.1/10.0
- Schools +5.0/10.0
- Rent growth +4.4/5.0
- Livability +3.5/5.0
- Condition / age +2.5/5.0
- Appreciation +0.0/10.0
$137,000
🖨 Deal sheet 📄 Offer letter ✓ Due diligence
Listing remarks
Discover an exceptional opportunity for comfortable living in this charming Harrison Township residence. This delightful 3-bedroom, 1.5-bathroom home is move-in ready, presenting an ideal canvas for personal touches and future enhancements. The property offers the added convenience of a detached 2-car garage, providing ample space for vehicles, storage, or pursuing hobbies. A generous backyard creates a private outdoor sanctuary, perfect for relaxation or entertaining. Situated in a prime location, this home ensures easy access to a variety of shopping, dining, and schools, enriching everyday life. It stands as a perfect entry point for first-time homebuyers embarking on their homeownership
Key facts
- Prime location
- Generous backyard
- 8,891 sq ft lot
Tags
Property features AI
Finance
- Financial info: Offered for sale
Exterior
- Parking: Attached garage with space for two cars
- Utilities: Natural gas; Central air conditioning
- Home design: Vinyl siding exterior
- Construction: Vinyl siding construction
- Exterior features: Residential lot
Interior
- Kitchen: Kitchen on the main level
- Bedrooms: Two bedrooms on the second level; Two bedrooms on the main level; Total of 4 bedrooms
- Bathrooms: One full bathroom; One half bathroom; At least one bathroom on the main level
- Heating & cooling: Natural gas heating; Central air conditioning
- Interior features: Full basement
Neighborhood map
What this means for you Summary
Snapshot
- This is a 3-bed/1.5-bath single-family listed at $137k.
Deal economics
- At list price, monthly cash flow is $345 ($4k/yr) — positive.
- The deal already cash-flows at list — no discount required.
- Meets the 1% rule at list price ($2k rent vs $137k).
- Cap rate 9.3% vs local median 2.9% in Vandalia — top-decile yield for the area; either an underpriced asset or a hidden risk that comps aren't pricing in. Stress-test before assuming the spread holds.
Location & tenants
- Location reads 70/100 on livability (#463 in OH) — a middle-class / working-renter tenant base. Strengths: cost of living A+, housing A+, schools B+; Watch: amenities F, commute F, health & safety F.
- Market conditions: Rents rising fast (+7.4%/yr); 51 active listings in the ZIP; 9 comparable units currently listed for rent nearby; rentals at typical pace (median 15d on market — plan ~3-4 weeks tenant-placement turnaround); 907 units permitted in Montgomery County in 2024 (416 in 5+ unit buildings).
- This rent runs 36% of the median local income ($54k/yr) — at the standard rent-burdened threshold; future hikes will face affordability resistance.
Forward outlook
- Local home prices are declining (-3.0%/yr); year-one equity from $947 of loan paydown is wiped out by about $4k of value loss. Plan a longer hold.
- Montgomery County population projected at -10% by 2050 — secular population decline; favor cash flow + early exit over multi-decade hold.
- At projected returns (-3.0% appreciation + 7.4% rent growth), your $38k cash investment doubles in ~8 years — after that, you're playing with house money.
Negotiation context
- Only 13 days on market — expect competitive offers; lowballing is unlikely to land.
- 3 sale attempts since 7y ago; this cycle's ask has dropped $8k (6%) from the opening price — seller is motivated, your offer sets the floor, not the list.
- Current owner paid $65k; list at $137k implies a 111% gain — meaningful room to come down on a strong offer.
Risks & watch-outs
- Watch-outs: built in 1959 — expect roof / HVAC / electrical / plumbing capex.
Questions for the listing agent
- Built in 1959 — when were the roof, HVAC, electrical panel, plumbing, and water heater last replaced?
- Is there a deadline driving the sale (1031 exchange, divorce, estate, relocation)? That informs how much negotiation room exists.
- Schools are B-rated — typically a magnet for longer-tenancy family renters. What's the average tenant stay here, and is there a school-zone premium baked into asking?
- What's the average days-on-market for RENTAL listings here right now (not sales)? A rising rental-DOM trend means longer vacancies and softer asking-rent achievability than the comps imply.
- What's the recent tenant-quality profile in this submarket — average credit score on applications, eviction rate, late-payment / NSF rate, and stable-employment percentage? A property-management company in the area should have these aggregated.
- How much new for-sale + rental construction is in the pipeline within 1–3 miles? Heavy new supply typically softens prices + rents 12–24 months out; constrained supply supports both.
Investment metrics
- 1% rule
- 1.21% ✓
- Cap rate
- 9.31%
- Cash-on-cash
- 10.78%
- DSCR
- 1.48
- GRM
- 6.9
CMA / ARV
- ARV (on-the-fly)
- $142,956
- Comps found
- 12
Show comp detail 12 sales within ~0.75 mi
| Address | Dist | Beds/Ba | Sqft | Sold | Price | $/sf | Match |
|---|---|---|---|---|---|---|---|
| 2330 Arthur Ave | 0.11mi | 3/1.0 | 1,252 (-0%) | 9mo | $160,000 | $128 | 85 |
| 6732 Pyramid Ave | 0.08mi | 3/1.0 | 1,170 (-7%) | 11mo | $64,000 | $55 | 74 |
| 2024 Kildare Ave | 0.36mi | 3/2.0 | 1,298 (+4%) | 7mo | $170,000 | $131 | 69 |
| 6865 Keats Dr | 0.03mi | 2/1.0 (-1) | 1,080 (-14%) | 4mo | $123,000 | $114 | 65 |
| 2632 Ashcraft Rd | 0.60mi | 3/1.5 | 1,329 (+6%) | 3mo | $350,000 | $263 | 60 |
| 2021 Cardinal Ave | 0.56mi | 2/1.0 (-1) | 1,238 (-1%) | 8mo | $128,000 | $103 | 58 |
| 2159 Gipsy Dr | 0.44mi | 3/1.0 | 1,135 (-10%) | 6mo | $125,000 | $110 | 57 |
| 2217 Harding Ave | 0.26mi | 3/1.0 | 1,080 (-14%) | 7mo | $55,000 | $51 | 57 |
| 2035 Cadie Ave | 0.40mi | 2/1.5 (-1) | 1,341 (+7%) | 11mo | $142,000 | $106 | 55 |
| 2010 Gipsy Dr | 0.55mi | 3/1.0 | 1,373 (+10%) | 6mo | $122,499 | $89 | 52 |
| 5710 Durand St | 0.69mi | 3/1.5 | 1,350 (+8%) | 9mo | $190,000 | $141 | 47 |
| 5741 Lily Ln | 0.56mi | 3/1.5 | 1,073 (-14%) | 6mo | $180,000 | $168 | 45 |
Match score weights: distance 35% · size 25% · config 20% · recency 20%. Top-matched comps best support the ARV.
Projected returns pro-forma
-3.0% appreciation · 7.41% rent growth · sell at horizon
- IRR
- 4.8%
- Equity multiple
- 1.19×
- Total profit
- $7,440
- Equity at exit
- $20,427
- IRR
- 18.0%
- Equity multiple
- 2.81×
- Total profit
- $69,290
- Equity at exit
- $11,845
Cash invested: $38,360 (down + closing). Projections, not guarantees.
Landlord ↔ Tenant lean methodology
- Overall (STATE)
- 73 Landlord-Friendly
- State Ohio
- 73 Landlord-Friendly · R+6
- County
- — inherits STATE
- City
- — inherits STATE
ZIP-level market 45414
- Rents YoY
- 7.4%
- Active inventory
- 51
- Price-to-rent
- 6.9×
Monthly cashflow live
- Estimated rent
- $1,652 high interval (Pro) →
- Mortgage (P&I)
- −$718
- Tax from tax record
- −$185 /mo · $2,218/yr
- Insurance
- −$57
- HOA
- −$0
- Vacancy / Maint / Mgmt
- −$347
- Net cashflow
- $345
Break-even live
UW: 25.0% down · 7.5% · 30yr · 1.5% tax · 5.0% vac · 8.0% maint · 8.0% mgmt
Financing live
Cash to close
- Down payment
- $34,250
- Closing costs
- $4,110
- Reserves months
- —
- Total cash needed
- —
Loan-product check · same deal, 3 products live
Conventional
25% down · 7.5% · 30yr
- Down + closing
- —
- Monthly P&I
- —
- Monthly cashflow
- —
- DSCR
- —
- Eligible?
- —
Personal DTI + credit; lowest rate.
DSCR
20% down · 8.5% · 30yr
- Down + closing
- —
- Monthly P&I
- —
- Monthly cashflow
- —
- DSCR
- —
- Eligible?
- —
No personal income docs; deal must DSCR.
Hard money
10% down · 12.0% · 12mo
- Down + closing
- —
- Monthly P&I
- —
- Monthly cashflow
- —
- DSCR
- —
- Eligible?
- —
Short-term bridge; refi at stabilization.
Rent comps 9 comps
| Address | Beds | Baths | Sqft | Rent | $/sqft | DOM | Units | Dist |
|---|---|---|---|---|---|---|---|---|
| 2022 Arthur Ave Unit NA Dayton, OH | 3.0 | 1.0 | 1040 | $1,500 | $1.44 | 11d | 1 | 0.38mi |
| 6418 Oakhurst Pl Dayton, OH | 3.0 | 2.0 | 1865 | $1,995 | $1.07 | 44d | 1 | 1.19mi |
| 3155 Silver Rock Ave Unit 3157 Dayton, OH | 2.0 | 1.5 | 1200 | $1,500 | $1.25 | 2d | 1 | 1.20mi |
| 3136 Silver Rock Ave Unit 3138 Dayton, OH | 2.0 | 1.5 | 1274 | $1,395 | $1.09 | 19d | 1 | 1.22mi |
| 2991 Benchwood Rd Unit 2993 Dayton, OH | 2.0 | 1.5 | 1063 | $1,295 | $1.22 | 2d | 1 | 1.24mi |
| 3006 Benchwood Rd Unit 1 Dayton, OH | 2.0 | 1.5 | 1250 | $1,275 | $1.02 | 23d | 1 | 1.25mi |
| 3097 Silver Rock Ave Unit 3103 Dayton, OH | 2.0 | 1.5 | 1035 | $1,295 | $1.25 | 14d | 1 | 1.30mi |
| 3161 Autumn Ridge Ct Unit 3163 Dayton, OH | 2.0 | 1.5 | 1507 | $1,395 | $0.93 | 21d | 1 | 1.43mi |
| 5208 Brookmill Ct Dayton, OH | 3.0 | 2.0 | 1800 | $2,000 | $1.11 | 2d | 1 | 1.50mi |
Listing history 11 events
-
2026-06-18days on market $137,000 Active 13 DOM
-
2026-06-17days on market $137,000 Active 12 DOM
-
2026-06-16days on market $137,000 Active 11 DOM
-
2026-06-15days on market $137,000 Active 10 DOM
-
2026-06-14days on market $137,000 Active 8 DOM
-
2026-06-13pricedays on market $137,000 Active 7 DOM
-
2026-06-10days on market $145,000 Active 5 DOM
-
2026-06-09days on market $145,000 Active 4 DOM
-
2026-06-08days on market $145,000 Active 3 DOM
-
2026-06-07remarks 699-char remark
-
2026-06-07$145,000 Active 2 DOM
ⓘ Source: listings_history table (triggers on properties + properties_extension) + one-shot
backfill from property_details.listing_events for pre-trigger history.
Tax reassessment forecast OH · Partial reset (capped growth)
- Current annual tax
- $2,218 · $185/mo
- Projected year-2 tax
- $2,218 · $185/mo
- Expected delta
- $0/yr ($0/mo · 0.0%)
ⓘ Screening estimate from a state-policy table — verify with the county assessor before closing.
Climate risk First Street
- Flood 1/10 Low FEMA zone X (unshaded) · 0% chance over 30 yrs
- Wildfire 1/10 Low
- Heat 3/10 Moderate 7 d/yr ≥103°F today · 18 d/yr by 30 yrs out
- Wind 2/10 Low
- Air quality 3/10 Moderate 2 unhealthy d/yr today · 4 by 30 yrs out
Nearby sold comps map
Loading sold comps map…
Walkable amenities ~0.75 mi
Loading nearby amenities…
Taxation est. · year 1
- Rental income
- $19,823
- − Mortgage interest
- −$7,674
- − Property taxes
- −$2,218
- − Insurance
- −$685
- − Repairs & maintenance
- −$1,586
- − Management
- −$1,586
- − Depreciation
- −$3,985
- Taxable income
- $2,089
- Est. tax owed @ 24.0%
- −$501
- After-tax cash flow
- $3,635/yr
For passive investors: Depreciation is non-cash, so a rental often shows a tax loss while cash-flowing — sheltering income. Rental losses are passive: they offset passive income freely, and up to $25,000/yr can offset ordinary (W-2) income if you actively participate and your MAGI is under $100k (phasing out to $0 by $150k); unused losses carry forward. On sale, claimed depreciation is recaptured at up to 25%, and gains may owe capital-gains tax (a 1031 exchange can defer both). Figures are a year-1 estimate at your 24.0% rate — not tax advice; consult a CPA.
Schools (NCES district)
No district data.
Livability — Vandalia
- Score
- 70/100
- State rank
- #463
- US rank
- #7669
Category grades
Schools grade is shown separately in the Schools card above.
Census & demographics
- County
- Montgomery County · 459,541 people
- City population
- 14,888
- Metro
- Dayton-Kettering, OH
- Population (ZIP)
- 21,167
- Household income
- $54,485
- Rent vs Own
- Severe rent burden
- 801.0
Population outlook (Montgomery County) Hauer SSP2
- Today (2025)
- 523,241 people
- By 2030
- 514,948 · -1.6%
- By 2040
- 493,378 · -5.7%
- By 2050
- 469,639 · -10.2%
- By 2075
- 418,360 · -20.0%
- By 2100
- 353,315 · -32.5%
Race, ethnicity, and origin ACS 2023
- Neighborhood character
- Predominantly White (75%)
- Race & ethnicity
- White 75% Black 15% Two or more races 6% Hispanic / Latino 4% Asian 1%
- Common ancestry
- Slovak 2% Romanian 2% Italian 2%
- Foreign-born
- 4% · Canada
- Languages at home
- 94% English-only · Spanish 2% Arabic 1% Tagalog/Filipino 1%
Political lean MEDSL · Montgomery
- 2024 margin
- Toss-up / Even · D 49.8% · R 49.3%
- 2008→2024 swing
- -5.8pp toward R · 2008: 6.2pp · 2024: 0.5pp
- All cycles
- 2024: D+0.5 2020: D+2.2 2016: R+1.2 2012: D+3.1 2008: D+6.2
Not yet ingested
- Civics
- —
Market trends
- HPI YoY
- ▼ -142.46%
- Current HPI
- 183.1124
- Rent YoY
- ▲ 7.41%
- Metro
- Dayton-Kettering, OH
- State GDP YoY
- ▲ 1.98%
- F500 in state
- 48
Industry mix (Fortune 500 HQ in OH)
| Industry | F500 HQs | Revenue |
|---|---|---|
| Insurance | 3 | $145B |
|
||
| Industrial Machinery | 3 | $49B |
|
||
| Financial Services | 3 | $24B |
|
||
| Consumer Goods | 2 | $93B |
|
||
| Aerospace / Defense | 2 | $47B |
|
||
| Utilities | 2 | $33B |
|
||
Price history
+326.9% since first listed7 events — show timeline
- 2026-06-05 Listed $145,000 Dayton MLS
- 2021-06-29 Sold (Public Records) $65,000 Public Records
- 2019-02-26 Listing Removed — Dayton MLS
- 2019-02-26 Listing Removed — Cincy MLS
- 2019-02-22 Listed $70,000 Dayton MLS
- 2019-02-22 Listed $70,000 Cincy MLS
- 1982-06-28 Sold (Public Records) $33,968 Public Records
Property tax history
+3.6%/yrLatest (2025): $2,218 · -2.3% YoY. Source: county tax records.
Cash-flow waterfall
monthlySold comps — $/sqft
last 12 mo · ≤1 miLoading sold comps…