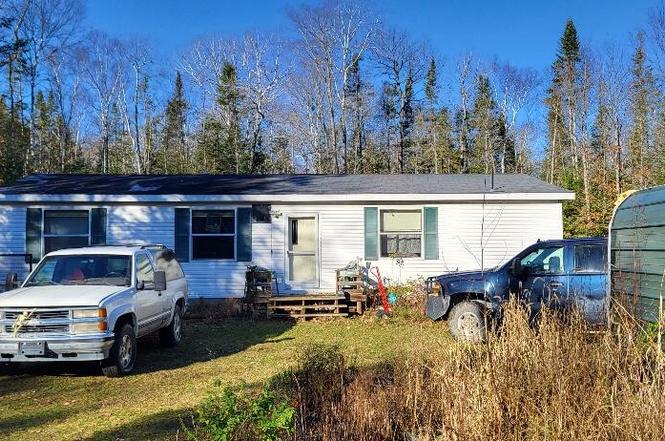
1848 Kimball Dr · Bois Blanc, MI
Flood risk 1/10 · Minimal
- FEMA flood zone
- X (unshaded)
- Chance of flooding over 30 yrs
- 0.0%
- Est. flood insurance / yr
- $473 – $860
Fire risk 3/10 · Minor
- Est. fire insurance / yr
- $784 – $1,456
Heat risk 1/10 · Minimal
- Hot days now (above 89°F)
- 7 days/yr
- Hot days in 30 yrs
- 14 days/yr
Wind risk 1/10 · Minimal
- Chance of severe wind over 30 yrs
- —
Air-quality risk 1/10 · Minimal
- Unhealthy air days now
- 0 days/yr
- Unhealthy air days in 30 yrs
- 0 days/yr
Risk factors via First Street. Map © Google.
Why this score? — see what drove the C grade
The composite is a weighted blend of 9 inputs, each scored 0–100. Each bar is that input's sub-score; the figure is the points it added to the 100-point composite (weight × sub-score).
- Cash flow +20.0/30.0
- ARV discount +7.5/15.0
- DSCR +6.4/10.0
- Appreciation +5.0/10.0
- Schools +5.0/10.0
- 1% rule +4.5/10.0
- Rent growth +2.5/5.0
- Livability +2.5/5.0
- Condition / age +2.5/5.0
$135,000
🖨 Deal sheet (PDF) 📄 Offer letter ✓ Due diligence
Listing remarks MLS
Three nicely elevated and wooded parcels each measuring in excess of 1 acre each. All lots have frontage on East Huron Drive. power is at road. Lots are listed for $17,500 each or all three can be purchased together for $50,000.
Key facts
- Private road
- Bois blanc island
- Wooded acres
Tags
Property features AI
Finance
- Other: Property sits on approximately 3 acres; Zoned residential
Exterior
- Security: Smoke detector(s)
- Utilities: Septic tank
- Home design: Residential single-family modular home; One-story (above grade finished area approx. 1,200)
- Construction: Vinyl siding; Asphalt construction material
- Exterior features: Asphalt roof
Interior
- Bathrooms: 2 full bathrooms
- Heating & cooling: Forced air heating (propane); Ceiling fan(s); Has cooling
- Interior features: Crawl space basement; Smoke detectors installed
- Laundry & utility: Laundry on the main level
Neighborhood map
What this means for you Summary
Snapshot
- This is a 3-bed/2.0-bath single-family listed at $135k.
Deal economics
- At list price, monthly cash flow is $167 ($2k/yr) — positive.
- The deal already cash-flows at list — no discount required.
- To meet the 1% rule (rent ≥ 1% of price), the offer needs to be $128k (5.2% below list).
- Recommended offer: $128k (5.2% below list) — sets the bar for 1% rule.
Location & tenants
- Location reads: area grade C — affects rentability + tenant quality, not the cash-flow math above.
- Market conditions: 27 active listings in the ZIP; 41 units permitted in Mackinac County in 2024 (0 in 5+ unit buildings).
Forward outlook
- In year one you build about $5k of equity ($933 loan paydown + $4k appreciation (3.0% local appreciation)).
- Mackinac County population projected at -18% by 2050 — secular population decline; favor cash flow + early exit over multi-decade hold.
- At projected returns (3.0% appreciation + 3.0% rent growth), your $38k cash investment doubles in ~5 years — after that, you're playing with house money.
- By year 7, paydown + projected appreciation supports a ~$32k cash-out refi (75% LTV) — recoverable capital for the next deal without selling this one.
Negotiation context
- It's been on market 52 days — a 3% lower offer ($131k) is reasonable based on typical stale-listing flexibility.
- 5 sale attempts since 8y ago; this cycle's ask has dropped $14k (9%) from the opening price — seller is motivated, your offer sets the floor, not the list.
- Current owner paid $43k; list at $135k implies a 214% gain — meaningful room to come down on a strong offer.
Questions for the listing agent
- It's been on market 52 days. Have you received any prior offers? Is the seller open to a 5% concession, seller financing, or rate buy-down credit?
- Is there a deadline driving the sale (1031 exchange, divorce, estate, relocation)? That informs how much negotiation room exists.
- What's the average days-on-market for RENTAL listings here right now (not sales)? A rising rental-DOM trend means longer vacancies and softer asking-rent achievability than the comps imply.
- What's the recent tenant-quality profile in this submarket — average credit score on applications, eviction rate, late-payment / NSF rate, and stable-employment percentage? A property-management company in the area should have these aggregated.
- How much new for-sale + rental construction is in the pipeline within 1–3 miles? Heavy new supply typically softens prices + rents 12–24 months out; constrained supply supports both.
Investment metrics
- 1% rule
- 0.95% ✗
- Cap rate
- 7.77%
- Cash-on-cash
- 5.29%
- DSCR
- 1.24
- GRM
- 8.8
CMA / ARV
No comps found within radius.
Projected returns pro-forma
3.0% appreciation · 3.0% rent growth · sell at horizon
- IRR
- 12.4%
- Equity multiple
- 1.71×
- Total profit
- $26,841
- Equity at exit
- $60,702
- IRR
- 14.4%
- Equity multiple
- 3.13×
- Total profit
- $80,650
- Equity at exit
- $93,549
Cash invested: $37,800 (down + closing). Projections, not guarantees.
Landlord ↔ Tenant lean methodology
- Overall (STATE)
- 62 Landlord-Friendly
- State Michigan
- 62 Landlord-Friendly · EVEN
- County
- — inherits STATE
- City
- — inherits STATE
ZIP-level market 49775
- Active inventory
- 27
- Price-to-rent
- 8.8×
Monthly cashflow live
- Estimated rent
- $1,280 medium interval (Pro) →
- Mortgage (P&I)
- −$708
- Tax from tax record
- −$80 /mo · $960/yr
- Insurance
- −$56
- HOA
- −$0
- Vacancy / Maint / Mgmt
- −$269
- Net cashflow
- $167
Break-even live
Sensitivity live
| Price | -10% $243 | -5% $205 | +0% $167 | +5% $128 | +10% $90 |
|---|---|---|---|---|---|
| Rent | -10% $66 | -5% $116 | +0% $167 | +5% $217 | +10% $268 |
| Rate | -1.0pp $235 | -0.5pp $201 | base $167 | +0.5pp $132 | +1.0pp $96 |
UW: 25.0% down · 7.5% · 30yr · 1.5% tax · 5.0% vac · 8.0% maint · 8.0% mgmt
Financing live
Cash to close
- Down payment
- $33,750
- Closing costs
- $4,050
- Reserves months
- —
- Total cash needed
- —
Loan-product check · same deal, 3 products live
Conventional
25% down · 7.5% · 30yr
- Down + closing
- —
- Monthly P&I
- —
- Monthly cashflow
- —
- DSCR
- —
- Eligible?
- —
Personal DTI + credit; lowest rate.
DSCR
20% down · 8.5% · 30yr
- Down + closing
- —
- Monthly P&I
- —
- Monthly cashflow
- —
- DSCR
- —
- Eligible?
- —
No personal income docs; deal must DSCR.
Hard money
10% down · 12.0% · 12mo
- Down + closing
- —
- Monthly P&I
- —
- Monthly cashflow
- —
- DSCR
- —
- Eligible?
- —
Short-term bridge; refi at stabilization.
Listing history 26 events
-
2026-06-18status $135,000 Pending 52 DOM
-
2026-06-18days on market $135,000 Active 52 DOM
-
2026-06-17days on market $135,000 Active 51 DOM
-
2026-06-16days on market $135,000 Active 50 DOM
-
2026-06-15days on market $135,000 Active 49 DOM
-
2026-06-13days on market $135,000 Active 47 DOM
-
2026-06-12days on market $135,000 Active 46 DOM
-
2026-06-09days on market $135,000 Active 43 DOM
-
2026-06-08days on market $135,000 Active 42 DOM
-
2026-06-07days on market $135,000 Active 41 DOM
-
2026-06-05remarks 187-char remark
-
2026-06-05pricedays on market $135,000 Active 39 DOM
-
2026-06-04days on market $149,000 Active 37 DOM
-
2026-06-02days on market $149,000 Active 36 DOM
-
2026-06-01days on market $149,000 Active 35 DOM
-
2026-05-31days on market $149,000 Active 34 DOM
-
2026-05-31days on market $149,000 Active 33 DOM
-
2026-04-27$149,000 Active
-
2025-09-10soldstatus $43,000 Closed 228-char remark
Show marketing remark (228 chars)
Three nicely elevated and wooded parcels each measuring in excess of 1 acre each. All lots have frontage on East Huron Drive. power is at road. Lots are listed for $17,500 each or all three can be purchased together for $50,000.
-
2024-11-30$17,500 Active 228-char remark
Show marketing remark (228 chars)
Three nicely elevated and wooded parcels each measuring in excess of 1 acre each. All lots have frontage on East Huron Drive. power is at road. Lots are listed for $17,500 each or all three can be purchased together for $50,000.
-
2024-11-11$149,000 Active
-
2019-09-20soldstatus $65,000
-
2019-04-22$69,900
-
2018-05-17$87,500
-
2007-09-04soldstatus $108,000
-
2006-06-23soldstatus $108,000
ⓘ Source: listings_history table (triggers on properties + properties_extension) + one-shot
backfill from property_details.listing_events for pre-trigger history.
Tax reassessment forecast MI · Partial reset (capped growth)
- Current annual tax
- $960 · $80/mo
- Projected year-2 tax
- $1,520 · $127/mo
- Expected delta
- +$559/yr (+$47/mo · 58.3%)
ⓘ Screening estimate from a state-policy table — verify with the county assessor before closing.
Climate risk First Street
- Flood 1/10 Low FEMA zone X (unshaded) · 0% chance over 30 yrs
- Wildfire 3/10 Moderate
- Heat 1/10 Low 7 d/yr ≥89°F today · 14 d/yr by 30 yrs out
- Wind 1/10 Low
- Air quality 1/10 Low 0 unhealthy d/yr today · 0 by 30 yrs out
Nearby sold comps map
Loading sold comps map…
Walkable amenities ~0.75 mi
Loading nearby amenities…
Taxation est. · year 1
- Rental income
- $15,355
- − Mortgage interest
- −$7,562
- − Property taxes
- −$960
- − Insurance
- −$675
- − Repairs & maintenance
- −$1,228
- − Management
- −$1,228
- − Depreciation
- −$3,927
- Taxable loss
- −$226
- Est. tax savings @ 24.0%
- +$54
- After-tax cash flow
- $2,054/yr
For passive investors: Depreciation is non-cash, so a rental often shows a tax loss while cash-flowing — sheltering income. Rental losses are passive: they offset passive income freely, and up to $25,000/yr can offset ordinary (W-2) income if you actively participate and your MAGI is under $100k (phasing out to $0 by $150k); unused losses carry forward. On sale, claimed depreciation is recaptured at up to 25%, and gains may owe capital-gains tax (a 1031 exchange can defer both). Figures are a year-1 estimate at your 24.0% rate — not tax advice; consult a CPA.
Schools (NCES district)
No district data.
Livability — Bois Blanc
No livability data for this city. (Only ~50 U.S. cities are tracked.)
Census & demographics
- Population (ZIP)
- 44
Population outlook (Mackinac County) Hauer SSP2
- Today (2025)
- 10,449 people
- By 2030
- 10,075 · -3.6%
- By 2040
- 9,220 · -11.8%
- By 2050
- 8,595 · -17.7%
- By 2075
- 7,996 · -23.5%
- By 2100
- 7,434 · -28.9%
Race, ethnicity, and origin ACS 2023
- Neighborhood character
- Predominantly White (100%)
- Race & ethnicity
- White 100%
- Common ancestry
- Romanian 11% Iranian 7% Slovak 2%
- Foreign-born
- 11%
- Languages at home
- 86% English-only · German/W. Germanic 14%
Political lean MEDSL · Mackinac
- 2024 margin
- Strong R (+24.9) · D 37.0% · R 61.8% · Other 1.2%
- 2008→2024 swing
- -21.1pp toward R · 2008: -3.8pp · 2024: -24.9pp
- All cycles
- 2024: R+24.9 2020: R+23.8 2016: R+27.2 2012: R+12.2 2008: R+3.8
Not yet ingested
- Civics
- —
Market trends
- HPI YoY
- —
- Current HPI
- —
- Rent YoY
- —
- Metro
- —
- State GDP YoY
- ▲ 1.37%
- F500 in state
- 28
Industry mix (Fortune 500 HQ in MI)
| Industry | F500 HQs | Revenue |
|---|---|---|
| Automotive Parts | 3 | $48B |
|
||
| Automotive | 2 | $372B |
|
||
| Chemicals | 1 | $45B |
|
||
| Automotive Retail | 1 | $29B |
|
||
| Healthcare / Medical Devices | 1 | $23B |
|
||
| Automotive Technology | 1 | $20B |
|
||
Price history
+38.0% since first listed9 events — show timeline
- 2026-04-27 Listed $149,000 EUPBR
- 2025-09-10 Sold (MLS) $43,000 EUPBR
- 2024-11-30 Listed $17,500 EUPBR
- 2024-11-11 Listed $149,000 EUPBR
- 2019-09-20 Sold (MLS) $65,000 WWMLS
- 2019-04-22 Listed $69,900 WWMLS
- 2018-05-17 Listed $87,500 WWMLS
- 2007-09-04 Sold (Public Records) $108,000 Public Records
- 2006-06-23 Sold (Public Records) $108,000 Public Records
Property tax history
-2.9%/yrLatest (2023): $960 · -1.0% YoY. Source: county tax records.
Cash-flow waterfall
monthlySold comps — $/sqft
last 12 mo · ≤1 miLoading sold comps…