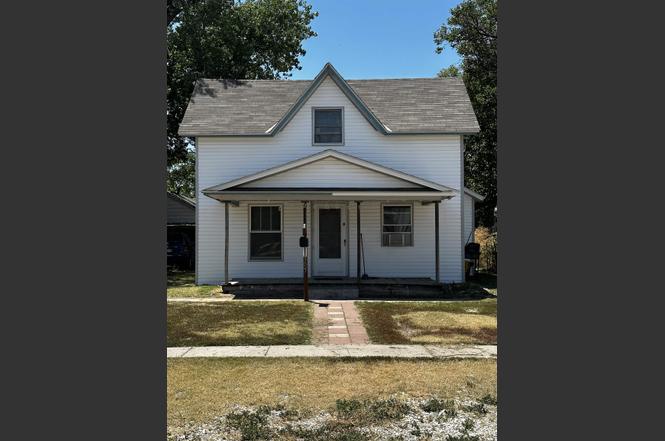
305 N Jefferson St · Plainville, KS
Flood risk 1/10 · Minimal
- FEMA flood zone
- —
- Chance of flooding over 30 yrs
- 0.0%
- Est. flood insurance / yr
- —
Fire risk 5/10 · Moderate
- Est. fire insurance / yr
- $1,154 – $2,142
Heat risk 4/10 · Minor
- Hot days now (above 103°F)
- 7 days/yr
- Hot days in 30 yrs
- 17 days/yr
Wind risk 2/10 · Minimal
- Chance of severe wind over 30 yrs
- —
Air-quality risk 2/10 · Minimal
- Unhealthy air days now
- 1 days/yr
- Unhealthy air days in 30 yrs
- 1 days/yr
Risk factors via First Street. Map © Google.
Why this score? — see what drove the B grade
The composite is a weighted blend of 9 inputs, each scored 0–100. Each bar is that input's sub-score; the figure is the points it added to the 100-point composite (weight × sub-score).
- Cash flow +30.0/30.0
- 1% rule +10.0/10.0
- DSCR +10.0/10.0
- ARV discount +7.5/15.0
- Livability +4.0/5.0
- Appreciation +3.0/10.0
- Schools +2.9/10.0
- Rent growth +2.5/5.0
- Condition / age +2.5/5.0
$75,000
🖨 Deal sheet (PDF) 📄 Offer letter ✓ Due diligence
Key facts
- Separate entrance
- Kitchen appliances
- New plumbing
Tags
Property features AI
Exterior
- Utilities: Public water; Public sewer; Cable available; Natural gas available
- Home design: Single-story residential property; Zoned C-1 (commercial/office zoning - verify with local jurisdiction)
- Construction: Composition roof
- Exterior features: Covered porch or patio
Interior
- Kitchen: Range; Oven; Refrigerator
- Bedrooms: One main-level bedroom
- Heating & cooling: Window-unit cooling
- Interior features: Window coverings throughout; Partial basement
Neighborhood map
What this means for you Summary
Snapshot
- This is a 4-bed/1.0-bath single-family listed at $75k.
Deal economics
- At list price, monthly cash flow is $374 ($4k/yr) — positive.
- The deal already cash-flows at list — no discount required.
- Meets the 1% rule at list price ($1k rent vs $75k).
- Recommended offer: $66k (12.0% below list) — sets the bar for market timing.
Location & tenants
- Location reads 79/100 on livability (#21 in KS, #2,088 nationally) — a middle-class / working-renter tenant base. Strengths: cost of living A+, housing A+, health & safety A+; Watch: amenities F, commute F.
- Plainville (rural): math 30% / reading 30% proficiency, ranked #166 of 280 in KS (top 59%) — families likely to look elsewhere, expect single-tenant / working-renter base with shorter leases.
- Zoned schools: Plainville Elem (math 27% / reading 32%, grade F, #463 of 684 statewide, top 73%, 234 students, 48% FRL); Plainville High (math 17% / reading 32%, grade F, #105 of 327 statewide, top 49%, 182 students, 38% FRL).
- Market conditions: 7 active listings in the ZIP; 3 units permitted in Rooks County in 2024 (0 in 5+ unit buildings).
Forward outlook
- Local home prices are declining (-3.0%/yr); year-one equity from $519 of loan paydown is wiped out by about $2k of value loss. Plan a longer hold.
- At projected returns (-3.0% appreciation + 3.0% rent growth), your $21k cash investment doubles in ~6 years — after that, you're playing with house money.
Negotiation context
- It's been on market 340 days — a 12% lower offer ($66k) is reasonable based on typical stale-listing flexibility.
- Current owner paid $30k; list at $75k implies a 150% gain — meaningful room to come down on a strong offer.
Risks & watch-outs
- Watch-outs: built in 1910 — expect roof / HVAC / electrical / plumbing capex.
- Climate carrying-cost: moderate wildfire risk — expect insurance premiums to compound above CPI over the hold.
Questions for the listing agent
- It's been on market 340 days. Have you received any prior offers? Is the seller open to a 12% concession, seller financing, or rate buy-down credit?
- Built in 1910 — when were the roof, HVAC, electrical panel, plumbing, and water heater last replaced?
- Why hasn't it sold? Are there any deal-killer items the seller is aware of (foundation, flood, title, zoning, code violations)?
- Is there a deadline driving the sale (1031 exchange, divorce, estate, relocation)? That informs how much negotiation room exists.
- Schools are D-rated, which usually means shorter tenancies and higher turnover. Who's the typical renter profile here, and what's been the actual vacancy rate?
- What's the average days-on-market for RENTAL listings here right now (not sales)? A rising rental-DOM trend means longer vacancies and softer asking-rent achievability than the comps imply.
- What's the recent tenant-quality profile in this submarket — average credit score on applications, eviction rate, late-payment / NSF rate, and stable-employment percentage? A property-management company in the area should have these aggregated.
- How much new for-sale + rental construction is in the pipeline within 1–3 miles? Heavy new supply typically softens prices + rents 12–24 months out; constrained supply supports both.
Investment metrics
- 1% rule
- 1.51% ✓
- Cap rate
- 12.28%
- Cash-on-cash
- 21.40%
- DSCR
- 1.95
- GRM
- 5.5
CMA / ARV
No comps found within radius.
Projected returns pro-forma
-3.0% appreciation · 3.0% rent growth · sell at horizon
- IRR
- 14.0%
- Equity multiple
- 1.56×
- Total profit
- $11,712
- Equity at exit
- $11,183
- IRR
- 22.8%
- Equity multiple
- 2.95×
- Total profit
- $40,975
- Equity at exit
- $6,485
Cash invested: $21,000 (down + closing). Projections, not guarantees.
Landlord ↔ Tenant lean methodology
- Overall (STATE)
- 83 Strongly Landlord-Friendly
- State Kansas
- 83 Strongly Landlord-Friendly · R+10
- County
- — inherits STATE
- City
- — inherits STATE
ZIP-level market 67663
- Home prices YoY
- -2.4%
- Active inventory
- 7
- Price-to-rent
- 5.5×
Monthly cashflow live
- Estimated rent
- $1,130 medium interval (Pro) →
- Mortgage (P&I)
- −$393
- Tax est. 1.5%
- −$94 /mo · $1,125/yr
- Insurance
- −$31
- HOA
- −$0
- Vacancy / Maint / Mgmt
- −$237
- Net cashflow
- $374
Break-even live
Sensitivity live
| Price | -10% $426 | -5% $400 | +0% $374 | +5% $349 | +10% $323 |
|---|---|---|---|---|---|
| Rent | -10% $285 | -5% $330 | +0% $374 | +5% $419 | +10% $464 |
| Rate | -1.0pp $412 | -0.5pp $394 | base $374 | +0.5pp $355 | +1.0pp $335 |
UW: 25.0% down · 7.5% · 30yr · 1.5% tax · 5.0% vac · 8.0% maint · 8.0% mgmt
Financing live
Cash to close
- Down payment
- $18,750
- Closing costs
- $2,250
- Reserves months
- —
- Total cash needed
- —
Loan-product check · same deal, 3 products live
Conventional
25% down · 7.5% · 30yr
- Down + closing
- —
- Monthly P&I
- —
- Monthly cashflow
- —
- DSCR
- —
- Eligible?
- —
Personal DTI + credit; lowest rate.
DSCR
20% down · 8.5% · 30yr
- Down + closing
- —
- Monthly P&I
- —
- Monthly cashflow
- —
- DSCR
- —
- Eligible?
- —
No personal income docs; deal must DSCR.
Hard money
10% down · 12.0% · 12mo
- Down + closing
- —
- Monthly P&I
- —
- Monthly cashflow
- —
- DSCR
- —
- Eligible?
- —
Short-term bridge; refi at stabilization.
Listing history 20 events
-
2026-06-19days on market $75,000 Active 340 DOM
-
2026-06-18days on market $75,000 Active 339 DOM
-
2026-06-17days on market $75,000 Active 338 DOM
-
2026-06-16days on market $75,000 Active 337 DOM
-
2026-06-15days on market $75,000 Active 336 DOM
-
2026-06-14days on market $75,000 Active 334 DOM
-
2026-06-12days on market $75,000 Active 333 DOM
-
2026-06-09days on market $75,000 Active 330 DOM
-
2026-06-08days on market $75,000 Active 329 DOM
-
2026-06-07days on market $75,000 Active 328 DOM
-
2026-06-05days on market $75,000 Active 326 DOM
-
2026-06-02days on market $75,000 Active 323 DOM
-
2026-06-01days on market $75,000 Active 322 DOM
-
2026-05-31days on market $75,000 Active 321 DOM
-
2026-05-30days on market $75,000 Active 320 DOM
-
2025-09-08price $75,000
-
2025-07-14$78,500 Active
-
1997-05-01soldstatus $30,000
-
1996-12-01soldstatus $7,250
-
1995-09-01soldstatus $3,500
ⓘ Source: listings_history table (triggers on properties + properties_extension) + one-shot
backfill from property_details.listing_events for pre-trigger history.
Climate risk First Street
- Flood 1/10 Low 0% chance over 30 yrs
- Wildfire 5/10 Major
- Heat 4/10 Moderate 7 d/yr ≥103°F today · 17 d/yr by 30 yrs out
- Wind 2/10 Low
- Air quality 2/10 Low 1 unhealthy d/yr today · 1 by 30 yrs out
Nearby sold comps map
Loading sold comps map…
Walkable amenities ~0.75 mi
Loading nearby amenities…
Taxation est. · year 1
- Rental income
- $13,561
- − Mortgage interest
- −$4,201
- − Property taxes
- −$1,125
- − Insurance
- −$375
- − Repairs & maintenance
- −$1,085
- − Management
- −$1,085
- − Depreciation
- −$2,182
- Taxable income
- $3,508
- Est. tax owed @ 24.0%
- −$842
- After-tax cash flow
- $3,651/yr
For passive investors: Depreciation is non-cash, so a rental often shows a tax loss while cash-flowing — sheltering income. Rental losses are passive: they offset passive income freely, and up to $25,000/yr can offset ordinary (W-2) income if you actively participate and your MAGI is under $100k (phasing out to $0 by $150k); unused losses carry forward. On sale, claimed depreciation is recaptured at up to 25%, and gains may owe capital-gains tax (a 1031 exchange can defer both). Figures are a year-1 estimate at your 24.0% rate — not tax advice; consult a CPA.
Schools (NCES district)
- District
- Plainville
- NCES district ID
- 2010740
- Math proficiency
- 30% ▲ 5.00%
- Reading proficiency
- 30% ▼ -5.00%
- Median HH income
- $46,331
- Composite
- 28.69/100
- National rank
- #12011
- State rank
- #166 of 280 in KS
Livability — Plainville
- Score
- 79/100
- State rank
- #21
- US rank
- #2088
Category grades
Schools grade is shown separately in the Schools card above.
Census & demographics
- Census place
- Plainville, KS
- Population (ZIP)
- 2,449
Population outlook (Rooks County) Hauer SSP2
- Today (2025)
- 5,196 people
- By 2030
- 5,218 · +0.4%
- By 2040
- 5,216 · +0.4%
- By 2050
- 5,171 · -0.5%
- By 2075
- 5,171 · -0.5%
- By 2100
- 4,713 · -9.3%
Race, ethnicity, and origin ACS 2023
- Neighborhood character
- Predominantly White (92%)
- Race & ethnicity
- White 92% Black 4% Hispanic / Latino 3% Two or more races 3%
- Common ancestry
- Lithuanian 5% Portuguese 2% Hungarian 1%
- Foreign-born
- 0% · China
- Languages at home
- 99% English-only · Spanish 1%
Political lean MEDSL · Rooks
- 2024 margin
- Solid R (+71.2) · D 13.8% · R 85.0% · Other 1.3%
- 2008→2024 swing
- -9.4pp toward R · 2008: -61.8pp · 2024: -71.2pp
- All cycles
- 2024: R+71.2 2020: R+73.7 2016: R+72.6 2012: R+67.1 2008: R+61.8
Not yet ingested
- Civics
- —
Market trends
- HPI YoY
- ▼ -3.93%
- Current HPI
- 157.17
- Rent YoY
- —
- Metro
- —
- State GDP YoY
- —
- F500 in state
- 0
Price history
+2042.9% since first listed5 events — show timeline
- 2025-09-08 Price Changed $75,000 Hays MLS
- 2025-07-14 Listed $78,500 Hays MLS
- 1997-05-01 Sold (Public Records) $30,000 Public Records
- 1996-12-01 Sold (Public Records) $7,250 Public Records
- 1995-09-01 Sold (Public Records) $3,500 Public Records
Cash-flow waterfall
monthlySold comps — $/sqft
last 12 mo · ≤1 miLoading sold comps…