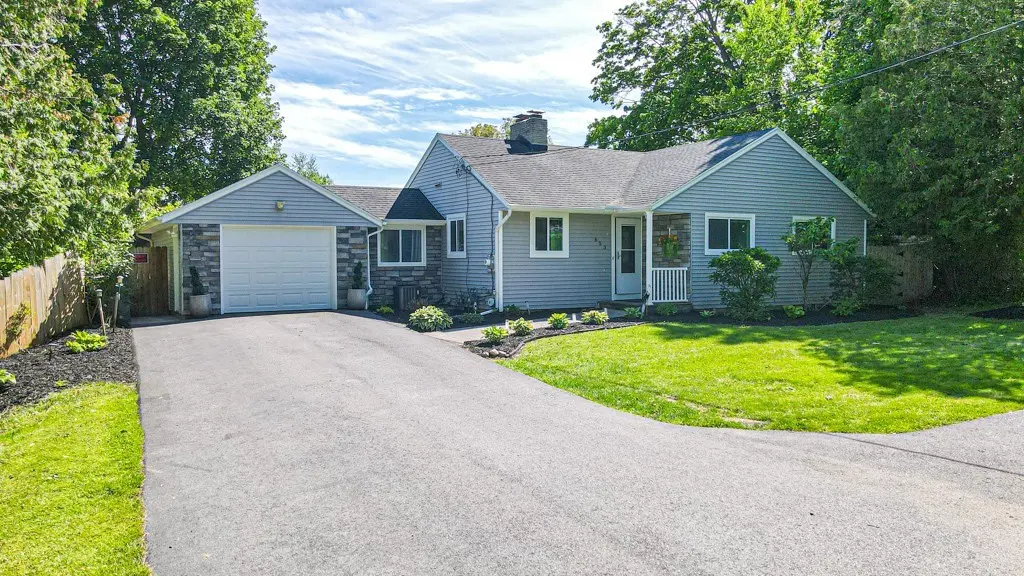
653 Brooks Rd · Rochester Institute of Technology, NY
Flood risk 1/10 · Minimal
- FEMA flood zone
- X (unshaded)
- Chance of flooding over 30 yrs
- 0.0%
- Est. flood insurance / yr
- $473 – $860
Fire risk 3/10 · Minor
- Est. fire insurance / yr
- $691 – $1,283
Heat risk 2/10 · Minimal
- Hot days now (above 94°F)
- 7 days/yr
- Hot days in 30 yrs
- 15 days/yr
Wind risk 1/10 · Minimal
- Chance of severe wind over 30 yrs
- —
Air-quality risk 2/10 · Minimal
- Unhealthy air days now
- 1 days/yr
- Unhealthy air days in 30 yrs
- 1 days/yr
Risk factors via First Street. Map © Google.
Why this score? — see what drove the F grade
The composite is a weighted blend of 9 inputs, each scored 0–100. Each bar is that input's sub-score; the figure is the points it added to the 100-point composite (weight × sub-score).
- Cash flow +11.7/30.0
- Schools +5.2/10.0
- 1% rule +3.5/10.0
- DSCR +3.4/10.0
- Rent growth +2.5/5.0
- Livability +2.5/5.0
- Condition / age +2.5/5.0
- ARV discount +0.0/15.0
- Appreciation +0.0/10.0
$249,900
🖨 Deal sheet (PDF) 📄 Offer letter ✓ Due diligence
Listing remarks
* * * COZY UPDATED 3 BEDROOM 1.5 BATH VINYL-SIDED RANCH * * * ~NESTLED IN A PEACEFUL COUNTRY-LIKE SETTING~ * THIS WELL-MAINTAINED HOME FEATURES VINYL PLANK FLOORING THROUGHOUT * ~ WOOD-BURNING FIREPLACE IN THE LIVING ROOM~ * CHARMING BREEZEWAY 80 SQ FT PER SELLER NOT INCLUDED IN TOWN SQ FT THAT ADDS CHARACTER AND FUNCTIONALITY * ~DREAMY WHITE KITCHEN OFFERS * GRANITE COUNTERTOPS * STAINLESS STEEL APPLIANCES AND A BRIGHT MODERN FEEL PERFECT FOR EVERYDAY LIVING AND ENTERTAINING~ * THE MAIN BATH HAS BEEN BEAUTIFULLY UPDATED * ~HOME IS WELL INSULATED FOR YEAR-ROUND COMFORT~ * FINISHED 625 SQ FT CELLAR DOOR WALK-OUT BASEMENT NOT INCLUDED IN TOWN SQ FT PROVIDES EVEN MORE LIVING SPACE WITH A
Key facts
- Finished cellar
- Granite countertops
- Updated main bath
Tags
Property features AI
Exterior
- Parking: Attached garage (1 car)
- Utilities: Public water connected; Septic sewer; Water service connected
- Home design: Single-story home; Resale property; Stone and vinyl siding exterior
- Construction: Block foundation; Existing structure (year built details listed as existing)
- Exterior features: Blacktop driveway; Rectangular lot with approximately 100 x 350 dimensions; Main thoroughfare road frontage
Interior
- Kitchen: Dishwasher; Gas oven; Gas range; Microwave; Refrigerator
- Bedrooms: Three main-level bedrooms
- Flooring: Luxury vinyl
- Bathrooms: One full bathroom; One half bathroom (one main-level bathroom listed)
- Heating & cooling: Gas forced-air heating; Central air conditioning
- Interior features: Finished basement; Galley kitchen; Open living/dining area; Solid surface countertops; Luxury vinyl flooring; Two fireplaces
- Laundry & utility: Laundry in basement; Gas water heater
Neighborhood map
What this means for you Summary
Snapshot
- This is a 3-bed/1.0-bath single-family listed at $250k.
Deal economics
- At list price, monthly cash flow is $-72 ($-869/yr) — negative.
- To cash-flow at today's rent, offer at most $237k (5.1% below list).
- To meet the 1% rule (rent ≥ 1% of price), the offer needs to be $213k (14.8% below list).
- Recommended offer: $213k (14.8% below list) — sets the bar for 1% rule.
- Cap rate 5.9% vs local median 3.8% in Rochester Institute of Technology — top-decile yield for the area; either an underpriced asset or a hidden risk that comps aren't pricing in. Stress-test before assuming the spread holds.
Location & tenants
- Location reads: area grade F — affects rentability + tenant quality, not the cash-flow math above.
- Rush-Henrietta Central School District (suburban): math 62% / reading 57% proficiency, ranked #237 of 590 in NY (top 40%) — acceptable for families but not a draw, mixed tenant base, ~2y average lease.
- Zoned schools: Emma E Sherman Elementary School (math 46% / reading 49%, grade C-, #306 of 729 statewide, top 43%, 564 students, 52% FRL); Henry V Burger Junior High School (math 48% / reading 56%, grade C+, #241 of 729 statewide, top 35%, 691 students, 43% FRL); Rush-Henrietta Senior High School (math 97% / reading 72%, grade A, #379 of 1,100 statewide, top 36%, 1,300 students, 43% FRL) — zoned schools average 46% FRL vs 29% district-wide (17 pts higher); higher-poverty schools than district average — tighter screening recommended.
- Market conditions: 40 active listings in the ZIP; 1 comparable units currently listed for rent nearby; high-income renter base; 1,169 units permitted in Monroe County in 2024 (591 in 5+ unit buildings).
Forward outlook
- Local home prices are declining (-3.0%/yr); year-one equity from $2k of loan paydown is wiped out by about $7k of value loss. Plan a longer hold.
- Monroe County population projected to shrink 6% by 2050 — rents likely to lag national; underwrite the cash flow, not the appreciation.
Negotiation context
- Only 6 days on market — expect competitive offers; lowballing is unlikely to land.
- Current owner paid $85k; list at $250k implies a 194% gain — meaningful room to come down on a strong offer.
Risks & watch-outs
- Watch-outs: built in 1951 — expect roof / HVAC / electrical / plumbing capex.
Questions for the listing agent
- What do current leases actually rent for vs. the listed asking? Can we see a recent rent roll and the last 12 months of T-12 income?
- Built in 1951 — when were the roof, HVAC, electrical panel, plumbing, and water heater last replaced?
- Is there a deadline driving the sale (1031 exchange, divorce, estate, relocation)? That informs how much negotiation room exists.
- The area grade is low — what's the realistic commute time and amenity access for the typical tenant pool here? Any planned neighborhood developments (good or bad) we should know about?
- What's the average days-on-market for RENTAL listings here right now (not sales)? A rising rental-DOM trend means longer vacancies and softer asking-rent achievability than the comps imply.
- What's the recent tenant-quality profile in this submarket — average credit score on applications, eviction rate, late-payment / NSF rate, and stable-employment percentage? A property-management company in the area should have these aggregated.
- How much new for-sale + rental construction is in the pipeline within 1–3 miles? Heavy new supply typically softens prices + rents 12–24 months out; constrained supply supports both.
Investment metrics
- 1% rule
- 0.85% ✗
- Cap rate
- 5.95%
- Cash-on-cash
- -1.24%
- DSCR
- 0.94
- GRM
- 9.8
CMA / ARV
- ARV (on-the-fly)
- $185,328
- Comps found
- 1
Show comp detail 1 sale within ~0.75 mi
| Address | Dist | Beds/Ba | Sqft | Sold | Price | $/sf | Match |
|---|---|---|---|---|---|---|---|
| 5331 W Henrietta Rd | 0.35mi | 2/1.0 (-1) | 936 (0%) | 21mo | $185,000 | $198 | 61 |
Match score weights: distance 35% · size 25% · config 20% · recency 20%. Top-matched comps best support the ARV.
Projected returns pro-forma
-3.0% appreciation · 3.0% rent growth · sell at horizon
- IRR
- -18.3%
- Equity multiple
- 0.36×
- Total profit
- $-45,059
- Equity at exit
- $37,261
- IRR
- -10.6%
- Equity multiple
- 0.36×
- Total profit
- $-44,977
- Equity at exit
- $21,607
Cash invested: $69,972 (down + closing). Projections, not guarantees.
Landlord ↔ Tenant lean methodology
- Overall (STATE)
- 15 Strongly Tenant-Friendly
- State New York
- 15 Strongly Tenant-Friendly · D+10
- County
- — inherits STATE
- City
- — inherits STATE
ZIP-level market 14586
- Home prices YoY
- -8.5%
- Active inventory
- 40
- Price-to-rent
- 9.8×
Monthly cashflow live
- Estimated rent
- $2,130 medium interval (Pro) →
- Mortgage (P&I)
- −$1,311
- Tax from tax record
- −$340 /mo · $4,085/yr
- Insurance
- −$104
- HOA
- −$0
- Vacancy / Maint / Mgmt
- −$447
- Net cashflow
- $-72
Break-even live
Sensitivity live
| Price | -10% $69 | -5% $-2 | +0% $-72 | +5% $-143 | +10% $-214 |
|---|---|---|---|---|---|
| Rent | -10% $-241 | -5% $-157 | +0% $-72 | +5% $12 | +10% $96 |
| Rate | -1.0pp $53 | -0.5pp $-9 | base $-72 | +0.5pp $-137 | +1.0pp $-203 |
UW: 25.0% down · 7.5% · 30yr · 1.5% tax · 5.0% vac · 8.0% maint · 8.0% mgmt
Financing live
Cash to close
- Down payment
- $62,475
- Closing costs
- $7,497
- Reserves months
- —
- Total cash needed
- —
Loan-product check · same deal, 3 products live
Conventional
25% down · 7.5% · 30yr
- Down + closing
- —
- Monthly P&I
- —
- Monthly cashflow
- —
- DSCR
- —
- Eligible?
- —
Personal DTI + credit; lowest rate.
DSCR
20% down · 8.5% · 30yr
- Down + closing
- —
- Monthly P&I
- —
- Monthly cashflow
- —
- DSCR
- —
- Eligible?
- —
No personal income docs; deal must DSCR.
Hard money
10% down · 12.0% · 12mo
- Down + closing
- —
- Monthly P&I
- —
- Monthly cashflow
- —
- DSCR
- —
- Eligible?
- —
Short-term bridge; refi at stabilization.
Rent comps 1 comps
| Address | Beds | Baths | Sqft | Rent | $/sqft | DOM | Units | Dist |
|---|---|---|---|---|---|---|---|---|
| 340 Bennington Hills Ct West Henrietta, NY | 1.0–3.0 | 1.0–2.0 | 970 | $2,007 | $2.07 | 4d | 5 | 0.73mi |
Listing history 7 events
-
2026-06-05status $249,900 Pending 6 DOM
-
2026-06-03days on market $249,900 Active 6 DOM
-
2026-06-03days on market $249,900 Active 5 DOM
-
2026-06-01days on market $249,900 Active 4 DOM
-
2026-05-31days on market $249,900 Active 3 DOM
-
2026-05-28$249,900 Active
-
2015-07-08soldstatus $85,000
ⓘ Source: listings_history table (triggers on properties + properties_extension) + one-shot
backfill from property_details.listing_events for pre-trigger history.
Tax reassessment forecast NY · Partial reset (capped growth)
- Current annual tax
- $4,085 · $340/mo
- Projected year-2 tax
- $4,154 · $346/mo
- Expected delta
- +$69/yr (+$6/mo · 1.7%)
ⓘ Screening estimate from a state-policy table — verify with the county assessor before closing.
Climate risk First Street
- Flood 1/10 Low FEMA zone X (unshaded) · 0% chance over 30 yrs
- Wildfire 3/10 Moderate
- Heat 2/10 Low 7 d/yr ≥94°F today · 15 d/yr by 30 yrs out
- Wind 1/10 Low
- Air quality 2/10 Low 1 unhealthy d/yr today · 1 by 30 yrs out
Nearby sold comps map
Loading sold comps map…
Walkable amenities ~0.75 mi
Loading nearby amenities…
Taxation est. · year 1
- Rental income
- $25,558
- − Mortgage interest
- −$13,998
- − Property taxes
- −$4,085
- − Insurance
- −$1,250
- − Repairs & maintenance
- −$2,045
- − Management
- −$2,045
- − Depreciation
- −$7,270
- Taxable loss
- −$5,133
- Est. tax savings @ 24.0%
- +$1,232
- After-tax cash flow
- $363/yr
For passive investors: Depreciation is non-cash, so a rental often shows a tax loss while cash-flowing — sheltering income. Rental losses are passive: they offset passive income freely, and up to $25,000/yr can offset ordinary (W-2) income if you actively participate and your MAGI is under $100k (phasing out to $0 by $150k); unused losses carry forward. On sale, claimed depreciation is recaptured at up to 25%, and gains may owe capital-gains tax (a 1031 exchange can defer both). Figures are a year-1 estimate at your 24.0% rate — not tax advice; consult a CPA.
Schools (NCES district)
- District
- Rush-Henrietta Central School District
- NCES district ID
- 3625170
- Math proficiency
- 62% ▼ -6.00%
- Reading proficiency
- 57% ▲ 1.00%
- Median HH income
- $58,682
- Composite
- 51.52/100
- National rank
- #1720
- State rank
- #237 of 590 in NY
Livability — Rochester Institute of Technology
No livability data for this city. (Only ~50 U.S. cities are tracked.)
Census & demographics
- County
- Monroe County · 674,131 people
- Metro
- Rochester, NY
- Population (ZIP)
- 13,291
- Household income
- $124,457
- Rent vs Own
- Severe rent burden
- 458.0
Population outlook (Monroe County) Hauer SSP2
- Today (2025)
- 759,460 people
- By 2030
- 757,154 · -0.3%
- By 2040
- 740,644 · -2.5%
- By 2050
- 714,443 · -5.9%
- By 2075
- 645,883 · -15.0%
- By 2100
- 547,084 · -28.0%
Race, ethnicity, and origin ACS 2023
- Neighborhood character
- Predominantly White (69%)
- Race & ethnicity
- White 69% Asian 15% Black 7% Two or more races 5% Hispanic / Latino 4%
- Common ancestry
- Romanian 4% Iranian 2% Lithuanian 2%
- Foreign-born
- 16% · China, India, Vietnam
- Languages at home
- 81% English-only · Other Indo-European 7% Spanish 4% Chinese 3%
Political lean MEDSL · Monroe
- 2024 margin
- D (+19.1) · D 59.5% · R 40.5%
- 2008→2024 swing
- +1.4pp toward D · 2008: 17.7pp · 2024: 19.1pp
- All cycles
- 2024: D+19.1 2020: D+21.0 2016: D+14.1 2012: D+17.4 2008: D+17.7
Not yet ingested
- Civics
- —
Market trends
- HPI YoY
- ▼ -24.58%
- Current HPI
- 265.7183
- Rent YoY
- —
- Metro
- Rochester, NY
- State GDP YoY
- ▲ 2.60%
- F500 in state
- 92
Industry mix (Fortune 500 HQ in NY)
| Industry | F500 HQs | Revenue |
|---|---|---|
| Financial Services | 10 | $950B |
|
||
| Consumer Goods | 9 | $162B |
|
||
| Insurance | 4 | $225B |
|
||
| Telecommunications | 2 | $144B |
|
||
| Pharmaceuticals | 2 | $112B |
|
||
| Media / Entertainment | 2 | $69B |
|
||
Price history
+194.0% since first listed2 events — show timeline
- 2026-05-28 Listed $249,900 UNYREIS
- 2015-07-08 Sold (Public Records) $85,000 Public Records
Property tax history
+2.5%/yrLatest (2025): $4,085 · +12.1% YoY. Source: county tax records.
Cash-flow waterfall
monthlySold comps — $/sqft
last 12 mo · ≤1 miLoading sold comps…