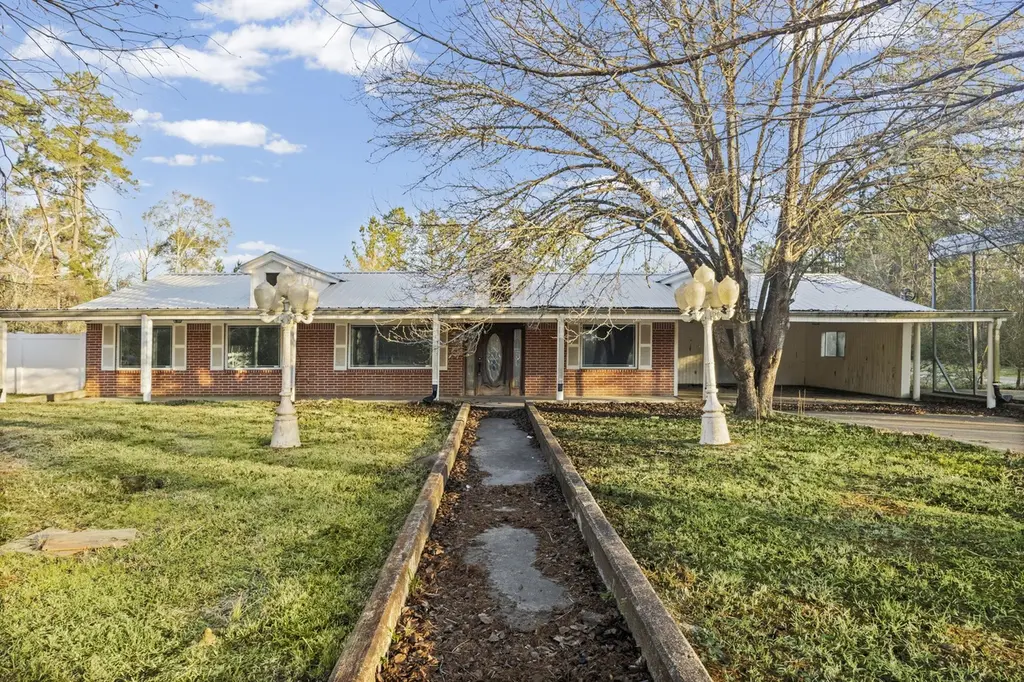
631 Fm 253 Rd · Buna, TX
Flood risk 8/10 · Major
- FEMA flood zone
- X (unshaded)
- Chance of flooding over 30 yrs
- 0.99%
- Est. flood insurance / yr
- $507 – $1,088
Fire risk 4/10 · Minor
- Est. fire insurance / yr
- $1,222 – $2,270
Heat risk 9/10 · Severe
- Hot days now (above 112°F)
- 7 days/yr
- Hot days in 30 yrs
- 23 days/yr
Wind risk 9/10 · Severe
- Chance of severe wind over 30 yrs
- 99.0%
Air-quality risk 2/10 · Minimal
- Unhealthy air days now
- 1 days/yr
- Unhealthy air days in 30 yrs
- 1 days/yr
Risk factors via First Street. Map © Google.
Why this score? — see what drove the C grade
The composite is a weighted blend of 9 inputs, each scored 0–100. Each bar is that input's sub-score; the figure is the points it added to the 100-point composite (weight × sub-score).
- Cash flow +18.0/30.0
- ARV discount +15.0/15.0
- 1% rule +7.4/10.0
- DSCR +5.6/10.0
- Schools +3.6/10.0
- Livability +2.9/5.0
- Rent growth +2.5/5.0
- Condition / age +2.5/5.0
- Appreciation +0.0/10.0
$109,950
🖨 Deal sheet 📄 Offer letter ✓ Due diligence
Listing remarks MLS
UNIQUE PROPERTY, INSIDE OF HOUSE HAS BEEN TOTALLY REDONE. PROPERTY IS ALL ELECTRIC. ON WELL AND SEPTIC. INCLUDES HOUSE, ENCLOSED FIBERGLASS POOL WITH SKYLIGHTS AND DIVING BOARD. GUEST SLEEPING AREA. GAME ROOM WITH KITCHEN AREA INCLUDING LOTS OF CABINETS, FREE STANDING STOVE, VENT A HOOD, MICROWAVE, DISHWASHER, REFRIGERATOR. POOL TABLES, BEER SIGNS COVERING THE WALL, WET BAR, FULL BATH AND SAUNA. ONE OF A KING MANCAGE, WORKSHOR AND ST0RAGE AREA FOR CARS, FARM EQUIPMENT, ETC. , SPRING FED POND. RV COVERED PARKING AREA. LOTS OF EXTRA PARKING AND GREAT BACK YARD FOR GAMES WITH THE KIDS. TOO MUCH TO DESCRIBE A MUST SEE.
Key facts
- Boating
- Solid foundation
- Strong bones
Tags
Property features AI
Finance
- Financial info: Lease not considered
Exterior
- Parking: Attached carport; 3-car carport
- Utilities: Public water; Public sewer
- Home design: Residential property; Built in 1961; Single-story (slab foundation)
- Construction: Brick and wood siding construction; Slab foundation; Metal roof
- Exterior features: Metal roof; Lot includes other features
Interior
- Bathrooms: 2 full bathrooms
- Heating & cooling: Central heating (electric); Central air conditioning (electric)
- Interior features: 7 total rooms
Neighborhood map
What this means for you Summary
Snapshot
- This is a 3-bed/2.0-bath single-family listed at $110k.
Deal economics
- At list price, monthly cash flow is $28 ($342/yr) — positive.
- The deal already cash-flows at list — no discount required.
- Meets the 1% rule at list price ($1k rent vs $110k).
- Recommended offer: $108k (1.5% below list) — sets the bar for market timing.
Location & tenants
- Location reads 58/100 on livability (#1,216 in TX) — a working-class tenant base; expect higher turnover. Strengths: cost of living A+, crime A-, housing B; Watch: schools D-, amenities F, commute F.
- Buna ISD (rural): math 39% / reading 45% proficiency, ranked #342 of 826 in TX (top 41%) — families likely to look elsewhere, expect single-tenant / working-renter base with shorter leases.
- Market conditions: 103 active listings in the ZIP; 45 units permitted in Jasper County in 2024 (0 in 5+ unit buildings).
Forward outlook
- Local home prices are declining (-3.0%/yr); year-one equity from $760 of loan paydown is wiped out by about $3k of value loss. Plan a longer hold.
- Jasper County population projected at -15% by 2050 — secular population decline; favor cash flow + early exit over multi-decade hold.
Negotiation context
- It's been on market 28 days — a 2% lower offer ($108k) is reasonable based on typical stale-listing flexibility.
- 4 sale attempts since 8y ago with the ask held roughly flat each time — persistent listings suggest the price (not the market) is what's stuck; bring a comps-based counter.
Risks & watch-outs
- Watch-outs: property tax is 3.9% of price; flood insurance adds $66/mo.
- Climate carrying-cost: severe flood risk; severe wind risk, 99% chance of damaging wind over 30y; extreme-heat days projected 7→23/yr by 2055 (HVAC capex compounding) — expect insurance premiums to compound above CPI over the hold.
Questions for the listing agent
- Built in 1961 — when were the roof, HVAC, electrical panel, plumbing, and water heater last replaced?
- Property tax is high relative to price — has the assessment been appealed recently, and will the sale trigger a re-assessment?
- What's the actual annual flood-insurance premium (NFIP or private), and is the property in a SFHA with mandatory coverage?
- Is there a deadline driving the sale (1031 exchange, divorce, estate, relocation)? That informs how much negotiation room exists.
- Schools are D-rated, which usually means shorter tenancies and higher turnover. Who's the typical renter profile here, and what's been the actual vacancy rate?
- What's the average days-on-market for RENTAL listings here right now (not sales)? A rising rental-DOM trend means longer vacancies and softer asking-rent achievability than the comps imply.
- What's the recent tenant-quality profile in this submarket — average credit score on applications, eviction rate, late-payment / NSF rate, and stable-employment percentage? A property-management company in the area should have these aggregated.
- How much new for-sale + rental construction is in the pipeline within 1–3 miles? Heavy new supply typically softens prices + rents 12–24 months out; constrained supply supports both.
Investment metrics
- 1% rule
- 1.24% ✓
- Cap rate
- 7.33%
- Cash-on-cash
- 3.70%
- DSCR
- 1.16
- GRM
- 6.7
CMA / ARV
- ARV (median comp)
- $212,202
- List price
- $109,950
- Delta
- -48.19%
- Verdict
- UNDERPRICED
- Comps
- 3 within 1.0 mi
Show comp detail 1 sale within ~0.75 mi
| Address | Dist | Beds/Ba | Sqft | Sold | Price | $/sf | Match |
|---|---|---|---|---|---|---|---|
| 631 Fm 253 Rd | 0.00mi | 3/2.0 | 1,752 (0%) | 0mo | $109,950 | $63 | 100 |
Match score weights: distance 35% · size 25% · config 20% · recency 20%. Top-matched comps best support the ARV.
Projected returns pro-forma
-3.0% appreciation · 3.0% rent growth · sell at horizon
- IRR
- -14.3%
- Equity multiple
- 0.49×
- Total profit
- $-15,808
- Equity at exit
- $16,394
- IRR
- -5.3%
- Equity multiple
- 0.65×
- Total profit
- $-10,634
- Equity at exit
- $9,506
Cash invested: $30,786 (down + closing). Projections, not guarantees.
Landlord ↔ Tenant lean methodology
- Overall (STATE)
- 87 Strongly Landlord-Friendly
- State Texas
- 87 Strongly Landlord-Friendly · R+5
- County
- — inherits STATE
- City
- — inherits STATE
ZIP-level market 77612
- Home prices YoY
- -5.7%
- Active inventory
- 103
- Price-to-rent
- 6.7×
Monthly cashflow live
- Estimated rent
- $1,360 medium interval (Pro) →
- Mortgage (P&I)
- −$577
- Tax from tax record
- −$357 /mo · $4,281/yr
- Insurance
- −$46
- Flood insurance flood zone
- −$66 /mo · $798/yr
- HOA
- −$0
- Vacancy / Maint / Mgmt
- −$286
- Net cashflow
- $28
Break-even live
UW: 25.0% down · 7.5% · 30yr · 1.5% tax · 5.0% vac · 8.0% maint · 8.0% mgmt
Financing live
Cash to close
- Down payment
- $27,488
- Closing costs
- $3,298
- Reserves months
- —
- Total cash needed
- —
Loan-product check · same deal, 3 products live
Conventional
25% down · 7.5% · 30yr
- Down + closing
- —
- Monthly P&I
- —
- Monthly cashflow
- —
- DSCR
- —
- Eligible?
- —
Personal DTI + credit; lowest rate.
DSCR
20% down · 8.5% · 30yr
- Down + closing
- —
- Monthly P&I
- —
- Monthly cashflow
- —
- DSCR
- —
- Eligible?
- —
No personal income docs; deal must DSCR.
Hard money
10% down · 12.0% · 12mo
- Down + closing
- —
- Monthly P&I
- —
- Monthly cashflow
- —
- DSCR
- —
- Eligible?
- —
Short-term bridge; refi at stabilization.
Listing history 14 events
-
2026-06-03days on market $109,950 Active 28 DOM
-
2026-06-02days on market $109,950 Active 27 DOM
-
2026-06-01days on market $109,950 Active 26 DOM
-
2026-05-31days on market $109,950 Active 25 DOM
-
2026-05-30days on market $109,950 Active 24 DOM
-
2026-05-06status Active
-
2026-05-06historical
-
2026-05-06$109,950 Active 740-char remark
-
2026-04-27historical Active Under Contract
-
2026-04-01price $109,950
-
2026-02-25price $124,950
-
2026-01-20$134,950 Active
-
2018-05-30soldstatus
Show marketing remark (622 chars)
UNIQUE PROPERTY, INSIDE OF HOUSE HAS BEEN TOTALLY REDONE. PROPERTY IS ALL ELECTRIC. ON WELL AND SEPTIC. INCLUDES HOUSE, ENCLOSED FIBERGLASS POOL WITH SKYLIGHTS AND DIVING BOARD. GUEST SLEEPING AREA. GAME ROOM WITH KITCHEN AREA INCLUDING LOTS OF CABINETS, FREE STANDING STOVE, VENT A HOOD, MICROWAVE, DISHWASHER, REFRIGERATOR. POOL TABLES, BEER SIGNS COVERING THE WALL, WET BAR, FULL BATH AND SAUNA. ONE OF A KING MANCAGE, WORKSHOR AND ST0RAGE AREA FOR CARS, FARM EQUIPMENT, ETC. , SPRING FED POND. RV COVERED PARKING AREA. LOTS OF EXTRA PARKING AND GREAT BACK YARD FOR GAMES WITH THE KIDS. TOO MUCH TO DESCRIBE A MUST SEE.
-
2018-04-18$200,000
Show marketing remark (622 chars)
UNIQUE PROPERTY, INSIDE OF HOUSE HAS BEEN TOTALLY REDONE. PROPERTY IS ALL ELECTRIC. ON WELL AND SEPTIC. INCLUDES HOUSE, ENCLOSED FIBERGLASS POOL WITH SKYLIGHTS AND DIVING BOARD. GUEST SLEEPING AREA. GAME ROOM WITH KITCHEN AREA INCLUDING LOTS OF CABINETS, FREE STANDING STOVE, VENT A HOOD, MICROWAVE, DISHWASHER, REFRIGERATOR. POOL TABLES, BEER SIGNS COVERING THE WALL, WET BAR, FULL BATH AND SAUNA. ONE OF A KING MANCAGE, WORKSHOR AND ST0RAGE AREA FOR CARS, FARM EQUIPMENT, ETC. , SPRING FED POND. RV COVERED PARKING AREA. LOTS OF EXTRA PARKING AND GREAT BACK YARD FOR GAMES WITH THE KIDS. TOO MUCH TO DESCRIBE A MUST SEE.
ⓘ Source: listings_history table (triggers on properties + properties_extension) + one-shot
backfill from property_details.listing_events for pre-trigger history.
Tax reassessment forecast TX · Resets to sale price
- Current annual tax
- $4,281 · $357/mo
- Projected year-2 tax
- $4,281 · $357/mo
- Expected delta
- $0/yr ($0/mo · 0.0%)
ⓘ Screening estimate from a state-policy table — verify with the county assessor before closing.
Climate risk First Street
- Flood 8/10 Severe FEMA zone X (unshaded) · 99% chance over 30 yrs
- Wildfire 4/10 Moderate
- Heat 9/10 Extreme 7 d/yr ≥112°F today · 23 d/yr by 30 yrs out
- Wind 9/10 Extreme 99% chance of damaging wind over 30 yrs
- Air quality 2/10 Low 1 unhealthy d/yr today · 1 by 30 yrs out
Nearby sold comps map
Loading sold comps map…
Walkable amenities ~0.75 mi
Loading nearby amenities…
Taxation est. · year 1
- Rental income
- $16,315
- − Mortgage interest
- −$6,159
- − Property taxes
- −$4,281
- − Insurance
- −$1,347
- − Repairs & maintenance
- −$1,305
- − Management
- −$1,305
- − Depreciation
- −$3,199
- Taxable loss
- −$1,281
- Est. tax savings @ 24.0%
- +$307
- After-tax cash flow
- $649/yr
For passive investors: Depreciation is non-cash, so a rental often shows a tax loss while cash-flowing — sheltering income. Rental losses are passive: they offset passive income freely, and up to $25,000/yr can offset ordinary (W-2) income if you actively participate and your MAGI is under $100k (phasing out to $0 by $150k); unused losses carry forward. On sale, claimed depreciation is recaptured at up to 25%, and gains may owe capital-gains tax (a 1031 exchange can defer both). Figures are a year-1 estimate at your 24.0% rate — not tax advice; consult a CPA.
Schools (NCES district)
- District
- Buna ISD
- NCES district ID
- 4812090
- Math proficiency
- 39% ▼ -7.00%
- Reading proficiency
- 45% ▼ -1.00%
- Median HH income
- $46,815
- Composite
- 35.83/100
- National rank
- #4826
- State rank
- #342 of 826 in TX
Livability — Buna
- Score
- 58/100
- State rank
- #1216
- US rank
- #21222
Category grades
Schools grade is shown separately in the Schools card above.
Census & demographics
- Population (ZIP)
- 9,152
Population outlook (Jasper County) Hauer SSP2
- Today (2025)
- 33,986 people
- By 2030
- 32,965 · -3.0%
- By 2040
- 30,908 · -9.1%
- By 2050
- 28,893 · -15.0%
- By 2075
- 24,828 · -26.9%
- By 2100
- 19,987 · -41.2%
Race, ethnicity, and origin ACS 2023
- Neighborhood character
- Predominantly White (91%)
- Race & ethnicity
- White 91% Hispanic / Latino 8% Two or more races 5%
- Hispanic origin (detail)
- Mexican 7%
- Common ancestry
- Lithuanian 2% Italian 2% Slovak 1%
- Foreign-born
- 1% · Canada
- Languages at home
- 97% English-only · Spanish 2%
Political lean MEDSL · Jasper
- 2024 margin
- Solid R (+66.6) · D 16.5% · R 83.1%
- 2008→2024 swing
- -24.6pp toward R · 2008: -42.0pp · 2024: -66.6pp
- All cycles
- 2024: R+66.6 2020: R+61.4 2016: R+59.9 2012: R+48.4 2008: R+42.0
Not yet ingested
- Civics
- —
Market trends
- HPI YoY
- ▼ -10.14%
- Current HPI
- 168.7562
- Rent YoY
- —
- Metro
- —
- State GDP YoY
- ▲ 3.95%
- F500 in state
- 110
Industry mix (Fortune 500 HQ in TX)
| Industry | F500 HQs | Revenue |
|---|---|---|
| Energy | 16 | $1,198B |
|
||
| Technology | 5 | $198B |
|
||
| Engineering / Construction | 4 | $72B |
|
||
| Energy Services | 3 | $60B |
|
||
| Utilities | 3 | $41B |
|
||
| Healthcare | 2 | $330B |
|
||
Price history
-45.0% since first listed10 events — show timeline
- 2026-06-04 Sold (MLS) — HARMLS
- 2026-05-06 Relisted — HARMLS
- 2026-05-06 Listing Removed — HARMLS
- 2026-05-06 Listed $109,950 HARMLS
- 2026-04-27 Contingent — HARMLS
- 2026-04-01 Price Changed $109,950 HARMLS
- 2026-02-25 Price Changed $124,950 HARMLS
- 2026-01-20 Listed $134,950 HARMLS
- 2018-05-30 Sold (MLS) — BBOR
- 2018-04-18 Listed $200,000 BBOR
Property tax history
+11.1%/yrLatest (2025): $4,281 · -2.9% YoY. Source: county tax records.
Cash-flow waterfall
monthlySold comps — $/sqft
last 12 mo · ≤1 miLoading sold comps…