17377 Valley #19 · Fontana, CA
Flood risk 1/10 · Minimal
- FEMA flood zone
- X (unshaded)
- Chance of flooding over 30 yrs
- 0.0%
- Est. flood insurance / yr
- $507 – $1,088
Fire risk 2/10 · Minimal
- Est. fire insurance / yr
- $659 – $1,223
Heat risk 8/10 · Major
- Hot days now (above 103°F)
- 7 days/yr
- Hot days in 30 yrs
- 19 days/yr
Wind risk 1/10 · Minimal
- Chance of severe wind over 30 yrs
- —
Air-quality risk 10/10 · Severe
- Unhealthy air days now
- 27 days/yr
- Unhealthy air days in 30 yrs
- 32 days/yr
Risk factors via First Street. Map © Google.
Why this score? — see what drove the C+ grade
The composite is a weighted blend of 9 inputs, each scored 0–100. Each bar is that input's sub-score; the figure is the points it added to the 100-point composite (weight × sub-score).
- Cash flow +30.0/30.0
- 1% rule +10.0/10.0
- DSCR +10.0/10.0
- Livability +3.2/5.0
- Rent growth +3.1/5.0
- Condition / age +2.5/5.0
- Schools +2.4/10.0
- ARV discount +0.6/15.0
- Appreciation +0.0/10.0
$185,000
🖨 Deal sheet 📄 Offer letter ✓ Due diligence
Listing remarks
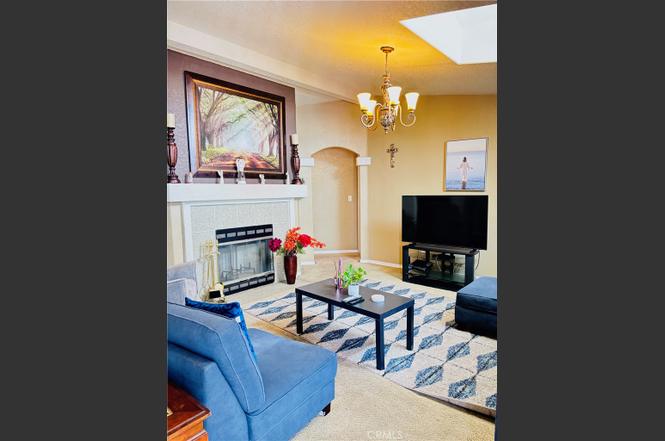
Welcome to this stunning and spacious home conveniently situated near shopping centers, Kaiser Hospital, and easy freeway access, this home offers both comfort and convenience. Inside, you’ll be greeted with tall ceilings and elegant arched walls that create a warm and inviting flow between the dining and living areas. The living room features a rare and beautiful fireplace, an exceptional detail not often found in mobile homes. The master room features a spacious bathroom, double sinks, and a relaxing Roman tub. The thoughtful floor plan includes two dining areas, a large kitchen, and generously sized bedrooms providing plenty of room for the whole family. House is located in a welco
Key facts
- Double sinks
- Rare fireplace
- Tall ceilings
Tags
Property features AI
Finance
- Other: Community features include gutters
- Financial info: Monthly land lease of $975 (park-provided)
- HOA & community: Park community with land lease
Exterior
- Parking: Located in Villa Fontana park
- Utilities: Public sewer; District/public water
- Home design: Single-story mobile home (13 ft x 60 ft); Mobile home remains on site
- Construction: Year built (per public records); Living area per public records
- Exterior features: Paved lot; No pool
Interior
- Bathrooms: 2 full bathrooms
- Heating & cooling: Central furnace heating
- Interior features: One-level home with front entry; Entry located at the front
- Laundry & utility: Laundry room inside the home; Individual laundry room; Gas and electric dryer hookups
Neighborhood map
What this means for you Summary
Snapshot
- This is a 3-bed/2.0-bath manufactured listed at $185k.
Deal economics
- At list price, monthly cash flow is $1k ($15k/yr) — positive.
- The deal already cash-flows at list — no discount required.
- Meets the 1% rule at list price ($3k rent vs $185k).
- Recommended offer: $163k (12.0% below list) — sets the bar for market timing.
- Cap rate 14.5% vs local median 3.2% in Fontana — top-decile yield for the area; either an underpriced asset or a hidden risk that comps aren't pricing in. Stress-test before assuming the spread holds.
Location & tenants
- Location reads 64/100 on livability (#415 in CA) — a middle-class / working-renter tenant base. Strengths: housing A+, commute A-, employment A-; Watch: schools F, amenities F, cost of living F.
- Colton Joint Unified (suburban): math 16% / reading 38% proficiency, ranked #373 of 517 in CA (top 72%) — low school quality limits family demand, transient renter base, plan for 1-2y turnover; 70% free/reduced lunch — lower-income household profile, screen leases tightly.
- Market conditions: Rents rising (+2.3%/yr); 115 active listings in the ZIP; 2 comparable units currently listed for rent nearby; solid renter incomes; 5,458 units permitted in San Bernardino County in 2024 (1,500 in 5+ unit buildings).
- At $3,010/mo this rent would consume 46% of the median local household income ($78k/yr) (locally 3437% of renters already pay >50% of income on rent) — very limited rent-growth headroom before tenants either downsize or default.
Forward outlook
- Local home prices are declining (-3.0%/yr); year-one equity from $1k of loan paydown is wiped out by about $6k of value loss. Plan a longer hold.
- San Bernardino County population projected at +15% by 2050 — modest demand growth; plan on rents tracking national, not racing it.
- At projected returns (-3.0% appreciation + 2.3% rent growth), your $52k cash investment doubles in ~5 years — after that, you're playing with house money.
Negotiation context
- It's been on market 192 days — a 12% lower offer ($163k) is reasonable based on typical stale-listing flexibility.
- 5 sale attempts with the ask held roughly flat each time — persistent listings suggest the price (not the market) is what's stuck; bring a comps-based counter.
Risks & watch-outs
- Climate carrying-cost: extreme-heat days projected 7→19/yr by 2055 (HVAC capex compounding) — expect insurance premiums to compound above CPI over the hold.
Questions for the listing agent
- It's been on market 192 days. Have you received any prior offers? Is the seller open to a 12% concession, seller financing, or rate buy-down credit?
- Why hasn't it sold? Are there any deal-killer items the seller is aware of (foundation, flood, title, zoning, code violations)?
- Is there a deadline driving the sale (1031 exchange, divorce, estate, relocation)? That informs how much negotiation room exists.
- Schools are F-rated, which usually means shorter tenancies and higher turnover. Who's the typical renter profile here, and what's been the actual vacancy rate?
- What's the average days-on-market for RENTAL listings here right now (not sales)? A rising rental-DOM trend means longer vacancies and softer asking-rent achievability than the comps imply.
- What's the recent tenant-quality profile in this submarket — average credit score on applications, eviction rate, late-payment / NSF rate, and stable-employment percentage? A property-management company in the area should have these aggregated.
- How much new for-sale + rental construction is in the pipeline within 1–3 miles? Heavy new supply typically softens prices + rents 12–24 months out; constrained supply supports both.
Investment metrics
- 1% rule
- 1.63% ✓
- Cap rate
- 14.54%
- Cash-on-cash
- 29.44%
- DSCR
- 2.31
- GRM
- 5.1
CMA / ARV
- ARV (on-the-fly)
- $160,380
- Comps found
- 5
Show comp detail 5 sales within ~0.75 mi
| Address | Dist | Beds/Ba | Sqft | Sold | Price | $/sf | Match |
|---|---|---|---|---|---|---|---|
| 17333 Valley Blvd #81 | 0.13mi | 3/2.0 | 1,440 (-11%) | 3mo | $130,000 | $90 | 73 |
| 17400 Valley Blvd #50 | 0.17mi | 3/2.0 | 1,440 (-11%) | 8mo | $175,000 | $122 | 67 |
| 17400 Valley Blvd #43 | 0.17mi | 4/2.0 (+1) | 1,440 (-11%) | 5mo | $205,000 | $142 | 64 |
| 17333 Valley Blvd | 0.13mi | 2/2.0 (-1) | 1,440 (-11%) | 13mo | $137,000 | $95 | 60 |
| 17400 Valley Blvd #57 | 0.17mi | 3/2.0 | 1,440 (-11%) | 19mo | $142,000 | $99 | 58 |
Match score weights: distance 35% · size 25% · config 20% · recency 20%. Top-matched comps best support the ARV.
Projected returns pro-forma
-3.0% appreciation · 2.34% rent growth · sell at horizon
- IRR
- 23.2%
- Equity multiple
- 1.94×
- Total profit
- $48,908
- Equity at exit
- $27,584
- IRR
- 30.7%
- Equity multiple
- 3.67×
- Total profit
- $138,517
- Equity at exit
- $15,995
Cash invested: $51,800 (down + closing). Projections, not guarantees.
Landlord ↔ Tenant lean methodology
- Overall (STATE)
- 18 Strongly Tenant-Friendly
- State California
- 18 Strongly Tenant-Friendly · D+13
- County
- — inherits STATE
- City
- — inherits STATE
ZIP-level market 92335
- Rents YoY
- 2.3%
- Active inventory
- 115
- Price-to-rent
- 5.1×
Monthly cashflow live
- Estimated rent
- $3,010 medium interval (Pro) →
- Mortgage (P&I)
- −$970
- Tax from tax record
- −$60 /mo · $718/yr
- Insurance
- −$77
- HOA
- −$0
- Vacancy / Maint / Mgmt
- −$632
- Net cashflow
- $1,271
Break-even live
UW: 25.0% down · 7.5% · 30yr · 1.5% tax · 5.0% vac · 8.0% maint · 8.0% mgmt
Financing live
Cash to close
- Down payment
- $46,250
- Closing costs
- $5,550
- Reserves months
- —
- Total cash needed
- —
Loan-product check · same deal, 3 products live
Conventional
25% down · 7.5% · 30yr
- Down + closing
- —
- Monthly P&I
- —
- Monthly cashflow
- —
- DSCR
- —
- Eligible?
- —
Personal DTI + credit; lowest rate.
DSCR
20% down · 8.5% · 30yr
- Down + closing
- —
- Monthly P&I
- —
- Monthly cashflow
- —
- DSCR
- —
- Eligible?
- —
No personal income docs; deal must DSCR.
Hard money
10% down · 12.0% · 12mo
- Down + closing
- —
- Monthly P&I
- —
- Monthly cashflow
- —
- DSCR
- —
- Eligible?
- —
Short-term bridge; refi at stabilization.
Rent comps 2 comps
| Address | Beds | Baths | Sqft | Rent | $/sqft | DOM | Units | Dist |
|---|---|---|---|---|---|---|---|---|
| 16970 Marygold Ave Fontana, CA | 2.0 | 2.0 | 1045 | $2,275 | $2.18 | 20d | 2 | 0.69mi |
| 17055 San Bernardino Ave Fontana, CA | 3.0 | 2.0 | 1630 | $3,350 | $2.06 | 44d | 1 | 0.71mi |
Listing history 23 events
-
2026-06-18days on market $185,000 Active 192 DOM
-
2026-06-17days on market $185,000 Active 191 DOM
-
2026-06-16days on market $185,000 Active 190 DOM
-
2026-06-15days on market $185,000 Active 189 DOM
-
2026-06-13days on market $185,000 Active 187 DOM
-
2026-06-13days on market $185,000 Active 186 DOM
-
2026-06-09days on market $185,000 Active 183 DOM
-
2026-06-08days on market $185,000 Active 182 DOM
-
2026-06-07days on market $185,000 Active 181 DOM
-
2026-06-04days on market $185,000 Active 178 DOM
-
2026-06-03days on market $185,000 Active 177 DOM
-
2026-06-02days on market $185,000 Active 176 DOM
-
2026-06-01days on market $185,000 Active 175 DOM
-
2026-05-31days on market $185,000 Active 174 DOM
-
2026-04-23status Pending Sale
-
2026-03-23status Active
-
2026-03-20status Pending Sale
-
2026-02-25status Active
-
2025-12-16status Active
-
2025-12-04status Pending Sale
-
2025-12-02status Active
-
2025-11-18status Pending Sale
-
2025-10-03$185,000 Active
ⓘ Source: listings_history table (triggers on properties + properties_extension) + one-shot
backfill from property_details.listing_events for pre-trigger history.
Tax reassessment forecast CA · Resets to sale price
- Current annual tax
- $718 · $60/mo
- Projected year-2 tax
- $1,406 · $117/mo
- Expected delta
- +$688/yr (+$57/mo · 95.9%)
ⓘ Screening estimate from a state-policy table — verify with the county assessor before closing.
Climate risk First Street
- Flood 1/10 Low FEMA zone X (unshaded) · 0% chance over 30 yrs
- Wildfire 2/10 Low
- Heat 8/10 Severe 7 d/yr ≥103°F today · 19 d/yr by 30 yrs out
- Wind 1/10 Low
- Air quality 10/10 Extreme 27 unhealthy d/yr today · 32 by 30 yrs out
Nearby sold comps map
Loading sold comps map…
Walkable amenities ~0.75 mi
Loading nearby amenities…
Taxation est. · year 1
- Rental income
- $36,118
- − Mortgage interest
- −$10,363
- − Property taxes
- −$718
- − Insurance
- −$925
- − Repairs & maintenance
- −$2,889
- − Management
- −$2,889
- − Depreciation
- −$5,382
- Taxable income
- $12,952
- Est. tax owed @ 24.0%
- −$3,108
- After-tax cash flow
- $12,140/yr
For passive investors: Depreciation is non-cash, so a rental often shows a tax loss while cash-flowing — sheltering income. Rental losses are passive: they offset passive income freely, and up to $25,000/yr can offset ordinary (W-2) income if you actively participate and your MAGI is under $100k (phasing out to $0 by $150k); unused losses carry forward. On sale, claimed depreciation is recaptured at up to 25%, and gains may owe capital-gains tax (a 1031 exchange can defer both). Figures are a year-1 estimate at your 24.0% rate — not tax advice; consult a CPA.
Schools (NCES district)
- District
- Colton Joint Unified
- NCES district ID
- 0609390
- Math proficiency
- 16% ▼ -9.00%
- Reading proficiency
- 38% ▼ -1.00%
- Median HH income
- $51,178
- Composite
- 23.74/100
- National rank
- #7820
- State rank
- #373 of 517 in CA
Livability — Fontana
- Score
- 64/100
- State rank
- #415
- US rank
- #14177
Category grades
Schools grade is shown separately in the Schools card above.
Census & demographics
- Census place
- Fontana, CA
- County
- San Bernardino County · 2,030,291 people
- City population
- 203,028
- Metro
- Riverside-San Bernardino-Ontario, CA
- Population (ZIP)
- 97,511
- Household income
- $77,949
- Rent vs Own
- Severe rent burden
- 3437.0
Population outlook (San Bernardino County) Hauer SSP2
- Today (2025)
- 2,300,329 people
- By 2030
- 2,378,907 · +3.4%
- By 2040
- 2,523,137 · +9.7%
- By 2050
- 2,642,388 · +14.9%
- By 2075
- 2,880,769 · +25.2%
- By 2100
- 2,909,436 · +26.5%
Race, ethnicity, and origin ACS 2023
- Neighborhood character
- Predominantly Hispanic (84%)
- Race & ethnicity
- Hispanic / Latino 84% Two or more races 13% White 8% Black 4% Asian 2% Native American 2%
- Hispanic origin (detail)
- Mexican 74%
- Common ancestry
- Italian 1%
- Foreign-born
- 34% · Canada, Vietnam
- Languages at home
- 27% English-only · Spanish 69% Arabic 1%
Political lean MEDSL · San Bernardino
- 2024 margin
- Toss-up / Even · D 47.5% · R 49.7% · Other 2.8%
- 2008→2024 swing
- -8.5pp toward R · 2008: 6.3pp · 2024: -2.1pp
- All cycles
- 2024: R+2.1 2020: D+10.7 2016: D+9.8 2012: D+5.4 2008: D+6.3
Not yet ingested
- Civics
- —
Market trends
- HPI YoY
- ▼ -804.67%
- Current HPI
- 507.5862
- Rent YoY
- ▲ 2.34%
- Metro
- Riverside-San Bernardino-Ontario, CA
- State GDP YoY
- ▲ 3.21%
- F500 in state
- 116
Industry mix (Fortune 500 HQ in CA)
| Industry | F500 HQs | Revenue |
|---|---|---|
| Technology | 27 | $1,492B |
|
||
| Financial Services | 3 | $174B |
|
||
| Retail | 3 | $44B |
|
||
| Insurance | 3 | $26B |
|
||
| Media / Entertainment | 2 | $115B |
|
||
| Pharmaceuticals / Biotech | 2 | $62B |
|
||
Price history
9 events — show timeline
- 2026-04-23 Pending — CRMLS
- 2026-03-23 Relisted — CRMLS
- 2026-03-20 Pending — CRMLS
- 2026-02-25 Relisted — CRMLS
- 2025-12-16 Relisted — CRMLS
- 2025-12-04 Pending — CRMLS
- 2025-12-02 Relisted — CRMLS
- 2025-11-18 Pending — CRMLS
- 2025-10-03 Listed $185,000 CRMLS
Property tax history
-3.2%/yrLatest (2025): $718 · +3.1% YoY. Source: county tax records.
Cash-flow waterfall
monthlySold comps — $/sqft
last 12 mo · ≤1 miLoading sold comps…