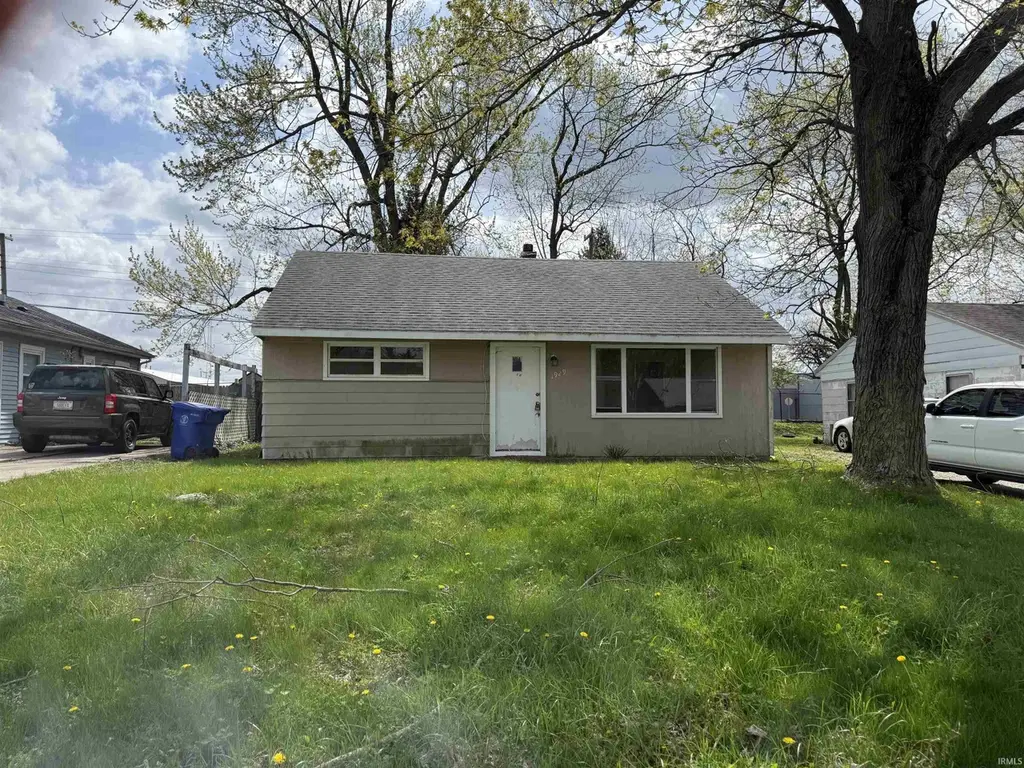
1929 W Vaile St · Kokomo, IN
Flood risk 1/10 · Minimal
- FEMA flood zone
- X (unshaded)
- Chance of flooding over 30 yrs
- 0.0%
- Est. flood insurance / yr
- $507 – $1,088
Fire risk 1/10 · Minimal
- Est. fire insurance / yr
- $717 – $1,331
Heat risk 3/10 · Minor
- Hot days now (above 101°F)
- 7 days/yr
- Hot days in 30 yrs
- 17 days/yr
Wind risk 2/10 · Minimal
- Chance of severe wind over 30 yrs
- —
Air-quality risk 3/10 · Minor
- Unhealthy air days now
- 1 days/yr
- Unhealthy air days in 30 yrs
- 3 days/yr
Risk factors via First Street. Map © Google.
Why this score? — see what drove the B grade
The composite is a weighted blend of 9 inputs, each scored 0–100. Each bar is that input's sub-score; the figure is the points it added to the 100-point composite (weight × sub-score).
- Cash flow +30.0/30.0
- ARV discount +15.0/15.0
- DSCR +10.0/10.0
- 1% rule +9.3/10.0
- Livability +3.4/5.0
- Condition / age +2.5/5.0
- Rent growth +2.1/5.0
- Schools +2.1/10.0
- Appreciation +0.0/10.0
$74,900
🖨 Deal sheet (PDF) 📄 Offer letter ✓ Due diligence
Listing remarks MLS
2 bed, 1 bath, 1 story ranch located in an established neighborhood. Had a family room and garage added onto it bringing it from 768 sqft to 1008 sqft.
Key facts
- 6,098 sq ft lot
- Garage
- Built 1965
Neighborhood map
What this means for you Summary
Snapshot
- This is a 3-bed/1.0-bath single-family listed at $75k.
Deal economics
- At list price, monthly cash flow is $293 ($4k/yr) — positive.
- The deal already cash-flows at list — no discount required.
- Meets the 1% rule at list price ($1k rent vs $75k).
- Cap rate 11.0% vs local median 5.2% in Kokomo — top-decile yield for the area; either an underpriced asset or a hidden risk that comps aren't pricing in. Stress-test before assuming the spread holds.
Location & tenants
- Location reads 68/100 on livability (#227 in IN) — a middle-class / working-renter tenant base. Strengths: cost of living A+, housing A+, health & safety A; Watch: crime D, amenities F, commute F.
- Kokomo School Corporation (urban): math 22% / reading 30% proficiency, ranked #264 of 301 in IN (top 88%) — low school quality limits family demand, transient renter base, plan for 1-2y turnover; 62% free/reduced lunch — lower-income household profile, screen leases tightly.
- Zoned schools: Wallace Elementary School (math 52% / reading 57%, grade C, #197 of 994 statewide, top 22%, 398 students, 47% FRL); Central Middle School (math 23% / reading 38%, grade F, #203 of 330 statewide, top 63%, 458 students, 57% FRL); Kokomo High School (math 19% / reading 48%, grade F, #289 of 369 statewide, top 78%, 1,519 students, 58% FRL).
- Zoned-school proficiency averages 40% at this address vs 26% district-wide (+14 pts) — the actual schools serving this property are materially stronger than the Kokomo School Corporation average implies; a family-tenant draw the district grade alone would hide.
- Market conditions: Rents soft (-1.5%/yr); 246 active listings in the ZIP; 4 comparable units currently listed for rent nearby; rentals at typical pace (median 25d on market — plan ~3-4 weeks tenant-placement turnaround); 194 units permitted in Howard County in 2024 (0 in 5+ unit buildings).
Forward outlook
- Local home prices are declining (-3.0%/yr); year-one equity from $518 of loan paydown is wiped out by about $2k of value loss. Plan a longer hold.
- Howard County population projected at -11% by 2050 — secular population decline; favor cash flow + early exit over multi-decade hold.
Negotiation context
- Only 1 days on market — expect competitive offers; lowballing is unlikely to land.
- 2 sale attempts since 13y ago with the ask held roughly flat each time — persistent listings suggest the price (not the market) is what's stuck; bring a comps-based counter.
- Current owner paid $14k; list at $75k implies a 435% gain — meaningful room to come down on a strong offer.
Questions for the listing agent
- Built in 1965 — when were the roof, HVAC, electrical panel, plumbing, and water heater last replaced?
- Is there a deadline driving the sale (1031 exchange, divorce, estate, relocation)? That informs how much negotiation room exists.
- Schools are F-rated, which usually means shorter tenancies and higher turnover. Who's the typical renter profile here, and what's been the actual vacancy rate?
- Crime grade is D in this area — have there been break-ins, vandalism, or insurance claims at this property in the last 3 years? What carrier currently insures it and at what premium?
- What's the average days-on-market for RENTAL listings here right now (not sales)? A rising rental-DOM trend means longer vacancies and softer asking-rent achievability than the comps imply.
- What's the recent tenant-quality profile in this submarket — average credit score on applications, eviction rate, late-payment / NSF rate, and stable-employment percentage? A property-management company in the area should have these aggregated.
- How much new for-sale + rental construction is in the pipeline within 1–3 miles? Heavy new supply typically softens prices + rents 12–24 months out; constrained supply supports both.
Investment metrics
- 1% rule
- 1.43% ✓
- Cap rate
- 10.99%
- Cash-on-cash
- 16.79%
- DSCR
- 1.75
- GRM
- 5.8
CMA / ARV
- ARV (on-the-fly)
- $119,040
- Comps found
- 12
Show comp detail 12 sales within ~0.75 mi
| Address | Dist | Beds/Ba | Sqft | Sold | Price | $/sf | Match |
|---|---|---|---|---|---|---|---|
| 1929 W Vaile St | 0.00mi | 3/1.0 | 768 (0%) | 0mo | $210,000 | $273 | 100 |
| 2001 W Vaile Ave | 0.03mi | 2/1.0 (-1) | 768 (0%) | 5mo | $115,000 | $150 | 90 |
| 1915 W Murden St | 0.06mi | 2/1.0 (-1) | 720 (-6%) | 4mo | $75,000 | $104 | 78 |
| 131 S Wildridge Dr | 0.45mi | 2/1.0 (-1) | 728 (-5%) | 0mo | $95,000 | $130 | 65 |
| 2009 W Vaile Ave | 0.05mi | 2/1.0 (-1) | 816 (+6%) | 21mo | $90,000 | $110 | 65 |
| 2511 Walker Ave | 0.56mi | 3/1.0 | 816 (+6%) | 7mo | $140,000 | $172 | 58 |
| 2519 Walker Ave | 0.57mi | 3/1.0 | 816 (+6%) | 7mo | $62,000 | $76 | 57 |
| 230 Wickersham Dr W | 0.70mi | 2/1.0 (-1) | 816 (+6%) | 0mo | $126,500 | $155 | 52 |
| 200 Elliott Ct | 0.44mi | 2/1.0 (-1) | 864 (+12%) | 10mo | $137,000 | $159 | 46 |
| 210 Elliott Ct | 0.43mi | 2/1.0 (-1) | 864 (+12%) | 10mo | $149,000 | $172 | 46 |
| 2501 W Sycamore St | 0.63mi | 2/1.0 (-1) | 816 (+6%) | 14mo | $135,000 | $165 | 44 |
| 1424 W Jackson St | 0.74mi | 2/1.0 (-1) | 720 (-6%) | 22mo | $108,000 | $150 | 31 |
Match score weights: distance 35% · size 25% · config 20% · recency 20%. Top-matched comps best support the ARV.
Projected returns pro-forma
-3.0% appreciation · 0.0% rent growth · sell at horizon
- IRR
- 4.4%
- Equity multiple
- 1.16×
- Total profit
- $3,442
- Equity at exit
- $11,168
- IRR
- 10.7%
- Equity multiple
- 1.72×
- Total profit
- $15,053
- Equity at exit
- $6,476
Cash invested: $20,972 (down + closing). Projections, not guarantees.
Landlord ↔ Tenant lean methodology
- Overall (STATE)
- 90 Strongly Landlord-Friendly
- State Indiana
- 90 Strongly Landlord-Friendly · R+11
- County
- — inherits STATE
- City
- — inherits STATE
ZIP-level market 46901
- Home prices YoY
- -24.4%
- Rents YoY
- -1.5%
- Active inventory
- 246
- Price-to-rent
- 5.8×
Monthly cashflow live
- Estimated rent
- $1,074 medium interval (Pro) →
- Mortgage (P&I)
- −$393
- Tax from tax record
- −$131 /mo · $1,576/yr
- Insurance
- −$31
- HOA
- −$0
- Vacancy / Maint / Mgmt
- −$226
- Net cashflow
- $293
Break-even live
Sensitivity live
| Price | -10% $336 | -5% $315 | +0% $293 | +5% $272 | +10% $251 |
|---|---|---|---|---|---|
| Rent | -10% $209 | -5% $251 | +0% $293 | +5% $336 | +10% $378 |
| Rate | -1.0pp $331 | -0.5pp $312 | base $293 | +0.5pp $274 | +1.0pp $254 |
UW: 25.0% down · 7.5% · 30yr · 1.5% tax · 5.0% vac · 8.0% maint · 8.0% mgmt
Financing live
Cash to close
- Down payment
- $18,725
- Closing costs
- $2,247
- Reserves months
- —
- Total cash needed
- —
Loan-product check · same deal, 3 products live
Conventional
25% down · 7.5% · 30yr
- Down + closing
- —
- Monthly P&I
- —
- Monthly cashflow
- —
- DSCR
- —
- Eligible?
- —
Personal DTI + credit; lowest rate.
DSCR
20% down · 8.5% · 30yr
- Down + closing
- —
- Monthly P&I
- —
- Monthly cashflow
- —
- DSCR
- —
- Eligible?
- —
No personal income docs; deal must DSCR.
Hard money
10% down · 12.0% · 12mo
- Down + closing
- —
- Monthly P&I
- —
- Monthly cashflow
- —
- DSCR
- —
- Eligible?
- —
Short-term bridge; refi at stabilization.
Rent comps 4 comps
| Address | Beds | Baths | Sqft | Rent | $/sqft | DOM | Units | Dist |
|---|---|---|---|---|---|---|---|---|
| 2241 W Jefferson St Kokomo, IN | 2.0 | 1.0 | 605 | $895 | $1.48 | 25d | 4 | 0.57mi |
| 800 N Dixon Rd Kokomo, IN | 2.0 | 1.0 | 885 | $1,100 | $1.24 | 25d | 7 | 0.99mi |
| 800 N Dixon Rd Kokomo, IN | 2.0 | 1.0 | 885 | $1,050 | $1.19 | 3d | 4 | 0.99mi |
| 1901 S Park Rd Kokomo, IN | 2.0 | 1.0 | 750 | $1,025 | $1.37 | 8d | 3 | 1.35mi |
Listing history 4 events
-
2026-04-14status Pending
-
2026-04-13$74,900 Active
-
2013-10-02soldstatus $14,000 151-char remark
Show marketing remark (151 chars)
2 bed, 1 bath, 1 story ranch located in an established neighborhood. Had a family room and garage added onto it bringing it from 768 sqft to 1008 sqft.
-
2013-06-08$17,900 151-char remark
Show marketing remark (151 chars)
2 bed, 1 bath, 1 story ranch located in an established neighborhood. Had a family room and garage added onto it bringing it from 768 sqft to 1008 sqft.
ⓘ Source: listings_history table (triggers on properties + properties_extension) + one-shot
backfill from property_details.listing_events for pre-trigger history.
Tax reassessment forecast IN · Partial reset (capped growth)
- Current annual tax
- $1,576 · $131/mo
- Projected year-2 tax
- $1,576 · $131/mo
- Expected delta
- $0/yr ($0/mo · 0.0%)
ⓘ Screening estimate from a state-policy table — verify with the county assessor before closing.
Climate risk First Street
- Flood 1/10 Low FEMA zone X (unshaded) · 0% chance over 30 yrs
- Wildfire 1/10 Low
- Heat 3/10 Moderate 7 d/yr ≥101°F today · 17 d/yr by 30 yrs out
- Wind 2/10 Low
- Air quality 3/10 Moderate 1 unhealthy d/yr today · 3 by 30 yrs out
Nearby sold comps map
Loading sold comps map…
Walkable amenities ~0.75 mi
Loading nearby amenities…
Taxation est. · year 1
- Rental income
- $12,892
- − Mortgage interest
- −$4,196
- − Property taxes
- −$1,576
- − Insurance
- −$374
- − Repairs & maintenance
- −$1,031
- − Management
- −$1,031
- − Depreciation
- −$2,179
- Taxable income
- $2,505
- Est. tax owed @ 24.0%
- −$601
- After-tax cash flow
- $2,920/yr
For passive investors: Depreciation is non-cash, so a rental often shows a tax loss while cash-flowing — sheltering income. Rental losses are passive: they offset passive income freely, and up to $25,000/yr can offset ordinary (W-2) income if you actively participate and your MAGI is under $100k (phasing out to $0 by $150k); unused losses carry forward. On sale, claimed depreciation is recaptured at up to 25%, and gains may owe capital-gains tax (a 1031 exchange can defer both). Figures are a year-1 estimate at your 24.0% rate — not tax advice; consult a CPA.
Schools (NCES district)
- District
- Kokomo School Corporation
- NCES district ID
- 1805370
- Math proficiency
- 22% ▼ -8.00%
- Reading proficiency
- 30% ▼ -5.00%
- Median HH income
- $35,804
- Composite
- 21.5/100
- National rank
- #8325
- State rank
- #264 of 301 in IN
Livability — Kokomo
- Score
- 68/100
- State rank
- #227
- US rank
- #9912
Category grades
Schools grade is shown separately in the Schools card above.
Census & demographics
- Census place
- Kokomo, IN
- County
- Howard County · 75,099 people
- City population
- 75,099
- Metro
- Kokomo, IN
- Population (ZIP)
- 38,082
- Household income
- $60,495
- Rent vs Own
- Severe rent burden
- 1116.0
Population outlook (Howard County) Hauer SSP2
- Today (2025)
- 81,522 people
- By 2030
- 80,104 · -1.7%
- By 2040
- 76,708 · -5.9%
- By 2050
- 72,880 · -10.6%
- By 2075
- 64,016 · -21.5%
- By 2100
- 51,705 · -36.6%
Race, ethnicity, and origin ACS 2023
- Neighborhood character
- Predominantly White (83%)
- Race & ethnicity
- White 83% Black 9% Two or more races 5% Hispanic / Latino 4%
- Common ancestry
- Italian 2% Romanian 2% Slovak 1%
- Foreign-born
- 1% · Canada
- Languages at home
- 96% English-only · German/W. Germanic 1% Spanish 1%
Political lean MEDSL · Howard
- 2024 margin
- Solid R (+35.3) · D 31.4% · R 66.7% · Other 1.8%
- 2008→2024 swing
- -29.1pp toward R · 2008: -6.2pp · 2024: -35.3pp
- All cycles
- 2024: R+35.3 2020: R+32.4 2016: R+33.9 2012: R+14.3 2008: R+6.2
Not yet ingested
- Civics
- —
Market trends
- HPI YoY
- ▼ -78.40%
- Current HPI
- 242.2565
- Rent YoY
- ▼ -1.47%
- Metro
- Kokomo, IN
- State GDP YoY
- ▲ 2.90%
- F500 in state
- 18
Industry mix (Fortune 500 HQ in IN)
| Industry | F500 HQs | Revenue |
|---|---|---|
| Industrial Machinery | 2 | $37B |
|
||
| Healthcare | 1 | $177B |
|
||
| Pharmaceuticals | 1 | $45B |
|
||
| Metals / Steel | 1 | $18B |
|
||
| Agriculture | 1 | $17B |
|
||
| Packaging | 1 | $12B |
|
||
Price history
+318.4% since first listed4 events — show timeline
- 2026-04-14 Pending — IRMLS
- 2026-04-13 Listed $74,900 IRMLS
- 2013-10-02 Sold (MLS) $14,000 MIBOR as Distributed by MLS Grid
- 2013-06-08 Listed $17,900 MIBOR as Distributed by MLS Grid
Property tax history
+3.5%/yrLatest (2024): $1,576 · +23.3% YoY. Source: county tax records.
Cash-flow waterfall
monthlySold comps — $/sqft
last 12 mo · ≤1 miLoading sold comps…