 🏗️ New Construction
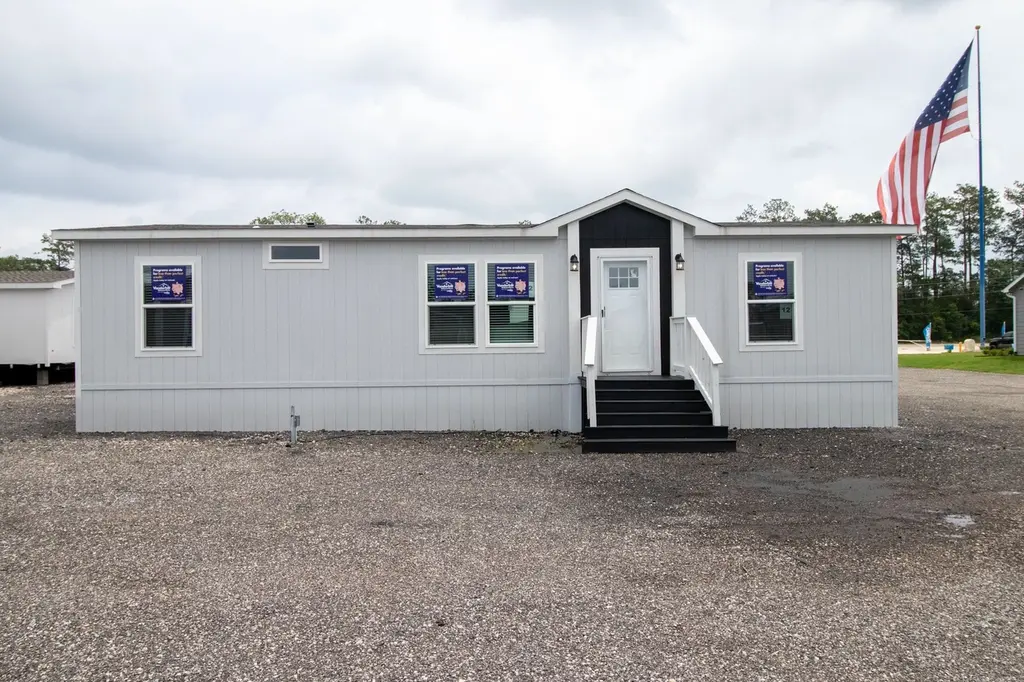
Clayton Marvel Plan · Tyler, TX
Flood risk 1/10 · Minimal
- FEMA flood zone
- X (unshaded)
- Chance of flooding over 30 yrs
- 0.0%
- Est. flood insurance / yr
- $507 – $1,088
Fire risk 3/10 · Minor
- Est. fire insurance / yr
- $1,222 – $2,270
Heat risk 6/10 · Moderate
- Hot days now (above 109°F)
- 7 days/yr
- Hot days in 30 yrs
- 23 days/yr
Wind risk 6/10 · Moderate
- Chance of severe wind over 30 yrs
- 55.0%
Air-quality risk 2/10 · Minimal
- Unhealthy air days now
- 0 days/yr
- Unhealthy air days in 30 yrs
- 1 days/yr
Risk factors via First Street. Map © Google.
Why this score? — see what drove the B+ grade
The composite is a weighted blend of 9 inputs, each scored 0–100. Each bar is that input's sub-score; the figure is the points it added to the 100-point composite (weight × sub-score).
- Cash flow +30.0/30.0
- 1% rule +10.0/10.0
- DSCR +10.0/10.0
- ARV discount +7.5/15.0
- Appreciation +7.5/10.0
- Condition / age +4.0/5.0
- Livability +3.8/5.0
- Schools +2.9/10.0
- Rent growth +2.5/5.0
$84,399
🖨 Deal sheet (PDF) 📄 Offer letter ✓ Due diligence
Listing remarks MLS
Tour a home in our community on your own time, without an agent, using our self guided tours! Tours available 7 days a week from 6am-9pm, just book a time slot and see it for yourself. Go to our website, navigate to our Fannin Meadows community page and look for the UTour button on the side of the page! ------------------------------------- The Clayton Marvel 4 is skillfully and economically designed double section with large living room, fully equipped kitchen, large bedrooms and beautiful comforting bathrooms.
Key facts
- Listed 299 days
Neighborhood map
What this means for you Summary
Snapshot
- This is a 4-bed/2.0-bath manufactured listed at $84k. Condition is rated good.
Deal economics
- At list price, monthly cash flow is $524 ($6k/yr) — positive.
- The deal already cash-flows at list — no discount required.
- Meets the 1% rule at list price ($1k rent vs $84k).
- Recommended offer: $74k (12.0% below list) — sets the bar for market timing.
- Cap rate 13.7% vs local median 3.5% in Tyler — top-decile yield for the area; either an underpriced asset or a hidden risk that comps aren't pricing in. Stress-test before assuming the spread holds.
Location & tenants
- Location reads 75/100 on livability (#147 in TX, #4,181 nationally) — a middle-class / working-renter tenant base. Strengths: cost of living A+, housing A+, health & safety A+; Watch: employment C-, crime D+, commute F.
- Winona ISD (rural): math 32% / reading 35% proficiency, ranked #539 of 826 in TX (top 65%) — families likely to look elsewhere, expect single-tenant / working-renter base with shorter leases.
- Zoned schools: Winona El (math 20% / reading 26%, grade F, #3,277 of 4,322 statewide, top 77%, 565 students, 90% FRL); Winona Middle (math 42% / reading 41%, grade F, #595 of 1,662 statewide, top 37%, 251 students, 87% FRL); Winona H S (math 42% / reading 42%, grade F, #730 of 1,632 statewide, top 47%, 288 students, 80% FRL) — zoned schools average 86% FRL vs 56% district-wide (30 pts higher); higher-poverty schools than district average — tighter screening recommended.
- Market conditions: 67 active listings in the ZIP; 2 comparable units currently listed for rent nearby; 595 units permitted in Smith County in 2024 (45 in 5+ unit buildings).
Forward outlook
- In year one you build about $5k of equity ($583 loan paydown + $4k appreciation (5.0% local appreciation)).
- Smith County population projected at +24% by 2050 — long-run rental-demand tailwind backs the buy-and-hold thesis.
- At projected returns (5.0% appreciation + 3.0% rent growth), your $24k cash investment doubles in ~3 years — after that, you're playing with house money.
- By year 7, paydown + projected appreciation supports a ~$31k cash-out refi (75% LTV) — recoverable capital for the next deal without selling this one.
Negotiation context
- It's been on market 299 days — a 12% lower offer ($74k) is reasonable based on typical stale-listing flexibility.
Risks & watch-outs
- Climate carrying-cost: major wind risk, 55% chance of damaging wind over 30y; extreme-heat days projected 7→23/yr by 2055 (HVAC capex compounding) — expect insurance premiums to compound above CPI over the hold.
Questions for the listing agent
- It's been on market 299 days. Have you received any prior offers? Is the seller open to a 12% concession, seller financing, or rate buy-down credit?
- Why hasn't it sold? Are there any deal-killer items the seller is aware of (foundation, flood, title, zoning, code violations)?
- Is there a deadline driving the sale (1031 exchange, divorce, estate, relocation)? That informs how much negotiation room exists.
- Schools are D-rated, which usually means shorter tenancies and higher turnover. Who's the typical renter profile here, and what's been the actual vacancy rate?
- Crime grade is D in this area — have there been break-ins, vandalism, or insurance claims at this property in the last 3 years? What carrier currently insures it and at what premium?
- What's the average days-on-market for RENTAL listings here right now (not sales)? A rising rental-DOM trend means longer vacancies and softer asking-rent achievability than the comps imply.
- What's the recent tenant-quality profile in this submarket — average credit score on applications, eviction rate, late-payment / NSF rate, and stable-employment percentage? A property-management company in the area should have these aggregated.
- How much new for-sale + rental construction is in the pipeline within 1–3 miles? Heavy new supply typically softens prices + rents 12–24 months out; constrained supply supports both.
Investment metrics
- 1% rule
- 1.66% ✓
- Cap rate
- 13.75%
- Cash-on-cash
- 26.62%
- DSCR
- 2.18
- GRM
- 5.0
CMA / ARV
No comps found within radius.
Projected returns pro-forma
4.96% appreciation · 3.0% rent growth · sell at horizon
- IRR
- 36.1%
- Equity multiple
- 3.23×
- Total profit
- $52,687
- Equity at exit
- $47,645
- IRR
- 34.4%
- Equity multiple
- 6.52×
- Total profit
- $130,549
- Equity at exit
- $82,079
Cash invested: $23,632 (down + closing). Projections, not guarantees.
Landlord ↔ Tenant lean methodology
- Overall (STATE)
- 87 Strongly Landlord-Friendly
- State Texas
- 87 Strongly Landlord-Friendly · R+5
- County
- — inherits STATE
- City
- — inherits STATE
ZIP-level market 75708
- Home prices YoY
- 2.4%
- Active inventory
- 67
- Price-to-rent
- 5.0×
Monthly cashflow live
- Estimated rent
- $1,402 medium interval (Pro) →
- Mortgage (P&I)
- −$443
- Tax est. 1.5%
- −$105 /mo · $1,266/yr
- Insurance
- −$35
- HOA
- −$0
- Vacancy / Maint / Mgmt
- −$294
- Net cashflow
- $524
Break-even live
Sensitivity live
| Price | -10% $582 | -5% $553 | +0% $524 | +5% $495 | +10% $466 |
|---|---|---|---|---|---|
| Rent | -10% $413 | -5% $469 | +0% $524 | +5% $580 | +10% $635 |
| Rate | -1.0pp $567 | -0.5pp $546 | base $524 | +0.5pp $502 | +1.0pp $480 |
UW: 25.0% down · 7.5% · 30yr · 1.5% tax · 5.0% vac · 8.0% maint · 8.0% mgmt
Financing live
Cash to close
- Down payment
- $21,100
- Closing costs
- $2,532
- Reserves months
- —
- Total cash needed
- —
Loan-product check · same deal, 3 products live
Conventional
25% down · 7.5% · 30yr
- Down + closing
- —
- Monthly P&I
- —
- Monthly cashflow
- —
- DSCR
- —
- Eligible?
- —
Personal DTI + credit; lowest rate.
DSCR
20% down · 8.5% · 30yr
- Down + closing
- —
- Monthly P&I
- —
- Monthly cashflow
- —
- DSCR
- —
- Eligible?
- —
No personal income docs; deal must DSCR.
Hard money
10% down · 12.0% · 12mo
- Down + closing
- —
- Monthly P&I
- —
- Monthly cashflow
- —
- DSCR
- —
- Eligible?
- —
Short-term bridge; refi at stabilization.
Rent comps 2 comps
| Address | Beds | Baths | Sqft | Rent | $/sqft | DOM | Units | Dist |
|---|---|---|---|---|---|---|---|---|
| 12277 State Highway 155 Tyler, TX | 3.0–4.0 | 2.0 | 1392 | $1,399 | $1.01 | 15d | 5 | 0.01mi |
| 12336 Chapman Rd Tyler, TX | 3.0 | 1.5 | 1395 | $1,425 | $1.02 | 22d | 1 | 0.83mi |
Listing history 17 events
-
2026-06-22days on market $84,399 Active 299 DOM
-
2026-06-19days on market $84,399 Active 297 DOM
-
2026-06-18days on market $84,399 Active 296 DOM
-
2026-06-17days on market $84,399 Active 295 DOM
-
2026-06-16days on market $84,399 Active 294 DOM
-
2026-06-15days on market $84,399 Active 293 DOM
-
2026-06-14days on market $84,399 Active 291 DOM
-
2026-06-13days on market $84,399 Active 290 DOM
-
2026-06-10days on market $84,399 Active 288 DOM
-
2026-06-09days on market $84,399 Active 287 DOM
-
2026-06-08days on market $84,399 Active 286 DOM
-
2026-06-07days on market $84,399 Active 285 DOM
-
2026-06-02days on market $84,399 Active 280 DOM
-
2026-06-01days on market $84,399 Active 279 DOM
-
2026-05-31days on market $84,399 Active 278 DOM
-
2026-05-30days on market $84,399 Active 277 DOM
-
2025-08-27$84,399 Active 518-char remark
Show marketing remark (518 chars)
Tour a home in our community on your own time, without an agent, using our self guided tours! Tours available 7 days a week from 6am-9pm, just book a time slot and see it for yourself. Go to our website, navigate to our Fannin Meadows community page and look for the UTour button on the side of the page! ------------------------------------- The Clayton Marvel 4 is skillfully and economically designed double section with large living room, fully equipped kitchen, large bedrooms and beautiful comforting bathrooms.
ⓘ Source: listings_history table (triggers on properties + properties_extension) + one-shot
backfill from property_details.listing_events for pre-trigger history.
Climate risk First Street
- Flood 1/10 Low FEMA zone X (unshaded) · 0% chance over 30 yrs
- Wildfire 3/10 Moderate
- Heat 6/10 Major 7 d/yr ≥109°F today · 23 d/yr by 30 yrs out
- Wind 6/10 Major 55% chance of damaging wind over 30 yrs
- Air quality 2/10 Low 0 unhealthy d/yr today · 1 by 30 yrs out
Nearby sold comps map
Loading sold comps map…
Walkable amenities ~0.75 mi
Loading nearby amenities…
Taxation est. · year 1
- Rental income
- $16,822
- − Mortgage interest
- −$4,728
- − Property taxes
- −$1,266
- − Insurance
- −$422
- − Repairs & maintenance
- −$1,346
- − Management
- −$1,346
- − Depreciation
- −$2,455
- Taxable income
- $5,259
- Est. tax owed @ 24.0%
- −$1,262
- After-tax cash flow
- $5,028/yr
For passive investors: Depreciation is non-cash, so a rental often shows a tax loss while cash-flowing — sheltering income. Rental losses are passive: they offset passive income freely, and up to $25,000/yr can offset ordinary (W-2) income if you actively participate and your MAGI is under $100k (phasing out to $0 by $150k); unused losses carry forward. On sale, claimed depreciation is recaptured at up to 25%, and gains may owe capital-gains tax (a 1031 exchange can defer both). Figures are a year-1 estimate at your 24.0% rate — not tax advice; consult a CPA.
Condition & rehab AI · 6 photos
This Clayton Marvel 4 manufactured home is in excellent condition with a good condition score of 80. It has a modern kitchen, well-maintained bathrooms, and a clean exterior. The home is move-in ready and has a good curb appeal. The highest-ROI updates would be painting the exterior and interior walls, landscaping improvements, adding a small front porch or patio, upgrading the kitchen appliances, and adding a smart home system.
Value-add opportunities
- Both Painting the exterior and interior walls — Fresh paint can enhance the curb appeal and interior aesthetics.
- Both Landscaping improvements — Enhanced landscaping can improve the home's curb appeal and attract more potential buyers/tenants.
- Both Adding a small front porch or patio — This can increase the home's livability and appeal to potential buyers/tenants.
- Both Upgrading the kitchen appliances — Modern appliances can make the kitchen more functional and attractive to potential buyers/tenants.
- Both Adding a smart home system — A smart home system can increase the home's value by making it more energy-efficient and convenient for potential buyers/tenants.
Renovation cost estimate screening
Value-add ROI direction
- Both Painting the exterior and interior walls — Fresh paint can enhance the curb appeal and interior aesthetics. ↑
- Both Landscaping improvements — Enhanced landscaping can improve the home's curb appeal and attract more potential buyers/tenants. ↑
- Both Adding a small front porch or patio — This can increase the home's livability and appeal to potential buyers/tenants. ↑
- Both Upgrading the kitchen appliances — Modern appliances can make the kitchen more functional and attractive to potential buyers/tenants. ↑
- Both Adding a smart home system — A smart home system can increase the home's value by making it more energy-efficient and convenient for potential buyers/tenants. ↑
ⓘ Cost ranges are severity-bucket heuristics (US national rule-of-thumb). Get contractor quotes + a written scope before underwriting a rehab budget.
Schools (NCES district)
- District
- Winona ISD
- NCES district ID
- 4846230
- Math proficiency
- 32% ▲ 2.00%
- Reading proficiency
- 35% ▲ 1.00%
- Median HH income
- $48,761
- Composite
- 28.98/100
- National rank
- #6624
- State rank
- #539 of 826 in TX
Livability — Tyler
- Score
- 75/100
- State rank
- #147
- US rank
- #4181
Category grades
Schools grade is shown separately in the Schools card above.
Census & demographics
- City population
- 127,842
- Population (ZIP)
- 10,001
Population outlook (Smith County) Hauer SSP2
- Today (2025)
- 248,890 people
- By 2030
- 261,665 · +5.1%
- By 2040
- 286,114 · +15.0%
- By 2050
- 308,006 · +23.8%
- By 2075
- 354,171 · +42.3%
- By 2100
- 372,828 · +49.8%
Race, ethnicity, and origin ACS 2023
- Neighborhood character
- Diverse neighborhood (Simpson 0.58)
- Race & ethnicity
- Hispanic / Latino 51% White 39% Two or more races 9% Black 9% Asian 1%
- Hispanic origin (detail)
- Mexican 49%
- Common ancestry
- Danish 1%
- Foreign-born
- 15% · Canada, Vietnam
- Languages at home
- 62% English-only · Spanish 37% Vietnamese 1%
Political lean MEDSL · Smith
- 2024 margin
- Solid R (+45.1) · D 27.0% · R 72.1%
- 2008→2024 swing
- -5.6pp toward R · 2008: -39.5pp · 2024: -45.1pp
- All cycles
- 2024: R+45.1 2020: R+39.4 2016: R+43.9 2012: R+46.9 2008: R+39.5
Not yet ingested
- Civics
- —
Market trends
- HPI YoY
- ▲ 4.96%
- Current HPI
- 216.4494
- Rent YoY
- —
- Metro
- —
- State GDP YoY
- ▲ 3.95%
- F500 in state
- 110
Industry mix (Fortune 500 HQ in TX)
| Industry | F500 HQs | Revenue |
|---|---|---|
| Energy | 16 | $1,198B |
|
||
| Technology | 5 | $198B |
|
||
| Engineering / Construction | 4 | $72B |
|
||
| Energy Services | 3 | $60B |
|
||
| Utilities | 3 | $41B |
|
||
| Healthcare | 2 | $330B |
|
||
Price history
1 event — show timeline
- 2025-08-27 Listed $84,399 Zillow
Cash-flow waterfall
monthlySold comps — $/sqft
last 12 mo · ≤1 miLoading sold comps…