9916 E Gulf TO Lake Hwy · Inverness, FL
Flood risk 1/10 · Minimal
- FEMA flood zone
- X (shaded)
- Chance of flooding over 30 yrs
- 0.0%
- Est. flood insurance / yr
- $507 – $1,088
Fire risk 5/10 · Moderate
- Est. fire insurance / yr
- $947 – $1,759
Heat risk 9/10 · Severe
- Hot days now (above 107°F)
- 7 days/yr
- Hot days in 30 yrs
- 24 days/yr
Wind risk 9/10 · Severe
- Chance of severe wind over 30 yrs
- 99.0%
Air-quality risk 1/10 · Minimal
- Unhealthy air days now
- 0 days/yr
- Unhealthy air days in 30 yrs
- 0 days/yr
Risk factors via First Street. Map © Google.
Why this score? — see what drove the D grade
The composite is a weighted blend of 9 inputs, each scored 0–100. Each bar is that input's sub-score; the figure is the points it added to the 100-point composite (weight × sub-score).
- Cash flow +13.6/30.0
- ARV discount +7.5/15.0
- DSCR +4.1/10.0
- Schools +4.1/10.0
- Livability +3.4/5.0
- 1% rule +2.7/10.0
- Rent growth +2.5/5.0
- Condition / age +2.5/5.0
- Appreciation +0.0/10.0
$149,995
🖨 Deal sheet (PDF) 📄 Offer letter ✓ Due diligence
Listing remarks
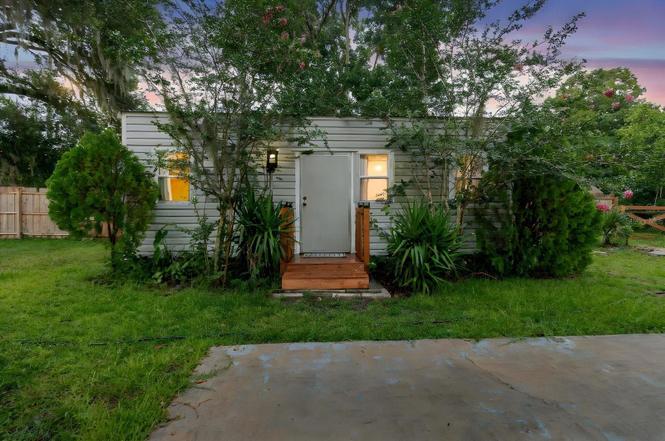
Welcome to this charming, move-in-ready cottage tucked just off E Gulf to Lake Highway, offering an ideal blend of privacy, convenience, and Florida lifestyle living. Surrounded by mature trees and a fully fenced yard, this cozy home sits on a generous lot with room to entertain, garden, or expand. Step inside to an inviting layout featuring warm natural light and comfortable living spaces perfect for a downsizer, or anyone looking for an affordable, centrally located home. Outside, enjoy a spacious lawn, established landscaping, and a beautiful custom wood deck complete with seating—an ideal place for morning coffee, weekend gatherings, or unwinding under the shade of towering oaks.
Key facts
- Custom wood deck
- Move in ready
- Quiet charm
Tags
Property features AI
Finance
- Other: Furnished; Property type: Residential, single family; Zoning: CLRMH
- Financial info: No lease restrictions
- HOA & community: No association
Exterior
- Utilities: Public water; Public sewer; Electricity available
- Home design: Single family residence; One story; East-facing
- Construction: Vinyl siding; Other roof; Slab foundation; Built on a 0.23-acre lot
- Exterior features: Deck; Fire pit; Wood fencing; Lake view; Above-ground private pool
Interior
- Kitchen: Dishwasher; Freezer; Microwave; Range; Refrigerator
- Bedrooms: 1 bedroom
- Flooring: Vinyl
- Bathrooms: 1 full bath; 1 half bath
- Heating & cooling: Propane heating; Wall/window air conditioning unit(s)
- Interior features: Ceiling fans; Solid wood cabinets
- Laundry & utility: Laundry area in kitchen
Neighborhood map
What this means for you Summary
Snapshot
- This is a 1-bed/1.5-bath other listed at $150k.
Deal economics
- At list price, monthly cash flow is $7 ($89/yr) — positive.
- The deal already cash-flows at list — no discount required.
- To meet the 1% rule (rent ≥ 1% of price), the offer needs to be $116k (22.9% below list).
- Recommended offer: $116k (22.9% below list) — sets the bar for 1% rule.
- Cap rate 6.4% vs local median 4.9% in Inverness — meaningfully above typical; check what's discounted (condition, days-on-market, listing class) to confirm the premium yield is real.
Location & tenants
- Location reads 67/100 on livability (#564 in FL) — a middle-class / working-renter tenant base. Strengths: cost of living A+, housing A-; Watch: health & safety C-, amenities F, commute F.
- Citrus (rural): math 49% / reading 50% proficiency, ranked #44 of 73 in FL (top 60%) — families likely to look elsewhere, expect single-tenant / working-renter base with shorter leases.
- Zoned schools: Inverness Primary School (math 54% / reading 55%, grade C, #892 of 2,144 statewide, top 44%, 683 students, 65% FRL); Inverness Middle School (math 52% / reading 48%, grade C, #254 of 571 statewide, top 45%, 1,017 students, 60% FRL); Citrus High School (math 34% / reading 51%, grade F, #264 of 667 statewide, top 41%, 1,503 students, 54% FRL) — zoned schools at 60% FRL track the district average.
- Market conditions: 211 active listings in the ZIP; 2,443 units permitted in Citrus County in 2024 (0 in 5+ unit buildings).
Forward outlook
- Local home prices are declining (-3.0%/yr); year-one equity from $1k of loan paydown is wiped out by about $4k of value loss. Plan a longer hold.
- Citrus County population projected to shrink 10% by 2050 — rents likely to lag national; underwrite the cash flow, not the appreciation.
Negotiation context
- It's been on market 199 days — a 12% lower offer ($132k) is reasonable based on typical stale-listing flexibility.
- Current owner paid $62k; list at $150k implies a 142% gain — meaningful room to come down on a strong offer.
Risks & watch-outs
- Climate carrying-cost: severe wind risk, 99% chance of damaging wind over 30y; moderate wildfire risk; extreme-heat days projected 7→24/yr by 2055 (HVAC capex compounding) — expect insurance premiums to compound above CPI over the hold.
Questions for the listing agent
- It's been on market 199 days. Have you received any prior offers? Is the seller open to a 23% concession, seller financing, or rate buy-down credit?
- Why hasn't it sold? Are there any deal-killer items the seller is aware of (foundation, flood, title, zoning, code violations)?
- Is there a deadline driving the sale (1031 exchange, divorce, estate, relocation)? That informs how much negotiation room exists.
- Schools are B-rated — typically a magnet for longer-tenancy family renters. What's the average tenant stay here, and is there a school-zone premium baked into asking?
- The area grade is low — what's the realistic commute time and amenity access for the typical tenant pool here? Any planned neighborhood developments (good or bad) we should know about?
- What's the average days-on-market for RENTAL listings here right now (not sales)? A rising rental-DOM trend means longer vacancies and softer asking-rent achievability than the comps imply.
- What's the recent tenant-quality profile in this submarket — average credit score on applications, eviction rate, late-payment / NSF rate, and stable-employment percentage? A property-management company in the area should have these aggregated.
- How much new for-sale + rental construction is in the pipeline within 1–3 miles? Heavy new supply typically softens prices + rents 12–24 months out; constrained supply supports both.
Investment metrics
- 1% rule
- 0.77% ✗
- Cap rate
- 6.35%
- Cash-on-cash
- 0.21%
- DSCR
- 1.01
- GRM
- 10.8
CMA / ARV
No comps found within radius.
Projected returns pro-forma
-3.0% appreciation · 3.0% rent growth · sell at horizon
- IRR
- -16.0%
- Equity multiple
- 0.43×
- Total profit
- $-23,896
- Equity at exit
- $22,365
- IRR
- -7.7%
- Equity multiple
- 0.51×
- Total profit
- $-20,453
- Equity at exit
- $12,969
Cash invested: $41,999 (down + closing). Projections, not guarantees.
Landlord ↔ Tenant lean methodology
- Overall (STATE)
- 87 Strongly Landlord-Friendly
- State Florida
- 87 Strongly Landlord-Friendly · R+3
- County
- — inherits STATE
- City
- — inherits STATE
ZIP-level market 34450
- Home prices YoY
- -18.7%
- Active inventory
- 211
- Price-to-rent
- 10.8×
Monthly cashflow live
- Estimated rent
- $1,157 medium interval (Pro) →
- Mortgage (P&I)
- −$787
- Tax from tax record
- −$57 /mo · $689/yr
- Insurance
- −$62
- HOA
- −$0
- Vacancy / Maint / Mgmt
- −$243
- Net cashflow
- $7
Break-even live
Sensitivity live
| Price | -10% $92 | -5% $50 | +0% $7 | +5% $-35 | +10% $-77 |
|---|---|---|---|---|---|
| Rent | -10% $-84 | -5% $-38 | +0% $7 | +5% $53 | +10% $99 |
| Rate | -1.0pp $83 | -0.5pp $46 | base $7 | +0.5pp $-31 | +1.0pp $-71 |
UW: 25.0% down · 7.5% · 30yr · 1.5% tax · 5.0% vac · 8.0% maint · 8.0% mgmt
Financing live
Cash to close
- Down payment
- $37,499
- Closing costs
- $4,500
- Reserves months
- —
- Total cash needed
- —
Loan-product check · same deal, 3 products live
Conventional
25% down · 7.5% · 30yr
- Down + closing
- —
- Monthly P&I
- —
- Monthly cashflow
- —
- DSCR
- —
- Eligible?
- —
Personal DTI + credit; lowest rate.
DSCR
20% down · 8.5% · 30yr
- Down + closing
- —
- Monthly P&I
- —
- Monthly cashflow
- —
- DSCR
- —
- Eligible?
- —
No personal income docs; deal must DSCR.
Hard money
10% down · 12.0% · 12mo
- Down + closing
- —
- Monthly P&I
- —
- Monthly cashflow
- —
- DSCR
- —
- Eligible?
- —
Short-term bridge; refi at stabilization.
Listing history 21 events
-
2026-06-21days on market $149,995 Active 199 DOM
-
2026-06-19days on market $149,995 Active 197 DOM
-
2026-06-18days on market $149,995 Active 196 DOM
-
2026-06-17days on market $149,995 Active 195 DOM
-
2026-06-16days on market $149,995 Active 194 DOM
-
2026-06-15days on market $149,995 Active 193 DOM
-
2026-06-14days on market $149,995 Active 191 DOM
-
2026-06-13pricedays on market $149,995 Active 190 DOM
-
2026-06-09days on market $169,995 Active 187 DOM
-
2026-06-08days on market $169,995 Active 186 DOM
-
2026-06-03days on market $169,995 Active 181 DOM
-
2026-06-02days on market $169,995 Active 180 DOM
-
2026-06-01days on market $169,995 Active 179 DOM
-
2026-05-31days on market $169,995 Active 178 DOM
-
2026-05-30days on market $169,995 Active 177 DOM
-
2025-12-04$169,995 Active
-
2023-04-12soldstatus $62,000
-
1988-12-01soldstatus $29,900
-
1985-11-01soldstatus $25,000
-
1983-08-01soldstatus $23,000
-
1978-01-01soldstatus $18,000
ⓘ Source: listings_history table (triggers on properties + properties_extension) + one-shot
backfill from property_details.listing_events for pre-trigger history.
Tax reassessment forecast FL · Resets to sale price
- Current annual tax
- $689 · $57/mo
- Projected year-2 tax
- $1,245 · $104/mo
- Expected delta
- +$556/yr (+$46/mo · 80.6%)
ⓘ Screening estimate from a state-policy table — verify with the county assessor before closing.
Climate risk First Street
- Flood 1/10 Low FEMA zone X (shaded) · 0% chance over 30 yrs
- Wildfire 5/10 Major
- Heat 9/10 Extreme 7 d/yr ≥107°F today · 24 d/yr by 30 yrs out
- Wind 9/10 Extreme 99% chance of damaging wind over 30 yrs
- Air quality 1/10 Low 0 unhealthy d/yr today · 0 by 30 yrs out
Nearby sold comps map
Loading sold comps map…
Walkable amenities ~0.75 mi
Loading nearby amenities…
Taxation est. · year 1
- Rental income
- $13,883
- − Mortgage interest
- −$8,402
- − Property taxes
- −$689
- − Insurance
- −$750
- − Repairs & maintenance
- −$1,111
- − Management
- −$1,111
- − Depreciation
- −$4,363
- Taxable loss
- −$2,543
- Est. tax savings @ 24.0%
- +$610
- After-tax cash flow
- $699/yr
For passive investors: Depreciation is non-cash, so a rental often shows a tax loss while cash-flowing — sheltering income. Rental losses are passive: they offset passive income freely, and up to $25,000/yr can offset ordinary (W-2) income if you actively participate and your MAGI is under $100k (phasing out to $0 by $150k); unused losses carry forward. On sale, claimed depreciation is recaptured at up to 25%, and gains may owe capital-gains tax (a 1031 exchange can defer both). Figures are a year-1 estimate at your 24.0% rate — not tax advice; consult a CPA.
Schools (NCES district)
- District
- Citrus
- NCES district ID
- 1200270
- Math proficiency
- 49% ▼ -10.00%
- Reading proficiency
- 50% ▼ -6.00%
- Median HH income
- $38,618
- Composite
- 41.28/100
- National rank
- #3519
- State rank
- #44 of 73 in FL
Livability — Inverness
- Score
- 67/100
- State rank
- #564
- US rank
- #10791
Category grades
Schools grade is shown separately in the Schools card above.
Census & demographics
- City population
- 10,621
- Population (ZIP)
- 10,408
Population outlook (Citrus County) Hauer SSP2
- Today (2025)
- 138,622 people
- By 2030
- 136,886 · -1.3%
- By 2040
- 132,009 · -4.8%
- By 2050
- 125,196 · -9.7%
- By 2075
- 108,570 · -21.7%
- By 2100
- 84,454 · -39.1%
Race, ethnicity, and origin ACS 2023
- Neighborhood character
- Predominantly White (81%)
- Race & ethnicity
- White 81% Two or more races 10% Hispanic / Latino 8% Asian 3% Black 1%
- Hispanic origin (detail)
- Mexican 3% Puerto Rican 3%
- Common ancestry
- Romanian 4% Slovak 3% Lithuanian 2%
- Foreign-born
- 8% · Canada
- Languages at home
- 90% English-only · Spanish 4% Other Indo-European 3% Tagalog/Filipino 1%
Political lean MEDSL · Citrus
- 2024 margin
- Solid R (+45.9) · D 26.8% · R 72.6%
- 2008→2024 swing
- -29.8pp toward R · 2008: -16.1pp · 2024: -45.9pp
- All cycles
- 2024: R+45.9 2020: R+41.0 2016: R+39.7 2012: R+21.9 2008: R+16.1
Not yet ingested
- Civics
- —
Market trends
- HPI YoY
- ▼ -72.56%
- Current HPI
- 315.9725
- Rent YoY
- —
- Metro
- —
- State GDP YoY
- ▲ 3.28%
- F500 in state
- 36
Industry mix (Fortune 500 HQ in FL)
| Industry | F500 HQs | Revenue |
|---|---|---|
| Industrial Technology | 2 | $29B |
|
||
| Insurance | 2 | $17B |
|
||
| Retail | 1 | $60B |
|
||
| Technology Distribution | 1 | $58B |
|
||
| Homebuilding | 1 | $35B |
|
||
| Technology Manufacturing | 1 | $35B |
|
||
Price history
+844.4% since first listed6 events — show timeline
- 2025-12-04 Listed $169,995 Stellar MLS as Distributed by MLS Grid
- 2023-04-12 Sold (Public Records) $62,000 Public Records
- 1988-12-01 Sold (Public Records) $29,900 Public Records
- 1985-11-01 Sold (Public Records) $25,000 Public Records
- 1983-08-01 Sold (Public Records) $23,000 Public Records
- 1978-01-01 Sold (Public Records) $18,000 Public Records
Property tax history
+10.2%/yrLatest (2025): $689 · +3.6% YoY. Source: county tax records.
Cash-flow waterfall
monthlySold comps — $/sqft
last 12 mo · ≤1 miLoading sold comps…