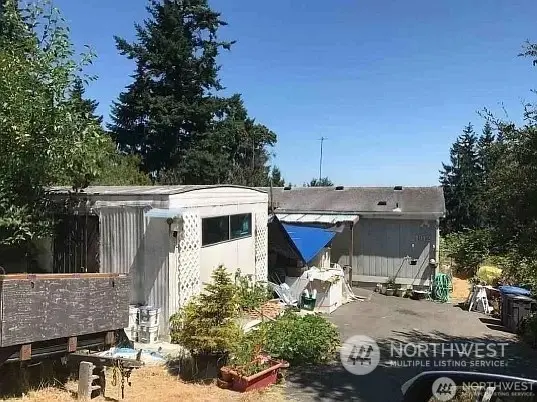
1912 1st Ave W · Navy Yard City, WA
Flood risk 1/10 · Minimal
- FEMA flood zone
- X (unshaded)
- Chance of flooding over 30 yrs
- 0.0%
- Est. flood insurance / yr
- $507 – $1,088
Fire risk 1/10 · Minimal
- Est. fire insurance / yr
- $604 – $1,122
Heat risk 3/10 · Minor
- Hot days now (above 86°F)
- 7 days/yr
- Hot days in 30 yrs
- 14 days/yr
Wind risk 1/10 · Minimal
- Chance of severe wind over 30 yrs
- —
Air-quality risk 6/10 · Moderate
- Unhealthy air days now
- 8 days/yr
- Unhealthy air days in 30 yrs
- 8 days/yr
Risk factors via First Street. Map © Google.
Why this score? — see what drove the B grade
The composite is a weighted blend of 9 inputs, each scored 0–100. Each bar is that input's sub-score; the figure is the points it added to the 100-point composite (weight × sub-score).
- Cash flow +28.0/30.0
- ARV discount +15.0/15.0
- DSCR +9.9/10.0
- 1% rule +7.2/10.0
- Livability +4.0/5.0
- Schools +3.9/10.0
- Rent growth +2.6/5.0
- Condition / age +2.5/5.0
- Appreciation +0.0/10.0
$227,700
🖨 Deal sheet 📄 Offer letter ✓ Due diligence
Listing remarks
Interior inspections are not available, do not trespass. NO REPRESENTATION TO VALIDITY OF INFORMATION IS MADE, BUYER TO VERIFY ALL INFORMATION WHERIN.
Key facts
- 0.27 acre lot
- Built 1990
- Listed 625 days
Neighborhood map
What this means for you Summary
Snapshot
- This is a 3-bed/2.0-bath manufactured listed at $228k.
Deal economics
- At list price, monthly cash flow is $706 ($8k/yr) — positive.
- The deal already cash-flows at list — no discount required.
- Meets the 1% rule at list price ($3k rent vs $228k).
- Recommended offer: $200k (12.0% below list) — sets the bar for market timing.
Location & tenants
- Location reads 80/100 on livability (#89 in WA, #1,764 nationally) — a professional / high-income tenant draw. Strengths: housing A+, health & safety A+, crime A-; Watch: amenities D, commute F.
- Bremerton School District (urban): math 36% / reading 51% proficiency, ranked #194 of 291 in WA (top 67%) — families likely to look elsewhere, expect single-tenant / working-renter base with shorter leases.
- Market conditions: Rents flat; 349 active listings in the ZIP; 14 comparable units currently listed for rent nearby; rentals at typical pace (median 21d on market — plan ~3-4 weeks tenant-placement turnaround); 43% of comp listings sitting > 30 days — soft ceiling on asking rent; solid renter incomes; 1,294 units permitted in Kitsap County in 2024 (302 in 5+ unit buildings).
- This rent runs 37% of the median local income ($90k/yr) — at the standard rent-burdened threshold; future hikes will face affordability resistance.
Forward outlook
- Local home prices are declining (-3.0%/yr); year-one equity from $2k of loan paydown is wiped out by about $7k of value loss. Plan a longer hold.
- Kitsap County population projected at +8% by 2050 — modest demand growth; plan on rents tracking national, not racing it.
Negotiation context
- It's been on market 625 days — a 12% lower offer ($200k) is reasonable based on typical stale-listing flexibility.
Questions for the listing agent
- It's been on market 625 days. Have you received any prior offers? Is the seller open to a 12% concession, seller financing, or rate buy-down credit?
- Why hasn't it sold? Are there any deal-killer items the seller is aware of (foundation, flood, title, zoning, code violations)?
- Is there a deadline driving the sale (1031 exchange, divorce, estate, relocation)? That informs how much negotiation room exists.
- Schools are B-rated — typically a magnet for longer-tenancy family renters. What's the average tenant stay here, and is there a school-zone premium baked into asking?
- What's the average days-on-market for RENTAL listings here right now (not sales)? A rising rental-DOM trend means longer vacancies and softer asking-rent achievability than the comps imply.
- What's the recent tenant-quality profile in this submarket — average credit score on applications, eviction rate, late-payment / NSF rate, and stable-employment percentage? A property-management company in the area should have these aggregated.
- How much new for-sale + rental construction is in the pipeline within 1–3 miles? Heavy new supply typically softens prices + rents 12–24 months out; constrained supply supports both.
Investment metrics
- 1% rule
- 1.22% ✓
- Cap rate
- 10.01%
- Cash-on-cash
- 13.28%
- DSCR
- 1.59
- GRM
- 6.9
CMA / ARV
- ARV (median comp)
- $400,000
- List price
- $227,700
- Delta
- -43.08%
- Verdict
- UNDERPRICED
- Comps
- 3 within 1.0 mi
Show comp detail 1 sale within ~0.75 mi
| Address | Dist | Beds/Ba | Sqft | Sold | Price | $/sf | Match |
|---|---|---|---|---|---|---|---|
| 2003 2nd Ave W | 0.11mi | 2/2.0 (-1) | 1,638 (-8%) | 10mo | $250,000 | $153 | 68 |
Match score weights: distance 35% · size 25% · config 20% · recency 20%. Top-matched comps best support the ARV.
Projected returns pro-forma
-3.0% appreciation · 0.28% rent growth · sell at horizon
- IRR
- 0.3%
- Equity multiple
- 1.01×
- Total profit
- $665
- Equity at exit
- $33,951
- IRR
- 7.0%
- Equity multiple
- 1.47×
- Total profit
- $29,740
- Equity at exit
- $19,687
Cash invested: $63,756 (down + closing). Projections, not guarantees.
Landlord ↔ Tenant lean methodology
- Overall (STATE)
- 28 Tenant-Leaning
- State Washington
- 28 Tenant-Leaning · D+8
- County
- — inherits STATE
- City
- — inherits STATE
ZIP-level market 98312
- Rents YoY
- 0.3%
- Active inventory
- 349
- Price-to-rent
- 6.9×
Monthly cashflow live
- Estimated rent
- $2,768 high interval (Pro) →
- Mortgage (P&I)
- −$1,194
- Tax from tax record
- −$192 /mo · $2,305/yr
- Insurance
- −$95
- HOA
- −$0
- Vacancy / Maint / Mgmt
- −$581
- Net cashflow
- $706
Break-even live
UW: 25.0% down · 7.5% · 30yr · 1.5% tax · 5.0% vac · 8.0% maint · 8.0% mgmt
Financing live
Cash to close
- Down payment
- $56,925
- Closing costs
- $6,831
- Reserves months
- —
- Total cash needed
- —
Loan-product check · same deal, 3 products live
Conventional
25% down · 7.5% · 30yr
- Down + closing
- —
- Monthly P&I
- —
- Monthly cashflow
- —
- DSCR
- —
- Eligible?
- —
Personal DTI + credit; lowest rate.
DSCR
20% down · 8.5% · 30yr
- Down + closing
- —
- Monthly P&I
- —
- Monthly cashflow
- —
- DSCR
- —
- Eligible?
- —
No personal income docs; deal must DSCR.
Hard money
10% down · 12.0% · 12mo
- Down + closing
- —
- Monthly P&I
- —
- Monthly cashflow
- —
- DSCR
- —
- Eligible?
- —
Short-term bridge; refi at stabilization.
Rent comps 14 comps
| Address | Beds | Baths | Sqft | Rent | $/sqft | DOM | Units | Dist |
|---|---|---|---|---|---|---|---|---|
| 5091 Granger St Bremerton, WA | 4.0 | 2.5 | 2047 | $3,000 | $1.47 | 43d | 1 | 0.29mi |
| 5050 Granger St Bremerton, WA | 3.0 | 2.5 | 1886 | $3,100 | $1.64 | 21d | 1 | 0.31mi |
| 1212 Evans Ave W Bremerton, WA | 3.0 | 1.5 | 1856 | $2,600 | $1.40 | 43d | 1 | 0.53mi |
| 4114 McCall Blvd W Bremerton, WA | 3.0 | 2.0 | 1800 | $2,500 | $1.39 | 13d | 1 | 0.54mi |
| 1216 Humphrey Ave W Bremerton, WA | 3.0 | 2.5 | 1800 | $2,799 | $1.55 | 43d | 1 | 0.57mi |
| 3181 Sand Dollar Rd W Bremerton, WA | 3.0 | 2.0 | 1974 | $2,300 | $1.17 | 21d | 1 | 1.00mi |
| 947 Baker Heights Loop Bremerton, WA | 4.0 | 2.0 | 2311 | $3,500 | $1.51 | 21d | 1 | 1.17mi |
| 1029 Panoramic Loop Bremerton, WA | 4.0 | 2.5 | 2501 | $3,300 | $1.32 | 43d | 1 | 1.20mi |
| 913 Timberline Ave Bremerton, WA | 4.0 | 3.0 | 2501 | $3,300 | $1.32 | 43d | 1 | 1.26mi |
| 4535 Sand Dollar St Bremerton, WA | 3.0 | 2.0 | 1319 | $2,600 | $1.97 | 21d | 1 | 1.29mi |
| 3202 Farragut Ave Unit 2 Bremerton, WA | 3.0 | 2.0 | 1226 | $2,450 | $2.00 | 21d | 1 | 1.29mi |
| 3202 Farragut Ave Unit 2 Bremerton, WA | 3.0 | 2.0 | 1226 | $2,450 | $2.00 | 43d | 1 | 1.29mi |
| 317 S Hartford Ave Bremerton, WA | 2.0 | 1.0 | 1333 | $1,900 | $1.43 | 13d | 1 | 1.31mi |
| 4520 Bay Vista Blvd Bremerton, WA | 1.0–3.0 | 1.0–2.0 | 927 | $2,875 | $3.10 | 13d | 9 | 1.41mi |
Listing history 18 events
-
2026-06-18days on market $227,700 Active 625 DOM
-
2026-06-17days on market $227,700 Active 624 DOM
-
2026-06-16days on market $227,700 Active 623 DOM
-
2026-06-15days on market $227,700 Active 622 DOM
-
2026-06-14days on market $227,700 Active 620 DOM
-
2026-06-13days on market $227,700 Active 619 DOM
-
2026-06-10days on market $227,700 Active 617 DOM
-
2026-06-09days on market $227,700 Active 616 DOM
-
2026-06-08days on market $227,700 Active 615 DOM
-
2026-06-07days on market $227,700 Active 614 DOM
-
2026-06-02days on market $227,700 Active 609 DOM
-
2026-06-01days on market $227,700 Active 608 DOM
-
2026-05-31days on market $227,700 Active 607 DOM
-
2026-05-30days on market $227,700 Active 606 DOM
-
2026-05-05price $227,700
-
2026-04-16price $338,100
-
2026-04-16price $178,860
-
2024-10-01$338,100 Active
ⓘ Source: listings_history table (triggers on properties + properties_extension) + one-shot
backfill from property_details.listing_events for pre-trigger history.
Tax reassessment forecast WA · Resets to sale price
- Current annual tax
- $2,305 · $192/mo
- Projected year-2 tax
- $2,305 · $192/mo
- Expected delta
- $0/yr ($0/mo · 0.0%)
ⓘ Screening estimate from a state-policy table — verify with the county assessor before closing.
Climate risk First Street
- Flood 1/10 Low FEMA zone X (unshaded) · 0% chance over 30 yrs
- Wildfire 1/10 Low
- Heat 3/10 Moderate 7 d/yr ≥86°F today · 14 d/yr by 30 yrs out
- Wind 1/10 Low
- Air quality 6/10 Major 8 unhealthy d/yr today · 8 by 30 yrs out
Nearby sold comps map
Loading sold comps map…
Walkable amenities ~0.75 mi
Loading nearby amenities…
Taxation est. · year 1
- Rental income
- $33,218
- − Mortgage interest
- −$12,755
- − Property taxes
- −$2,305
- − Insurance
- −$1,138
- − Repairs & maintenance
- −$2,657
- − Management
- −$2,657
- − Depreciation
- −$6,624
- Taxable income
- $5,081
- Est. tax owed @ 24.0%
- −$1,219
- After-tax cash flow
- $7,250/yr
For passive investors: Depreciation is non-cash, so a rental often shows a tax loss while cash-flowing — sheltering income. Rental losses are passive: they offset passive income freely, and up to $25,000/yr can offset ordinary (W-2) income if you actively participate and your MAGI is under $100k (phasing out to $0 by $150k); unused losses carry forward. On sale, claimed depreciation is recaptured at up to 25%, and gains may owe capital-gains tax (a 1031 exchange can defer both). Figures are a year-1 estimate at your 24.0% rate — not tax advice; consult a CPA.
Schools (NCES district)
- District
- Bremerton School District
- NCES district ID
- 5300660
- Math proficiency
- 36% ▼ -3.00%
- Reading proficiency
- 51% ▲ 1.00%
- Median HH income
- $46,765
- Composite
- 39.34/100
- National rank
- #8163
- State rank
- #194 of 291 in WA
Livability — Navy Yard City
- Score
- 80/100
- State rank
- #89
- US rank
- #1764
Category grades
Schools grade is shown separately in the Schools card above.
Census & demographics
- Census place
- Navy Yard City, WA
- County
- Kitsap County · 243,099 people
- Metro
- Bremerton-Silverdale-Port Orchard, WA
- Population (ZIP)
- 36,307
- Household income
- $90,449
- Rent vs Own
- Severe rent burden
- 993.0
Population outlook (Kitsap County) Hauer SSP2
- Today (2025)
- 277,525 people
- By 2030
- 285,040 · +2.7%
- By 2040
- 294,957 · +6.3%
- By 2050
- 300,622 · +8.3%
- By 2075
- 315,580 · +13.7%
- By 2100
- 304,340 · +9.7%
Race, ethnicity, and origin ACS 2023
- Neighborhood character
- Predominantly White (68%)
- Race & ethnicity
- White 68% Two or more races 13% Hispanic / Latino 12% Asian 4% Black 4% Native American 1%
- Hispanic origin (detail)
- Mexican 6% Puerto Rican 1%
- Common ancestry
- Italian 7% Portuguese 5% Slovak 4%
- Foreign-born
- 6% · Canada, China
- Languages at home
- 91% English-only · Spanish 4% Tagalog/Filipino 2% Other Asian/Pacific 1%
Political lean MEDSL · Kitsap
- 2024 margin
- Strong D (+20.9) · D 58.8% · R 37.9% · Other 3.3%
- 2008→2024 swing
- +8.6pp toward D · 2008: 12.3pp · 2024: 20.9pp
- All cycles
- 2024: D+20.9 2020: D+18.1 2016: D+11.6 2012: D+11.1 2008: D+12.3
Not yet ingested
- Civics
- —
Market trends
- HPI YoY
- ▼ -436.68%
- Current HPI
- 379.2342
- Rent YoY
- ▲ 0.28%
- Metro
- Bremerton-Silverdale-Port Orchard, WA
- State GDP YoY
- ▲ 4.65%
- F500 in state
- 22
Industry mix (Fortune 500 HQ in WA)
| Industry | F500 HQs | Revenue |
|---|---|---|
| Retail | 2 | $269B |
|
||
| Technology / Retail | 1 | $638B |
|
||
| Technology | 1 | $245B |
|
||
| Telecommunications | 1 | $38B |
|
||
| Food / Beverage | 1 | $36B |
|
||
| Automotive / Trucks | 1 | $34B |
|
||
Price history
-32.7% since first listed4 events — show timeline
- 2026-05-05 Price Changed $227,700 NWMLS as Distributed by MLS Grid
- 2026-04-16 Price Changed $338,100 NWMLS as Distributed by MLS Grid
- 2026-04-16 Price Changed $178,860 NWMLS as Distributed by MLS Grid
- 2024-10-01 Listed $338,100 NWMLS as Distributed by MLS Grid
Property tax history
+2.0%/yrLatest (2026): $2,305 · +1.2% YoY. Source: county tax records.
Cash-flow waterfall
monthlySold comps — $/sqft
last 12 mo · ≤1 miLoading sold comps…