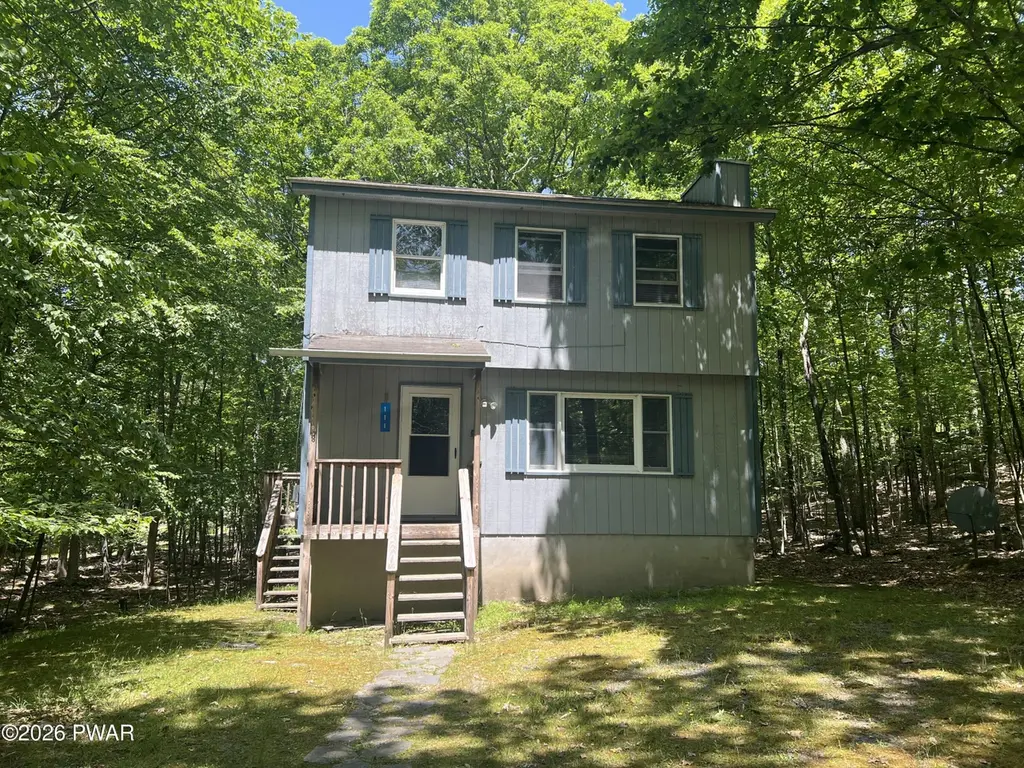
111 Rays Pl · Pocono Ranch Lands, PA
Flood risk 1/10 · Minimal
- FEMA flood zone
- X (unshaded)
- Chance of flooding over 30 yrs
- 0.0%
- Est. flood insurance / yr
- $473 – $860
Fire risk 5/10 · Moderate
- Est. fire insurance / yr
- $511 – $949
Heat risk 3/10 · Minor
- Hot days now (above 95°F)
- 7 days/yr
- Hot days in 30 yrs
- 15 days/yr
Wind risk 4/10 · Minor
- Chance of severe wind over 30 yrs
- 8.0%
Air-quality risk 2/10 · Minimal
- Unhealthy air days now
- 1 days/yr
- Unhealthy air days in 30 yrs
- 2 days/yr
Risk factors via First Street. Map © Google.
Why this score? — see what drove the C- grade
The composite is a weighted blend of 9 inputs, each scored 0–100. Each bar is that input's sub-score; the figure is the points it added to the 100-point composite (weight × sub-score).
- Cash flow +12.0/30.0
- ARV discount +10.0/15.0
- Appreciation +10.0/10.0
- Schools +4.7/10.0
- 1% rule +3.7/10.0
- DSCR +3.5/10.0
- Livability +3.3/5.0
- Rent growth +2.5/5.0
- Condition / age +2.5/5.0
$215,000
🖨 Deal sheet 📄 Offer letter ✓ Due diligence
Listing remarks
Tucked away in Pocono Mountain Lake Estates, this charming 2-bedroom, 1.5-bath home offers the privacy and tranquility you've been looking for. Set back from the main road and the only home on the street, you'll enjoy a peaceful setting surrounded by nature. Relax or entertain on the large rear deck overlooking the wooded surroundings. Inside, the cozy living area features a propane fireplace, perfect for chilly Pocono evenings. The full unfinished basement provides ample storage space and endless possibilities for future finishing. Whether you're looking for a full-time residence, or weekend getaway, this home offers a quiet retreat while still being close to all the amenities Pocono Mount
Key facts
- Propane fireplace
- Peaceful setting
- Large rear deck
Tags
Property features AI
Finance
- Other: Lot approximately 1.16 acres
- HOA & community: Homeowners association with an annual fee of $597 (about $49.75/month)
Exterior
- Parking: Off-street parking
- Utilities: Septic tank
- Home design: Single family residence; Two levels; Residential property in Pocono Mt Lake Estates; Located on a private road (only house on the road)
- Construction: Asphalt roof
- Exterior features: Deck
Interior
- Kitchen: Microwave; Refrigerator; Electric oven
- Flooring: Carpet; Linoleum
- Bathrooms: 1 full bathroom; 1 half bathroom
- Heating & cooling: Electric heating; Ceiling fan(s) for cooling
- Interior features: Living room propane fireplace; Unfinished basement; 5 total rooms
- Laundry & utility: Washer and dryer; Water heater; Laundry in basement
Neighborhood map
What this means for you Summary
Snapshot
- This is a 2-bed/1.5-bath single-family listed at $215k.
Deal economics
- At list price, monthly cash flow is $-52 ($-630/yr) — negative.
- To cash-flow at today's rent, offer at most $206k (4.3% below list).
- To meet the 1% rule (rent ≥ 1% of price), the offer needs to be $187k (13.1% below list).
- Recommended offer: $187k (13.1% below list) — sets the bar for 1% rule.
- Cap rate 6.0% vs local median 4.4% in Pocono Ranch Lands — top-decile yield for the area; either an underpriced asset or a hidden risk that comps aren't pricing in. Stress-test before assuming the spread holds.
Location & tenants
- Location reads 66/100 on livability (#1,037 in PA) — a middle-class / working-renter tenant base. Strengths: crime A+, cost of living A+, housing A; Watch: employment D, health & safety D, schools F.
- Delaware Valley SD (rural): math 41% / reading 66% proficiency, ranked #121 of 539 in PA (top 22%) — acceptable for families but not a draw, mixed tenant base, ~2y average lease.
- Market conditions: 211 active listings in the ZIP; 213 units permitted in Pike County in 2024 (0 in 5+ unit buildings).
Forward outlook
- In year one you build about $23k of equity ($1k loan paydown + $22k appreciation (10.0% local appreciation)).
- Pike County population projected at -25% by 2050 — secular population decline; favor cash flow + early exit over multi-decade hold.
- At projected returns (10.0% appreciation + 3.0% rent growth), your $60k cash investment doubles in ~3 years — after that, you're playing with house money.
- By year 2, paydown + projected appreciation supports a ~$37k cash-out refi (75% LTV) — recoverable capital for the next deal without selling this one.
Negotiation context
- Only 13 days on market — expect competitive offers; lowballing is unlikely to land.
- Current owner paid $60k; list at $215k implies a 259% gain — meaningful room to come down on a strong offer.
Risks & watch-outs
- Climate carrying-cost: moderate wildfire risk — expect insurance premiums to compound above CPI over the hold.
Questions for the listing agent
- What do current leases actually rent for vs. the listed asking? Can we see a recent rent roll and the last 12 months of T-12 income?
- What does the HOA fee cover, when was the last increase, and are there any pending special assessments or reserve-fund shortfalls?
- Is there a deadline driving the sale (1031 exchange, divorce, estate, relocation)? That informs how much negotiation room exists.
- Schools are F-rated, which usually means shorter tenancies and higher turnover. Who's the typical renter profile here, and what's been the actual vacancy rate?
- What's the average days-on-market for RENTAL listings here right now (not sales)? A rising rental-DOM trend means longer vacancies and softer asking-rent achievability than the comps imply.
- What's the recent tenant-quality profile in this submarket — average credit score on applications, eviction rate, late-payment / NSF rate, and stable-employment percentage? A property-management company in the area should have these aggregated.
- How much new for-sale + rental construction is in the pipeline within 1–3 miles? Heavy new supply typically softens prices + rents 12–24 months out; constrained supply supports both.
Investment metrics
- 1% rule
- 0.87% ✗
- Cap rate
- 6.00%
- Cash-on-cash
- -1.05%
- DSCR
- 0.95
- GRM
- 9.6
CMA / ARV
- ARV (on-the-fly)
- $227,520
- Comps found
- 11
Show comp detail 11 sales within ~0.75 mi
| Address | Dist | Beds/Ba | Sqft | Sold | Price | $/sf | Match |
|---|---|---|---|---|---|---|---|
| 102 Sandstone Dr | 0.35mi | 3/2.0 (+1) | 1,150 (-9%) | 1mo | $305,000 | $265 | 61 |
| 106 Keystone Ct | 0.50mi | 3/2.5 (+1) | 1,344 (+6%) | 0mo | $238,000 | $177 | 57 |
| 134 Lakeview Dr | 0.42mi | 3/1.0 (+1) | 1,148 (-9%) | 2mo | $140,000 | $122 | 57 |
| 102 Mink Rd | 0.53mi | 2/1.5 | 1,175 (-7%) | 19mo | $250,000 | $213 | 48 |
| 120 Puma Ct | 0.54mi | 3/2.0 (+1) | 1,233 (-2%) | 20mo | $229,000 | $186 | 47 |
| 103 Westfall Dr | 0.54mi | 3/2.0 (+1) | 1,386 (+10%) | 8mo | $247,200 | $178 | 45 |
| 269 High Ridge Rd | 0.70mi | 2/1.0 | 1,344 (+6%) | 13mo | $229,000 | $170 | 44 |
| 117 Westwood Cir | 0.62mi | 2/2.0 | 1,176 (-7%) | 18mo | $199,000 | $169 | 42 |
| 259 Wild Acres Dr | 0.69mi | 3/2.0 (+1) | 1,364 (+8%) | 8mo | $245,000 | $180 | 41 |
| 125 Lakeview Dr | 0.49mi | 3/1.0 (+1) | 1,121 (-11%) | 13mo | $225,000 | $201 | 40 |
| 109 Westwood Cir | 0.63mi | 2/1.0 | 1,128 (-11%) | 18mo | $238,000 | $211 | 35 |
Match score weights: distance 35% · size 25% · config 20% · recency 20%. Top-matched comps best support the ARV.
Projected returns pro-forma
10.0% appreciation · 3.0% rent growth · sell at horizon
- IRR
- 23.5%
- Equity multiple
- 2.89×
- Total profit
- $113,806
- Equity at exit
- $193,689
- IRR
- 20.9%
- Equity multiple
- 6.61×
- Total profit
- $337,877
- Equity at exit
- $417,698
Cash invested: $60,200 (down + closing). Projections, not guarantees.
Landlord ↔ Tenant lean methodology
- Overall (STATE)
- 62 Landlord-Friendly
- State Pennsylvania
- 62 Landlord-Friendly · EVEN
- County
- — inherits STATE
- City
- — inherits STATE
ZIP-level market 18328
- Home prices YoY
- 18.1%
- Active inventory
- 211
- Price-to-rent
- 9.6×
Monthly cashflow live
- Estimated rent
- $1,868 medium interval (Pro) →
- Mortgage (P&I)
- −$1,127
- Tax from tax record
- −$261 /mo · $3,135/yr
- Insurance
- −$90
- HOA
- −$50
- Vacancy / Maint / Mgmt
- −$392
- Net cashflow
- $-52
Break-even live
UW: 25.0% down · 7.5% · 30yr · 1.5% tax · 5.0% vac · 8.0% maint · 8.0% mgmt
Financing live
Cash to close
- Down payment
- $53,750
- Closing costs
- $6,450
- Reserves months
- —
- Total cash needed
- —
Loan-product check · same deal, 3 products live
Conventional
25% down · 7.5% · 30yr
- Down + closing
- —
- Monthly P&I
- —
- Monthly cashflow
- —
- DSCR
- —
- Eligible?
- —
Personal DTI + credit; lowest rate.
DSCR
20% down · 8.5% · 30yr
- Down + closing
- —
- Monthly P&I
- —
- Monthly cashflow
- —
- DSCR
- —
- Eligible?
- —
No personal income docs; deal must DSCR.
Hard money
10% down · 12.0% · 12mo
- Down + closing
- —
- Monthly P&I
- —
- Monthly cashflow
- —
- DSCR
- —
- Eligible?
- —
Short-term bridge; refi at stabilization.
HOA detail
- Monthly dues
- $50 · $600/yr
Listing history 10 events
-
2026-06-18days on market $215,000 Active 13 DOM
-
2026-06-17days on market $215,000 Active 12 DOM
-
2026-06-16days on market $215,000 Active 11 DOM
-
2026-06-15days on market $215,000 Active 10 DOM
-
2026-06-13days on market $215,000 Active 8 DOM
-
2026-06-13days on market $215,000 Active 7 DOM
-
2026-06-09days on market $215,000 Active 4 DOM
-
2026-06-08days on market $215,000 Active 3 DOM
-
2026-06-07remarks 699-char remark
-
2026-06-07$215,000 Active 2 DOM
ⓘ Source: listings_history table (triggers on properties + properties_extension) + one-shot
backfill from property_details.listing_events for pre-trigger history.
Tax reassessment forecast PA · Partial reset (capped growth)
- Current annual tax
- $3,135 · $261/mo
- Projected year-2 tax
- $3,266 · $272/mo
- Expected delta
- +$131/yr (+$11/mo · 4.2%)
ⓘ Screening estimate from a state-policy table — verify with the county assessor before closing.
Climate risk First Street
- Flood 1/10 Low FEMA zone X (unshaded) · 0% chance over 30 yrs
- Wildfire 5/10 Major
- Heat 3/10 Moderate 7 d/yr ≥95°F today · 15 d/yr by 30 yrs out
- Wind 4/10 Moderate 8% chance of damaging wind over 30 yrs
- Air quality 2/10 Low 1 unhealthy d/yr today · 2 by 30 yrs out
Nearby sold comps map
Loading sold comps map…
Walkable amenities ~0.75 mi
Loading nearby amenities…
Taxation est. · year 1
- Rental income
- $22,417
- − Mortgage interest
- −$12,043
- − Property taxes
- −$3,135
- − Insurance
- −$1,075
- − Repairs & maintenance
- −$1,793
- − Management
- −$1,793
- − HOA
- −$600
- − Depreciation
- −$6,255
- Taxable loss
- −$4,277
- Est. tax savings @ 24.0%
- +$1,027
- After-tax cash flow
- $397/yr
For passive investors: Depreciation is non-cash, so a rental often shows a tax loss while cash-flowing — sheltering income. Rental losses are passive: they offset passive income freely, and up to $25,000/yr can offset ordinary (W-2) income if you actively participate and your MAGI is under $100k (phasing out to $0 by $150k); unused losses carry forward. On sale, claimed depreciation is recaptured at up to 25%, and gains may owe capital-gains tax (a 1031 exchange can defer both). Figures are a year-1 estimate at your 24.0% rate — not tax advice; consult a CPA.
Schools (NCES district)
- District
- Delaware Valley SD
- NCES district ID
- 4207530
- Math proficiency
- 41% ▼ -12.00%
- Reading proficiency
- 66% ▼ -9.00%
- Median HH income
- $64,202
- Composite
- 46.95/100
- National rank
- #2359
- State rank
- #121 of 539 in PA
Livability — Pocono Ranch Lands
- Score
- 66/100
- State rank
- #1037
- US rank
- #11566
Category grades
Schools grade is shown separately in the Schools card above.
Census & demographics
- Population (ZIP)
- 8,061
Population outlook (Pike County) Hauer SSP2
- Today (2025)
- 53,548 people
- By 2030
- 51,622 · -3.6%
- By 2040
- 46,490 · -13.2%
- By 2050
- 40,372 · -24.6%
- By 2075
- 31,951 · -40.3%
- By 2100
- 26,821 · -49.9%
Race, ethnicity, and origin ACS 2023
- Neighborhood character
- Predominantly White (85%)
- Race & ethnicity
- White 85% Hispanic / Latino 10% Two or more races 8%
- Hispanic origin (detail)
- Puerto Rican 5%
- Common ancestry
- Scotch-Irish 6% Romanian 6% Iranian 4%
- Foreign-born
- 9% · Canada, Jamaica
- Languages at home
- 86% English-only · Spanish 6% Russian/Polish/Slavic 5% Other Indo-European 2%
Political lean MEDSL · Pike
- 2024 margin
- Strong R (+24.1) · D 37.6% · R 61.6%
- 2008→2024 swing
- -19.8pp toward R · 2008: -4.2pp · 2024: -24.1pp
- All cycles
- 2024: R+24.1 2020: R+19.0 2016: R+26.0 2012: R+11.0 2008: R+4.2
Not yet ingested
- Civics
- —
Market trends
- HPI YoY
- ▲ 38.13%
- Current HPI
- 248.4494
- Rent YoY
- —
- Metro
- —
- State GDP YoY
- ▲ 1.68%
- F500 in state
- 34
Industry mix (Fortune 500 HQ in PA)
| Industry | F500 HQs | Revenue |
|---|---|---|
| Healthcare | 2 | $309B |
|
||
| Insurance | 2 | $27B |
|
||
| Telecommunications / Media | 1 | $124B |
|
||
| Industrial Distribution | 1 | $22B |
|
||
| Financial Services | 1 | $20B |
|
||
| Chemicals / Materials | 1 | $18B |
|
||
Price history
+258.9% since first listed2 events — show timeline
- 2026-06-05 Listed $215,000 PWMLS
- 1995-02-06 Sold (Public Records) $59,900 Public Records
Property tax history
+1.7%/yrLatest (2026): $3,135 · +1.5% YoY. Source: county tax records.
Cash-flow waterfall
monthlySold comps — $/sqft
last 12 mo · ≤1 miLoading sold comps…