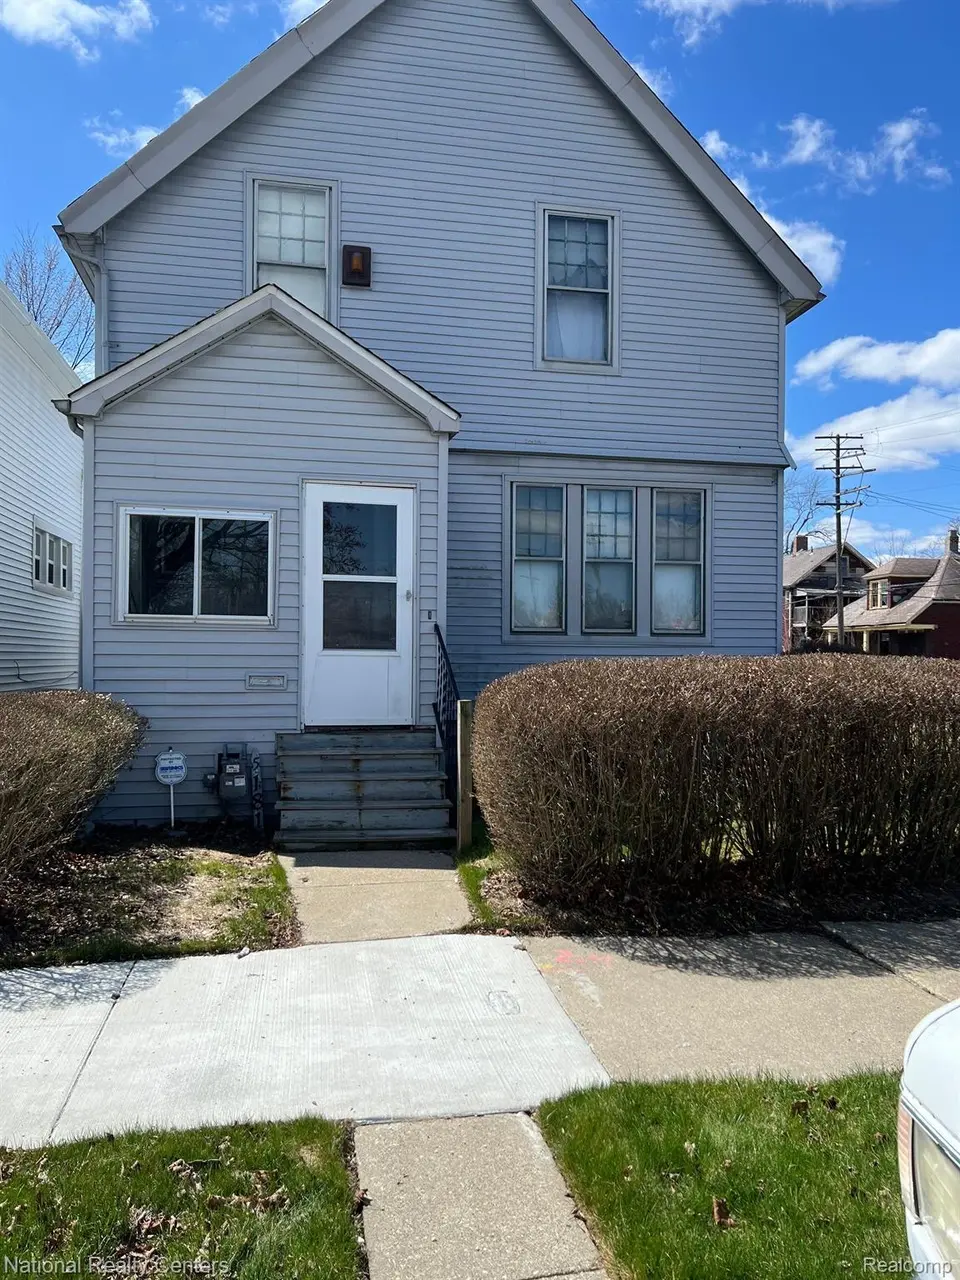
5181 Holcomb St · Detroit, MI
Flood risk 1/10 · Minimal
- FEMA flood zone
- X (unshaded)
- Chance of flooding over 30 yrs
- 0.0%
- Est. flood insurance / yr
- $507 – $1,088
Fire risk 1/10 · Minimal
- Est. fire insurance / yr
- $784 – $1,456
Heat risk 3/10 · Minor
- Hot days now (above 96°F)
- 7 days/yr
- Hot days in 30 yrs
- 15 days/yr
Wind risk 2/10 · Minimal
- Chance of severe wind over 30 yrs
- —
Air-quality risk 3/10 · Minor
- Unhealthy air days now
- 2 days/yr
- Unhealthy air days in 30 yrs
- 5 days/yr
Risk factors via First Street. Map © Google.
Why this score? — see what drove the B grade
The composite is a weighted blend of 9 inputs, each scored 0–100. Each bar is that input's sub-score; the figure is the points it added to the 100-point composite (weight × sub-score).
- Cash flow +30.0/30.0
- ARV discount +15.0/15.0
- 1% rule +10.0/10.0
- DSCR +10.0/10.0
- Livability +3.7/5.0
- Rent growth +2.5/5.0
- Condition / age +2.5/5.0
- Schools +1.3/10.0
- Appreciation +0.0/10.0
$32,000
🖨 Deal sheet 📄 Offer letter ✓ Due diligence
Listing remarks MLS
Offer fell apart, back on the market. This home was once a gem. .. family-owned for over 80 years. The estate to sale has been approved in probate court at the list price. Calling all investors to make this property a gem again. BATVAI
Key facts
- 6,098 sq ft lot
- Built 1913
- Listed 427 days
Neighborhood map
What this means for you Summary
Snapshot
- This is a 3-bed/1.0-bath single-family listed at $32k.
Deal economics
- At list price, monthly cash flow is $786 ($9k/yr) — positive.
- The deal already cash-flows at list — no discount required.
- Meets the 1% rule at list price ($1k rent vs $32k).
- Recommended offer: $28k (12.0% below list) — sets the bar for market timing.
- Cap rate 35.8% vs local median 10.2% in Detroit — top-decile yield for the area; either an underpriced asset or a hidden risk that comps aren't pricing in. Stress-test before assuming the spread holds.
Location & tenants
- Location reads 73/100 on livability (#218 in MI) — a middle-class / working-renter tenant base. Strengths: amenities A+, commute A+, cost of living A+; Watch: schools F, crime F, employment F.
- Detroit Public Schools Community District (urban): math 10% / reading 24% proficiency, ranked #499 of 540 in MI (top 92%) — low school quality limits family demand, transient renter base, plan for 1-2y turnover; 90% free/reduced lunch — lower-income household profile, screen leases tightly.
- Market conditions: 190 active listings in the ZIP; 28 comparable units currently listed for rent nearby; rentals at typical pace (median 18d on market — plan ~3-4 weeks tenant-placement turnaround); lower-income renter base — watch delinquency; 2,639 units permitted in Wayne County in 2024 (1,216 in 5+ unit buildings).
- At $1,300/mo this rent would consume 46% of the median local household income ($34k/yr) (locally 1202% of renters already pay >50% of income on rent) — very limited rent-growth headroom before tenants either downsize or default.
Forward outlook
- Local home prices are declining (-3.0%/yr); year-one equity from $221 of loan paydown is wiped out by about $960 of value loss. Plan a longer hold.
- Wayne County population projected at -17% by 2050 — secular population decline; favor cash flow + early exit over multi-decade hold.
- At projected returns (-3.0% appreciation + 3.0% rent growth), your $9k cash investment doubles in ~2 years — after that, you're playing with house money.
Negotiation context
- It's been on market 427 days — a 12% lower offer ($28k) is reasonable based on typical stale-listing flexibility.
- 2 sale attempts; this cycle's ask has dropped $3k (9%) from the opening price — seller is motivated, your offer sets the floor, not the list.
Risks & watch-outs
- Watch-outs: built in 1913 — expect roof / HVAC / electrical / plumbing capex.
Questions for the listing agent
- It's been on market 427 days. Have you received any prior offers? Is the seller open to a 12% concession, seller financing, or rate buy-down credit?
- Built in 1913 — when were the roof, HVAC, electrical panel, plumbing, and water heater last replaced?
- Why hasn't it sold? Are there any deal-killer items the seller is aware of (foundation, flood, title, zoning, code violations)?
- Is there a deadline driving the sale (1031 exchange, divorce, estate, relocation)? That informs how much negotiation room exists.
- Schools are F-rated, which usually means shorter tenancies and higher turnover. Who's the typical renter profile here, and what's been the actual vacancy rate?
- Crime grade is F in this area — have there been break-ins, vandalism, or insurance claims at this property in the last 3 years? What carrier currently insures it and at what premium?
- What's the average days-on-market for RENTAL listings here right now (not sales)? A rising rental-DOM trend means longer vacancies and softer asking-rent achievability than the comps imply.
- What's the recent tenant-quality profile in this submarket — average credit score on applications, eviction rate, late-payment / NSF rate, and stable-employment percentage? A property-management company in the area should have these aggregated.
- How much new for-sale + rental construction is in the pipeline within 1–3 miles? Heavy new supply typically softens prices + rents 12–24 months out; constrained supply supports both.
Investment metrics
- 1% rule
- 4.06% ✓
- Cap rate
- 35.76%
- Cash-on-cash
- 105.24%
- DSCR
- 5.68
- GRM
- 2.1
CMA / ARV
- ARV (median comp)
- $39,363
- List price
- $32,000
- Delta
- -18.71%
- Verdict
- UNDERPRICED
- Comps
- 20 within 1.0 mi
Show comp detail 12 sales within ~0.75 mi
| Address | Dist | Beds/Ba | Sqft | Sold | Price | $/sf | Match |
|---|---|---|---|---|---|---|---|
| 5327 Holcomb St | 0.04mi | 3/2.0 | 1,046 (-7%) | 5mo | $30,000 | $29 | 78 |
| 5232 Mcclellan St | 0.15mi | 3/1.0 | 1,001 (-11%) | 0mo | $33,000 | $33 | 74 |
| 5049 Pennsylvania St | 0.29mi | 3/1.0 | 1,046 (-7%) | 6mo | $15,000 | $14 | 70 |
| 4533 Mcclellan St | 0.44mi | 3/1.0 | 1,194 (+6%) | 7mo | $86,000 | $72 | 64 |
| 6156 Iroquois St | 0.63mi | 2/1.0 (-1) | 1,148 (+2%) | 3mo | $50,000 | $44 | 60 |
| 5832 Garland St | 0.69mi | 3/1.0 | 1,169 (+4%) | 6mo | $29,900 | $26 | 56 |
| 4673 French Rd | 0.73mi | 3/1.0 | 1,060 (-6%) | 7mo | $16,500 | $16 | 50 |
| 4143 Holcomb St | 0.63mi | 3/1.0 | 962 (-15%) | 1mo | $15,000 | $16 | 46 |
| 5855 Hurlbut St | 0.55mi | 3/1.0 | 1,296 (+15%) | 5mo | $119,900 | $93 | 45 |
| 6026 Maxwell St | 0.66mi | 4/1.0 (+1) | 1,266 (+12%) | 2mo | $10,000 | $8 | 42 |
| 6130 Maxwell St | 0.71mi | 3/1.0 | 958 (-15%) | 4mo | $40,000 | $42 | 38 |
| 3872 Fischer St | 0.73mi | 3/1.0 | 1,288 (+14%) | 9mo | $62,500 | $49 | 34 |
Match score weights: distance 35% · size 25% · config 20% · recency 20%. Top-matched comps best support the ARV.
Projected returns pro-forma
-3.0% appreciation · 3.0% rent growth · sell at horizon
- IRR
- —
- Equity multiple
- 6.01×
- Total profit
- $44,894
- Equity at exit
- $4,771
- IRR
- —
- Equity multiple
- 12.57×
- Total profit
- $103,667
- Equity at exit
- $2,767
Cash invested: $8,960 (down + closing). Projections, not guarantees.
Landlord ↔ Tenant lean methodology
- Overall (STATE)
- 62 Landlord-Friendly
- State Michigan
- 62 Landlord-Friendly · EVEN
- County
- — inherits STATE
- City
- — inherits STATE
ZIP-level market 48213
- Active inventory
- 190
- Price-to-rent
- 2.1×
Monthly cashflow live
- Estimated rent
- $1,300 high interval (Pro) →
- Mortgage (P&I)
- −$168
- Tax from tax record
- −$60 /mo · $724/yr
- Insurance
- −$13
- HOA
- −$0
- Vacancy / Maint / Mgmt
- −$273
- Net cashflow
- $786
Break-even live
UW: 25.0% down · 7.5% · 30yr · 1.5% tax · 5.0% vac · 8.0% maint · 8.0% mgmt
Financing live
Cash to close
- Down payment
- $8,000
- Closing costs
- $960
- Reserves months
- —
- Total cash needed
- —
Loan-product check · same deal, 3 products live
Conventional
25% down · 7.5% · 30yr
- Down + closing
- —
- Monthly P&I
- —
- Monthly cashflow
- —
- DSCR
- —
- Eligible?
- —
Personal DTI + credit; lowest rate.
DSCR
20% down · 8.5% · 30yr
- Down + closing
- —
- Monthly P&I
- —
- Monthly cashflow
- —
- DSCR
- —
- Eligible?
- —
No personal income docs; deal must DSCR.
Hard money
10% down · 12.0% · 12mo
- Down + closing
- —
- Monthly P&I
- —
- Monthly cashflow
- —
- DSCR
- —
- Eligible?
- —
Short-term bridge; refi at stabilization.
Rent comps 28 comps
| Address | Beds | Baths | Sqft | Rent | $/sqft | DOM | Units | Dist |
|---|---|---|---|---|---|---|---|---|
| 5342 Cooper St Detroit, MI | 3.0 | 1.0 | 1125 | $1,200 | $1.07 | 24d | 1 | 0.24mi |
| 4735 Rohns St Unit 4A Detroit, MI | 2.0 | 1.0 | 850 | $1,000 | $1.18 | 1d | 1 | 0.29mi |
| 4735 Rohns St Unit 6A Detroit, MI | 2.0 | 1.0 | 850 | $1,100 | $1.29 | 1d | 1 | 0.29mi |
| 5380 Maxwell St Unit 5380 Detroit, MI | 2.0 | 1.0 | 1100 | $900 | $0.82 | 17d | 1 | 0.47mi |
| 5858 Seneca St Detroit, MI | 3.0 | 1.0 | 1348 | $999 | $0.74 | 17d | 1 | 0.47mi |
| 8843 E Canfield St Detroit, MI | 4.0 | 2.0 | 1200 | $2,400 | $2.00 | 43d | 1 | 0.48mi |
| 4169 Burns St Detroit, MI | 4.0 | 2.5 | 1326 | $2,300 | $1.73 | 24d | 1 | 0.64mi |
| 4811 Seyburn St Detroit, MI | 3.0 | 1.0 | 1196 | $1,037 | $0.87 | 17d | 1 | 0.69mi |
| 4190 Hurlbut St Unit 2 Detroit, MI | 2.0 | 1.0 | 900 | $945 | $1.05 | 15d | 1 | 0.70mi |
| 4487 French Rd Detroit, MI | 4.0 | 2.0 | 1280 | $1,800 | $1.41 | 43d | 1 | 0.79mi |
| 5045 Fairview St Detroit, MI | 3.0 | 1.0 | 1303 | $1,200 | $0.92 | 43d | 1 | 0.88mi |
| 9354 Bessemore St Detroit, MI | 3.0 | 1.0 | 1125 | $1,294 | $1.15 | 17d | 1 | 0.89mi |
| 3475 Crane St Detroit, MI | 3.0 | 1.5 | 1000 | $1,338 | $1.34 | 43d | 1 | 0.95mi |
| 3501 Garland St Detroit, MI | 2.0 | 1.0 | 1000 | $900 | $0.90 | 24d | 1 | 1.03mi |
| 3495 Garland St Detroit, MI | 2.0 | 1.0 | 1100 | $900 | $0.82 | 43d | 1 | 1.04mi |
| 4055 Beniteau St Detroit, MI | 2.0 | 1.0 | 1000 | $900 | $0.90 | 17d | 1 | 1.12mi |
| 9142 Isham Detroit, MI | 3.0 | 1.0 | 1000 | $1,344 | $1.34 | 17d | 1 | 1.13mi |
| 3032 Hurlbut St Unit 1 Detroit, MI | 2.0 | 1.0 | 950 | $900 | $0.95 | 3d | 1 | 1.14mi |
| 8215 Badger St Detroit, MI | 2.0 | 1.0 | 1000 | $1,000 | $1.00 | 15d | 1 | 1.16mi |
| 3937 Beniteau St Detroit, MI | 2.0 | 1.0 | 900 | $950 | $1.06 | 15d | 1 | 1.17mi |
| 3937 Beniteau St Unit 1 Detroit, MI | 2.0 | 1.0 | 1250 | $900 | $0.72 | 43d | 1 | 1.17mi |
| 3980 Helen St Detroit, MI | 2.0 | 1.0 | 800 | $845 | $1.06 | 16d | 1 | 1.19mi |
| 3049 Montclair St Unit 1 Detroit, MI | 2.0 | 1.0 | 850 | $950 | $1.12 | 43d | 1 | 1.24mi |
| 3460 Field St Detroit, MI | 2.0 | 1.0 | 1000 | $1,260 | $1.26 | 5d | 1 | 1.30mi |
| 2544 Cadillac Blvd Unit 2 Detroit, MI | 2.0 | 1.0 | 973 | $825 | $0.85 | 23d | 1 | 1.35mi |
| 2282 Belvidere St Unit 102 Detroit, MI | 2.0 | 2.0 | 1000 | $1,250 | $1.25 | 43d | 1 | 1.36mi |
| 2972 Field St Detroit, MI | 3.0 | 1.0 | 1225 | $1,395 | $1.14 | 17d | 1 | 1.42mi |
| 8193 Traverse St Detroit, MI | 3.0 | 1.0 | 1055 | $1,382 | $1.31 | 17d | 1 | 1.48mi |
Listing history 16 events
-
2026-06-18days on market $32,000 Active 427 DOM
-
2026-06-17days on market $32,000 Active 426 DOM
-
2026-06-15days on market $32,000 Active 424 DOM
-
2026-06-13days on market $32,000 Active 422 DOM
-
2026-06-13days on market $32,000 Active 421 DOM
-
2026-06-09days on market $32,000 Active 418 DOM
-
2026-06-08days on market $32,000 Active 417 DOM
-
2026-06-07days on market $32,000 Active 416 DOM
-
2026-06-04days on market $32,000 Active 413 DOM
-
2026-06-03days on market $32,000 Active 412 DOM
-
2026-06-01days on market $32,000 Active 410 DOM
-
2026-05-31days on market $32,000 Active 409 DOM
-
2025-09-07price $32,000 235-char remark
Show marketing remark (235 chars)
Offer fell apart, back on the market. This home was once a gem. .. family-owned for over 80 years. The estate to sale has been approved in probate court at the list price. Calling all investors to make this property a gem again. BATVAI
-
2025-09-06price $32,000 235-char remark
Show marketing remark (235 chars)
Offer fell apart, back on the market. This home was once a gem. .. family-owned for over 80 years. The estate to sale has been approved in probate court at the list price. Calling all investors to make this property a gem again. BATVAI
-
2025-04-17$35,000 Active 235-char remark
Show marketing remark (235 chars)
Offer fell apart, back on the market. This home was once a gem. .. family-owned for over 80 years. The estate to sale has been approved in probate court at the list price. Calling all investors to make this property a gem again. BATVAI
ⓘ Source: listings_history table (triggers on properties + properties_extension) + one-shot
backfill from property_details.listing_events for pre-trigger history.
Tax reassessment forecast MI · Partial reset (capped growth)
- Current annual tax
- $724 · $60/mo
- Projected year-2 tax
- $724 · $60/mo
- Expected delta
- $0/yr ($0/mo · 0.0%)
ⓘ Screening estimate from a state-policy table — verify with the county assessor before closing.
Climate risk First Street
- Flood 1/10 Low FEMA zone X (unshaded) · 0% chance over 30 yrs
- Wildfire 1/10 Low
- Heat 3/10 Moderate 7 d/yr ≥96°F today · 15 d/yr by 30 yrs out
- Wind 2/10 Low
- Air quality 3/10 Moderate 2 unhealthy d/yr today · 5 by 30 yrs out
Nearby sold comps map
Loading sold comps map…
Walkable amenities ~0.75 mi
Loading nearby amenities…
Taxation est. · year 1
- Rental income
- $15,604
- − Mortgage interest
- −$1,792
- − Property taxes
- −$724
- − Insurance
- −$160
- − Repairs & maintenance
- −$1,248
- − Management
- −$1,248
- − Depreciation
- −$931
- Taxable income
- $9,500
- Est. tax owed @ 24.0%
- −$2,280
- After-tax cash flow
- $7,149/yr
For passive investors: Depreciation is non-cash, so a rental often shows a tax loss while cash-flowing — sheltering income. Rental losses are passive: they offset passive income freely, and up to $25,000/yr can offset ordinary (W-2) income if you actively participate and your MAGI is under $100k (phasing out to $0 by $150k); unused losses carry forward. On sale, claimed depreciation is recaptured at up to 25%, and gains may owe capital-gains tax (a 1031 exchange can defer both). Figures are a year-1 estimate at your 24.0% rate — not tax advice; consult a CPA.
Schools (NCES district)
- District
- Detroit Public Schools Community District
- NCES district ID
- 2601103
- Math proficiency
- 10% ▼ -2.00%
- Reading proficiency
- 24% ▲ 6.00%
- Median HH income
- $25,815
- Composite
- 13.06/100
- National rank
- #9564
- State rank
- #499 of 540 in MI
Livability — Detroit
- Score
- 73/100
- State rank
- #218
- US rank
- #5427
Category grades
Schools grade is shown separately in the Schools card above.
Census & demographics
- Census place
- Detroit, MI
- County
- Wayne County · 1,562,939 people
- City population
- 572,865
- Metro
- Detroit-Warren-Dearborn, MI
- Population (ZIP)
- 20,075
- Household income
- $34,003
- Rent vs Own
- Severe rent burden
- 1202.0
Population outlook (Wayne County) Hauer SSP2
- Today (2025)
- 1,675,273 people
- By 2030
- 1,620,300 · -3.3%
- By 2040
- 1,502,341 · -10.3%
- By 2050
- 1,384,039 · -17.4%
- By 2075
- 1,124,592 · -32.9%
- By 2100
- 881,193 · -47.4%
Race, ethnicity, and origin ACS 2023
- Neighborhood character
- Predominantly Black (92%)
- Race & ethnicity
- Black 92% White 4% Hispanic / Latino 2% Two or more races 1%
- Common ancestry
- Slovak 1%
- Foreign-born
- 2% · Canada
- Languages at home
- 97% English-only · Arabic 1% Spanish 1%
Political lean MEDSL · Wayne
- 2024 margin
- Strong D (+29.0) · D 62.7% · R 33.7% · Other 3.6%
- 2008→2024 swing
- -20.5pp toward R · 2008: 49.5pp · 2024: 29.0pp
- All cycles
- 2024: D+29.0 2020: D+38.1 2016: D+37.3 2012: D+46.9 2008: D+49.5
Not yet ingested
- Civics
- —
Market trends
- HPI YoY
- ▼ -122.86%
- Current HPI
- 217.2037
- Rent YoY
- —
- Metro
- Detroit-Warren-Dearborn, MI
- State GDP YoY
- ▲ 1.37%
- F500 in state
- 28
Industry mix (Fortune 500 HQ in MI)
| Industry | F500 HQs | Revenue |
|---|---|---|
| Automotive Parts | 3 | $48B |
|
||
| Automotive | 2 | $372B |
|
||
| Chemicals | 1 | $45B |
|
||
| Automotive Retail | 1 | $29B |
|
||
| Healthcare / Medical Devices | 1 | $23B |
|
||
| Automotive Technology | 1 | $20B |
|
||
Price history
-8.6% since first listed4 events — show timeline
- 2025-09-07 Price Changed $32,000 MiRealSource-MiMLS
- 2025-09-06 Price Changed $32,000 REALCOMP
- 2025-04-17 Listed $35,000 REALCOMP
- 2025-04-17 Listed $35,000 MiRealSource-MiMLS
Property tax history
-1.4%/yrLatest (2025): $724 · -9.6% YoY. Source: county tax records.
Cash-flow waterfall
monthlySold comps — $/sqft
last 12 mo · ≤1 miLoading sold comps…