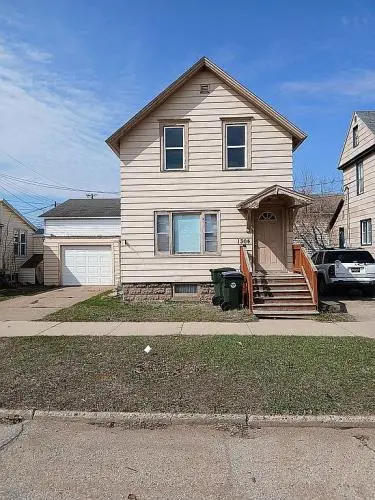
1304 1st Ave N · Escanaba, MI
Flood risk No data
- FEMA flood zone
- —
- Chance of flooding over 30 yrs
- —
- Est. flood insurance / yr
- —
Fire risk No data
- Est. fire insurance / yr
- —
Heat risk No data
- Hot days now (above threshold)
- —
- Hot days in 30 yrs
- —
Wind risk No data
- Chance of severe wind over 30 yrs
- —
Air-quality risk No data
- Unhealthy air days now
- —
- Unhealthy air days in 30 yrs
- —
Risk factors via First Street. Map © Google.
Why this score? — see what drove the D- grade
The composite is a weighted blend of 9 inputs, each scored 0–100. Each bar is that input's sub-score; the figure is the points it added to the 100-point composite (weight × sub-score).
- Cash flow +13.5/30.0
- ARV discount +7.5/15.0
- DSCR +4.1/10.0
- Livability +3.8/5.0
- Schools +3.2/10.0
- 1% rule +2.7/10.0
- Rent growth +2.5/5.0
- Condition / age +2.5/5.0
- Appreciation +0.0/10.0
$150,000
🖨 Deal sheet 📄 Offer letter ✓ Due diligence
Listing remarks MLS
Duplex ready. Investment property that was consistently rented for approximately 20 years.
Key facts
- Garage
- Built 1900
- Listed 261 days
Neighborhood map
What this means for you Summary
Snapshot
- This is a 2-bed/1.0-bath single-family listed at $150k.
Deal economics
- At list price, monthly cash flow is $6 ($73/yr) — positive.
- The deal already cash-flows at list — no discount required.
- To meet the 1% rule (rent ≥ 1% of price), the offer needs to be $115k (23.4% below list).
- Recommended offer: $115k (23.4% below list) — sets the bar for 1% rule.
- Cap rate 6.3% vs local median 4.9% in Escanaba — meaningfully above typical; check what's discounted (condition, days-on-market, listing class) to confirm the premium yield is real.
Location & tenants
- Location reads 75/100 on livability (#161 in MI, #4,089 nationally) — a middle-class / working-renter tenant base. Strengths: amenities A+, cost of living A+, housing A+; Watch: crime D+, commute F, employment F.
- Escanaba Area Public Schools (town): math 31% / reading 46% proficiency, ranked #243 of 540 in MI (top 45%) — families likely to look elsewhere, expect single-tenant / working-renter base with shorter leases.
- Market conditions: 63 active listings in the ZIP; 38 units permitted in Delta County in 2024 (0 in 5+ unit buildings).
Forward outlook
- Local home prices are declining (-3.0%/yr); year-one equity from $1k of loan paydown is wiped out by about $4k of value loss. Plan a longer hold.
- Delta County population projected at -22% by 2050 — secular population decline; favor cash flow + early exit over multi-decade hold.
Negotiation context
- It's been on market 261 days — a 12% lower offer ($132k) is reasonable based on typical stale-listing flexibility.
- 3 sale attempts since 6y ago with the ask held roughly flat each time — persistent listings suggest the price (not the market) is what's stuck; bring a comps-based counter.
- Current owner paid $24k; list at $150k implies a 512% gain — meaningful room to come down on a strong offer.
Risks & watch-outs
- Watch-outs: built in 1900 — expect roof / HVAC / electrical / plumbing capex.
Questions for the listing agent
- It's been on market 261 days. Have you received any prior offers? Is the seller open to a 23% concession, seller financing, or rate buy-down credit?
- Built in 1900 — when were the roof, HVAC, electrical panel, plumbing, and water heater last replaced?
- Why hasn't it sold? Are there any deal-killer items the seller is aware of (foundation, flood, title, zoning, code violations)?
- Is there a deadline driving the sale (1031 exchange, divorce, estate, relocation)? That informs how much negotiation room exists.
- Schools are B-rated — typically a magnet for longer-tenancy family renters. What's the average tenant stay here, and is there a school-zone premium baked into asking?
- Crime grade is D in this area — have there been break-ins, vandalism, or insurance claims at this property in the last 3 years? What carrier currently insures it and at what premium?
- The area grade is low — what's the realistic commute time and amenity access for the typical tenant pool here? Any planned neighborhood developments (good or bad) we should know about?
- What's the average days-on-market for RENTAL listings here right now (not sales)? A rising rental-DOM trend means longer vacancies and softer asking-rent achievability than the comps imply.
- What's the recent tenant-quality profile in this submarket — average credit score on applications, eviction rate, late-payment / NSF rate, and stable-employment percentage? A property-management company in the area should have these aggregated.
- How much new for-sale + rental construction is in the pipeline within 1–3 miles? Heavy new supply typically softens prices + rents 12–24 months out; constrained supply supports both.
Investment metrics
- 1% rule
- 0.77% ✗
- Cap rate
- 6.34%
- Cash-on-cash
- 0.17%
- DSCR
- 1.01
- GRM
- 10.9
CMA / ARV
- ARV (median comp)
- $89,672
- List price
- $150,000
- Delta
- 67.28%
- Verdict
- OVERPRICED
- Comps
- 20 within 1.0 mi
Show comp detail 12 sales within ~0.75 mi
| Address | Dist | Beds/Ba | Sqft | Sold | Price | $/sf | Match |
|---|---|---|---|---|---|---|---|
| 315 N 12th St | 0.13mi | 3/1.0 (+1) | 1,012 (-3%) | 5mo | $110,000 | $109 | 80 |
| 327 N 16th St | 0.27mi | 2/2.0 | 1,020 (-2%) | 9mo | $150,000 | $147 | 73 |
| 204 S 17th St | 0.34mi | 2/1.0 | 1,107 (+6%) | 8mo | $115,000 | $104 | 67 |
| 917 S 7th Ave | 0.73mi | 2/1.0 | 1,043 (+0%) | 5mo | $160,000 | $153 | 61 |
| 611 S 13th St | 0.55mi | 3/1.0 (+1) | 1,056 (+2%) | 9mo | $100,000 | $95 | 59 |
| 722 S 16 St | 0.69mi | 2/1.0 | 1,099 (+6%) | 0mo | $155,000 | $141 | 58 |
| 413 S 19th St | 0.51mi | 2/1.5 | 964 (-7%) | 6mo | $165,000 | $171 | 57 |
| 225 S Lincoln Rd | 0.71mi | 2/1.0 | 974 (-6%) | 5mo | $148,000 | $152 | 52 |
| 418 S 1st Ave | 0.62mi | 2/1.0 | 918 (-12%) | 4mo | $52,000 | $57 | 48 |
| 718 S 16th St | 0.65mi | 2/1.0 | 925 (-11%) | 6mo | $148,000 | $160 | 46 |
| 800 S 6th Ave | 0.68mi | 3/2.0 (+1) | 1,092 (+5%) | 8mo | $290,000 | $266 | 44 |
| 215 S Lincoln Rd | 0.70mi | 2/1.0 | 900 (-13%) | 8mo | $150,000 | $167 | 38 |
Match score weights: distance 35% · size 25% · config 20% · recency 20%. Top-matched comps best support the ARV.
Projected returns pro-forma
-3.0% appreciation · 3.0% rent growth · sell at horizon
- IRR
- -16.1%
- Equity multiple
- 0.43×
- Total profit
- $-23,984
- Equity at exit
- $22,365
- IRR
- -7.8%
- Equity multiple
- 0.51×
- Total profit
- $-20,651
- Equity at exit
- $12,969
Cash invested: $42,000 (down + closing). Projections, not guarantees.
Landlord ↔ Tenant lean methodology
- Overall (STATE)
- 62 Landlord-Friendly
- State Michigan
- 62 Landlord-Friendly · EVEN
- County
- — inherits STATE
- City
- — inherits STATE
ZIP-level market 49829
- Home prices YoY
- -25.6%
- Active inventory
- 63
- Price-to-rent
- 10.9×
Monthly cashflow live
- Estimated rent
- $1,150 medium interval (Pro) →
- Mortgage (P&I)
- −$787
- Tax from tax record
- −$53 /mo · $635/yr
- Insurance
- −$62
- HOA
- −$0
- Vacancy / Maint / Mgmt
- −$241
- Net cashflow
- $6
Break-even live
UW: 25.0% down · 7.5% · 30yr · 1.5% tax · 5.0% vac · 8.0% maint · 8.0% mgmt
Financing live
Cash to close
- Down payment
- $37,500
- Closing costs
- $4,500
- Reserves months
- —
- Total cash needed
- —
Loan-product check · same deal, 3 products live
Conventional
25% down · 7.5% · 30yr
- Down + closing
- —
- Monthly P&I
- —
- Monthly cashflow
- —
- DSCR
- —
- Eligible?
- —
Personal DTI + credit; lowest rate.
DSCR
20% down · 8.5% · 30yr
- Down + closing
- —
- Monthly P&I
- —
- Monthly cashflow
- —
- DSCR
- —
- Eligible?
- —
No personal income docs; deal must DSCR.
Hard money
10% down · 12.0% · 12mo
- Down + closing
- —
- Monthly P&I
- —
- Monthly cashflow
- —
- DSCR
- —
- Eligible?
- —
Short-term bridge; refi at stabilization.
Listing history 21 events
-
2026-06-18days on market $150,000 Active 261 DOM
-
2026-06-17days on market $150,000 Active 260 DOM
-
2026-06-16days on market $150,000 Active 259 DOM
-
2026-06-15days on market $150,000 Active 258 DOM
-
2026-06-13days on market $150,000 Active 256 DOM
-
2026-06-12days on market $150,000 Active 255 DOM
-
2026-06-09days on market $150,000 Active 252 DOM
-
2026-06-08days on market $150,000 Active 251 DOM
-
2026-06-07days on market $150,000 Active 250 DOM
-
2026-06-07days on market $150,000 Active 249 DOM
-
2026-06-04days on market $150,000 Active 246 DOM
-
2026-06-02days on market $150,000 Active 245 DOM
-
2026-06-01days on market $150,000 Active 244 DOM
-
2026-05-31days on market $150,000 Active 243 DOM
-
2026-05-31days on market $150,000 Active 242 DOM
-
2025-09-26$150,000 Active 90-char remark
Show marketing remark (90 chars)
Duplex ready. Investment property that was consistently rented for approximately 20 years.
-
2020-08-12soldstatus $24,500 93-char remark
Show marketing remark (93 chars)
Recently vacated investment property that was consistently rented for approximately 20 years.
-
2020-08-12soldstatus $24,500 93-char remark
Show marketing remark (93 chars)
Recently vacated investment property that was consistently rented for approximately 20 years.
-
2020-07-17soldstatus $24,500
-
2020-06-16$24,500 93-char remark
Show marketing remark (93 chars)
Recently vacated investment property that was consistently rented for approximately 20 years.
-
2020-06-16$24,500 93-char remark
Show marketing remark (93 chars)
Recently vacated investment property that was consistently rented for approximately 20 years.
ⓘ Source: listings_history table (triggers on properties + properties_extension) + one-shot
backfill from property_details.listing_events for pre-trigger history.
Tax reassessment forecast MI · Partial reset (capped growth)
- Current annual tax
- $635 · $53/mo
- Projected year-2 tax
- $1,472 · $123/mo
- Expected delta
- +$838/yr (+$70/mo · 132.0%)
ⓘ Screening estimate from a state-policy table — verify with the county assessor before closing.
Nearby sold comps map
Loading sold comps map…
Walkable amenities ~0.75 mi
Loading nearby amenities…
Taxation est. · year 1
- Rental income
- $13,794
- − Mortgage interest
- −$8,402
- − Property taxes
- −$635
- − Insurance
- −$750
- − Repairs & maintenance
- −$1,104
- − Management
- −$1,104
- − Depreciation
- −$4,364
- Taxable loss
- −$2,564
- Est. tax savings @ 24.0%
- +$615
- After-tax cash flow
- $688/yr
For passive investors: Depreciation is non-cash, so a rental often shows a tax loss while cash-flowing — sheltering income. Rental losses are passive: they offset passive income freely, and up to $25,000/yr can offset ordinary (W-2) income if you actively participate and your MAGI is under $100k (phasing out to $0 by $150k); unused losses carry forward. On sale, claimed depreciation is recaptured at up to 25%, and gains may owe capital-gains tax (a 1031 exchange can defer both). Figures are a year-1 estimate at your 24.0% rate — not tax advice; consult a CPA.
Schools (NCES district)
- District
- Escanaba Area Public Schools
- NCES district ID
- 2613500
- Math proficiency
- 31% ▼ -8.00%
- Reading proficiency
- 46% ▼ -1.00%
- Median HH income
- $37,187
- Composite
- 31.97/100
- National rank
- #5841
- State rank
- #243 of 540 in MI
Livability — Escanaba
- Score
- 75/100
- State rank
- #161
- US rank
- #4089
Category grades
Schools grade is shown separately in the Schools card above.
Census & demographics
- Census place
- Escanaba, MI
- Population (ZIP)
- 16,859
Population outlook (Delta County) Hauer SSP2
- Today (2025)
- 34,431 people
- By 2030
- 33,003 · -4.1%
- By 2040
- 29,748 · -13.6%
- By 2050
- 26,753 · -22.3%
- By 2075
- 20,962 · -39.1%
- By 2100
- 15,616 · -54.6%
Race, ethnicity, and origin ACS 2023
- Neighborhood character
- Predominantly White (88%)
- Race & ethnicity
- White 88% Two or more races 9% Hispanic / Latino 2% Native American 2%
- Common ancestry
- Lithuanian 14% Italian 4% Romanian 4%
- Foreign-born
- 1% · Canada
Political lean MEDSL · Delta
- 2024 margin
- Solid R (+30.4) · D 34.1% · R 64.5% · Other 1.4%
- 2008→2024 swing
- -36.7pp toward R · 2008: 6.3pp · 2024: -30.4pp
- All cycles
- 2024: R+30.4 2020: R+26.5 2016: R+25.4 2012: R+6.7 2008: D+6.3
Not yet ingested
- Civics
- —
Market trends
- HPI YoY
- ▼ -85.16%
- Current HPI
- 247.9676
- Rent YoY
- —
- Metro
- —
- State GDP YoY
- ▲ 1.37%
- F500 in state
- 28
Industry mix (Fortune 500 HQ in MI)
| Industry | F500 HQs | Revenue |
|---|---|---|
| Automotive Parts | 3 | $48B |
|
||
| Automotive | 2 | $372B |
|
||
| Chemicals | 1 | $45B |
|
||
| Automotive Retail | 1 | $29B |
|
||
| Healthcare / Medical Devices | 1 | $23B |
|
||
| Automotive Technology | 1 | $20B |
|
||
Price history
+512.2% since first listed6 events — show timeline
- 2025-09-26 Listed $150,000 Fizber.com
- 2020-08-12 Sold (MLS) $24,500 MiRealSource-MiMLS
- 2020-08-12 Sold (MLS) $24,500 UPAR
- 2020-07-17 Sold (Public Records) $24,500 Public Records
- 2020-06-16 Listed $24,500 MiRealSource-MiMLS
- 2020-06-16 Listed $24,500 UPAR
Property tax history
-3.4%/yrLatest (2025): $635 · -22.5% YoY. Source: county tax records.
Cash-flow waterfall
monthlySold comps — $/sqft
last 12 mo · ≤1 miLoading sold comps…