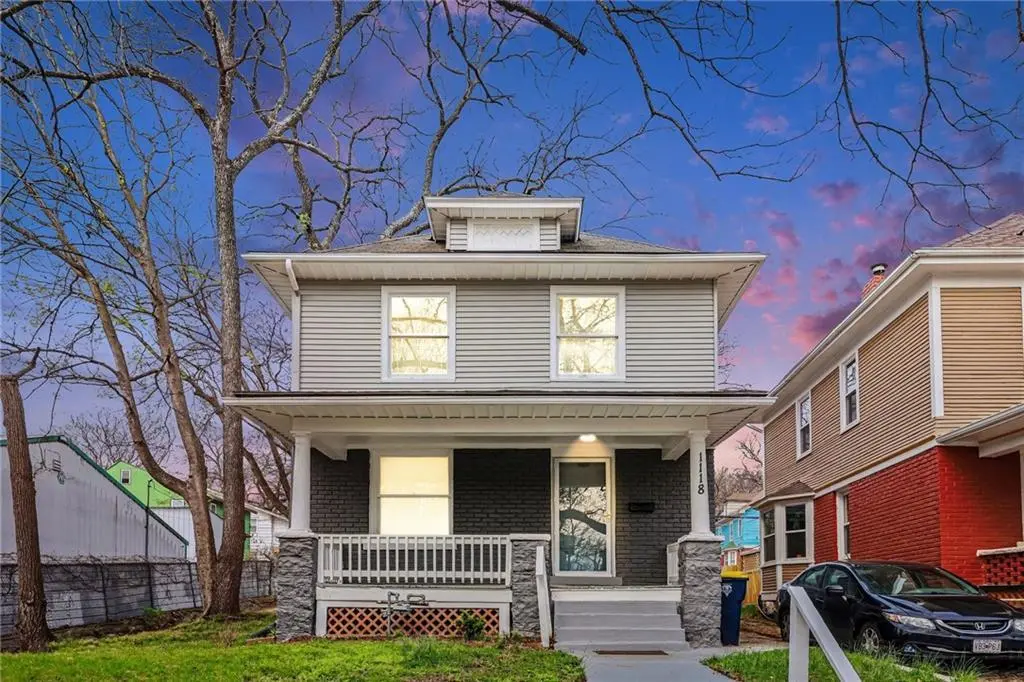
1118 Monroe Ave · Kansas City, MO
Flood risk 1/10 · Minimal
- FEMA flood zone
- X (unshaded)
- Chance of flooding over 30 yrs
- 0.0%
- Est. flood insurance / yr
- $473 – $860
Fire risk 1/10 · Minimal
- Est. fire insurance / yr
- $1,054 – $1,958
Heat risk 4/10 · Minor
- Hot days now (above 106°F)
- 7 days/yr
- Hot days in 30 yrs
- 17 days/yr
Wind risk 2/10 · Minimal
- Chance of severe wind over 30 yrs
- —
Air-quality risk 3/10 · Minor
- Unhealthy air days now
- 2 days/yr
- Unhealthy air days in 30 yrs
- 3 days/yr
Risk factors via First Street. Map © Google.
Why this score? — see what drove the C- grade
The composite is a weighted blend of 9 inputs, each scored 0–100. Each bar is that input's sub-score; the figure is the points it added to the 100-point composite (weight × sub-score).
- Cash flow +22.0/30.0
- ARV discount +9.1/15.0
- DSCR +7.0/10.0
- 1% rule +4.6/10.0
- Livability +3.9/5.0
- Rent growth +2.7/5.0
- Condition / age +2.5/5.0
- Schools +1.5/10.0
- Appreciation +1.1/10.0
$150,000
🖨 Deal sheet 📄 Offer letter ✓ Due diligence
Listing remarks MLS
Charming 3 bedroom, 1 bath two story home located less than 10 minutes from downtown Kansas City with excellent highway access. This inviting home features a welcoming front porch, beautiful hardwood floors throughout, and light, neutral paint that enhances the abundance of natural light from ample windows. The kitchen offer generous cabinetry for storage, while the cozy family room includes a fireplace perfect for relaxing evenings. Enjoy outdoor living on the spacious back patio, ideal for grilling and entertaining, overlooking a nice size yard. Additional highlights include a designated laundry room, an updated bathroom with a shower/tub combo, and an unfinished basement providing excellent storage space. Move in ready and full of charm, don't miss this one! * * AC condensor to be installed prior to closing
Key facts
- Generous cabinetry
- Front porch
- Cozy family room
Tags
Neighborhood map
What this means for you Summary
Snapshot
- This is a 3-bed/1.0-bath single-family listed at $150k.
Deal economics
- At list price, monthly cash flow is $240 ($3k/yr) — positive.
- The deal already cash-flows at list — no discount required.
- To meet the 1% rule (rent ≥ 1% of price), the offer needs to be $144k (3.8% below list).
- Recommended offer: $141k (6.0% below list) — sets the bar for market timing.
- Cap rate 8.2% vs local median 3.9% in Kansas City — top-decile yield for the area; either an underpriced asset or a hidden risk that comps aren't pricing in. Stress-test before assuming the spread holds.
Location & tenants
- Location reads 78/100 on livability (#28 in MO, #2,671 nationally) — a middle-class / working-renter tenant base. Strengths: amenities A+, commute A+, cost of living A+; Watch: schools C-, crime F.
- Kansas City 33 (urban): math 12% / reading 24% proficiency, ranked #308 of 324 in MO (top 95%) — low school quality limits family demand, transient renter base, plan for 1-2y turnover; 75% free/reduced lunch — lower-income household profile, screen leases tightly.
- Market conditions: Rents flat; 108 active listings in the ZIP; 36 comparable units currently listed for rent nearby; rentals at typical pace (median 24d on market — plan ~3-4 weeks tenant-placement turnaround); lower-income renter base — watch delinquency; 4,002 units permitted in Jackson County in 2024 (2,271 in 5+ unit buildings).
- At $1,443/mo this rent would consume 52% of the median local household income ($33k/yr) (locally 1943% of renters already pay >50% of income on rent) — very limited rent-growth headroom before tenants either downsize or default.
Forward outlook
- Local home prices are declining (-3.0%/yr); year-one equity from $1k of loan paydown is wiped out by about $4k of value loss. Plan a longer hold.
- Jackson County population projected at +4% by 2050 — modest demand growth; plan on rents tracking national, not racing it.
Negotiation context
- It's been on market 70 days — a 6% lower offer ($141k) is reasonable based on typical stale-listing flexibility.
- 2 sale attempts since 16y ago with the ask held roughly flat each time — persistent listings suggest the price (not the market) is what's stuck; bring a comps-based counter.
Risks & watch-outs
- Watch-outs: built in 1905 — expect roof / HVAC / electrical / plumbing capex.
Questions for the listing agent
- It's been on market 70 days. Have you received any prior offers? Is the seller open to a 6% concession, seller financing, or rate buy-down credit?
- Built in 1905 — when were the roof, HVAC, electrical panel, plumbing, and water heater last replaced?
- Why hasn't it sold? Are there any deal-killer items the seller is aware of (foundation, flood, title, zoning, code violations)?
- Is there a deadline driving the sale (1031 exchange, divorce, estate, relocation)? That informs how much negotiation room exists.
- Crime grade is F in this area — have there been break-ins, vandalism, or insurance claims at this property in the last 3 years? What carrier currently insures it and at what premium?
- What's the average days-on-market for RENTAL listings here right now (not sales)? A rising rental-DOM trend means longer vacancies and softer asking-rent achievability than the comps imply.
- What's the recent tenant-quality profile in this submarket — average credit score on applications, eviction rate, late-payment / NSF rate, and stable-employment percentage? A property-management company in the area should have these aggregated.
- How much new for-sale + rental construction is in the pipeline within 1–3 miles? Heavy new supply typically softens prices + rents 12–24 months out; constrained supply supports both.
Investment metrics
- 1% rule
- 0.96% ✗
- Cap rate
- 8.21%
- Cash-on-cash
- 6.85%
- DSCR
- 1.30
- GRM
- 8.7
CMA / ARV
- ARV (median comp)
- $155,466
- List price
- $150,000
- Delta
- -3.52%
- Verdict
- FAIR
- Comps
- 20 within 1.0 mi
Show comp detail 12 sales within ~0.75 mi
| Address | Dist | Beds/Ba | Sqft | Sold | Price | $/sf | Match |
|---|---|---|---|---|---|---|---|
| 1114 Monroe Ave | 0.01mi | 3/1.0 | 1,336 (0%) | 18mo | $169,500 | $127 | 84 |
| 1306 Cleveland Ave | 0.17mi | 3/2.0 | 1,295 (-3%) | 18mo | $160,000 | $124 | 68 |
| 810 Monroe Ave | 0.26mi | 3/1.0 | 1,200 (-10%) | 13mo | $149,900 | $125 | 60 |
| 815 Elmwood Ave | 0.63mi | 3/1.5 | 1,302 (-2%) | 5mo | $74,900 | $58 | 60 |
| 3830 Roberts St | 0.56mi | 4/2.0 (+1) | 1,320 (-1%) | 6mo | $70,000 | $53 | 57 |
| 3809 Bernard Powell Dr | 0.62mi | 3/4.0 | 1,318 (-1%) | 5mo | $215,000 | $163 | 52 |
| 653 Elmwood Ave | 0.68mi | 3/2.0 | 1,312 (-2%) | 12mo | $89,000 | $68 | 51 |
| 428 Spruce Ave | 0.72mi | 3/1.0 | 1,400 (+5%) | 11mo | $160,000 | $114 | 49 |
| 4015 E 18th Pl | 0.68mi | 3/2.5 | 1,436 (+8%) | 14mo | $249,900 | $174 | 38 |
| 713 Elmwood Ave | 0.66mi | 3/1.0 | 1,173 (-12%) | 17mo | $29,000 | $25 | 35 |
| 2805 E 8th St | 0.57mi | 3/2.0 | 1,518 (+14%) | 20mo | $160,000 | $105 | 30 |
| 3519 Thompson Ave | 0.59mi | 3/1.0 | 1,144 (-14%) | 22mo | $169,000 | $148 | 30 |
Match score weights: distance 35% · size 25% · config 20% · recency 20%. Top-matched comps best support the ARV.
Projected returns pro-forma
-3.0% appreciation · 0.94% rent growth · sell at horizon
- IRR
- -7.9%
- Equity multiple
- 0.71×
- Total profit
- $-12,032
- Equity at exit
- $22,365
- IRR
- -1.0%
- Equity multiple
- 0.94×
- Total profit
- $-2,607
- Equity at exit
- $12,969
Cash invested: $42,000 (down + closing). Projections, not guarantees.
Landlord ↔ Tenant lean methodology
- Overall (STATE)
- 81 Strongly Landlord-Friendly
- State Missouri
- 81 Strongly Landlord-Friendly · R+10
- County
- — inherits STATE
- City
- — inherits STATE
ZIP-level market 64127
- Home prices YoY
- -2.6%
- Rents YoY
- 0.9%
- Active inventory
- 108
- Price-to-rent
- 8.7×
Monthly cashflow live
- Estimated rent
- $1,443 high interval (Pro) →
- Mortgage (P&I)
- −$787
- Tax from tax record
- −$51 /mo · $611/yr
- Insurance
- −$62
- HOA
- −$0
- Vacancy / Maint / Mgmt
- −$303
- Net cashflow
- $240
Break-even live
UW: 25.0% down · 7.5% · 30yr · 1.5% tax · 5.0% vac · 8.0% maint · 8.0% mgmt
Financing live
Cash to close
- Down payment
- $37,500
- Closing costs
- $4,500
- Reserves months
- —
- Total cash needed
- —
Loan-product check · same deal, 3 products live
Conventional
25% down · 7.5% · 30yr
- Down + closing
- —
- Monthly P&I
- —
- Monthly cashflow
- —
- DSCR
- —
- Eligible?
- —
Personal DTI + credit; lowest rate.
DSCR
20% down · 8.5% · 30yr
- Down + closing
- —
- Monthly P&I
- —
- Monthly cashflow
- —
- DSCR
- —
- Eligible?
- —
No personal income docs; deal must DSCR.
Hard money
10% down · 12.0% · 12mo
- Down + closing
- —
- Monthly P&I
- —
- Monthly cashflow
- —
- DSCR
- —
- Eligible?
- —
Short-term bridge; refi at stabilization.
Rent comps 36 comps
| Address | Beds | Baths | Sqft | Rent | $/sqft | DOM | Units | Dist |
|---|---|---|---|---|---|---|---|---|
| 1233 Benton Blvd Kansas City, MO | 4.0 | 2.5 | 1500 | $2,500 | $1.67 | 43d | 1 | 0.30mi |
| 901 Benton Blvd Unit 7 Kansas City, MO | 2.0 | 1.0 | 1100 | $1,202 | $1.09 | 43d | 1 | 0.34mi |
| 3435 E 7th St Kansas City, MO | 2.0 | 1.0 | 970 | $949 | $0.98 | 7d | 1 | 0.35mi |
| 916 Bellefontaine Ave Kansas City, MO | 3.0 | 1.5 | 1399 | $1,650 | $1.18 | 16d | 1 | 0.42mi |
| 2834 E 10th St Kansas City, MO | 2.0 | 1.5 | 1020 | $1,250 | $1.23 | 43d | 1 | 0.51mi |
| 2826 E 10th St Kansas City, MO | 2.0 | 1.5 | 1020 | $1,250 | $1.23 | 43d | 1 | 0.52mi |
| 815 Elmwood Ave Kansas City, MO | 3.0 | 1.5 | 1302 | $1,600 | $1.23 | 14d | 1 | 0.63mi |
| 3510 Garner Ave Kansas City, MO | 3.0 | 2.0 | 1536 | $1,400 | $0.91 | 3d | 1 | 0.68mi |
| 3305 E 19th St Kansas City, MO | 2.0 | 1.0 | 1500 | $1,200 | $0.80 | 43d | 1 | 0.71mi |
| 1805 Jackson Ave Kansas City, MO | 4.0 | 2.0 | 1250 | $1,250 | $1.00 | 43d | 1 | 0.71mi |
| 1603 Elmwood Ave Kansas City, MO | 2.0 | 1.0 | 1064 | $1,031 | $0.97 | 12d | 1 | 0.72mi |
| 504 Bellefontaine Ave Unit 2 Kansas City, MO | 2.0 | 2.0 | 1500 | $1,300 | $0.87 | 43d | 1 | 0.75mi |
| 1812 Elmwood Ave Kansas City, MO | 3.0 | 1.0 | 1650 | $1,600 | $0.97 | 16d | 1 | 0.84mi |
| 1905 Kensington Ave Kansas City, MO | 3.0 | 2.0 | 1285 | $1,325 | $1.03 | 23d | 1 | 0.84mi |
| 3201 E 20th St Kansas City, MO | 2.0 | 1.0 | 900 | $1,050 | $1.17 | 23d | 1 | 0.84mi |
| 3429 Morrell Ave Kansas City, MO | 4.0 | 1.5 | 1800 | $1,650 | $0.92 | 7d | 1 | 0.91mi |
| 311 Bellefontaine Ave Kansas City, MO | 3.0 | 2.0 | 1360 | $2,200 | $1.62 | 43d | 1 | 0.91mi |
| 412 Montgall Ave Unit 412 Kansas City, MO | 2.0 | 2.0 | 900 | $1,200 | $1.33 | 43d | 1 | 0.92mi |
| 3523 Saint John Ave Kansas City, MO | 3.0 | 1.0 | 1500 | $995 | $0.66 | 23d | 1 | 0.96mi |
| 414 Prospect Ave Unit 1 Kansas City, MO | 2.0 | 1.0 | 900 | $1,295 | $1.44 | 7d | 1 | 0.98mi |
| 2900 E 21st St Kansas City, MO | 3.0 | 1.5 | 897 | $1,650 | $1.84 | 16d | 1 | 0.98mi |
| 2003 Wabash Ave Unit B Kansas City, MO | 3.0 | 2.0 | 1200 | $1,095 | $0.91 | 23d | 1 | 1.07mi |
| 203 N Indiana Ave Unit 209 Indiana Kansas City, MO | 2.0 | 1.0 | 1500 | $1,400 | $0.93 | 43d | 1 | 1.09mi |
| 612 Garfield Ave Kansas City, MO | 1.0–2.0 | 1.0–2.0 | 900 | $1,875 | $2.08 | 1d | 44 | 1.16mi |
| 2419 Bales Ave Kansas City, MO | 3.0 | 1.5 | 1116 | $1,500 | $1.34 | 3d | 1 | 1.18mi |
| 2413 College Ave Kansas City, MO | 2.0 | 2.0 | 1022 | $1,225 | $1.20 | 23d | 1 | 1.18mi |
| 3921 Norledge Ave Unit 2E Kansas City, MO | 2.0 | 1.0 | 900 | $950 | $1.06 | 43d | 1 | 1.19mi |
| 218 N Elmwood Ave Kansas City, MO | 4.0 | 2.0 | 1184 | $1,500 | $1.27 | 43d | 1 | 1.22mi |
| 2424 Norton Ave Unit B Kansas City, MO | 3.0 | 1.0 | 982 | $1,150 | $1.17 | 16d | 1 | 1.24mi |
| 220 Brooklyn Ave Unit 220-2 Kansas City, MO | 2.0 | 1.0 | 1000 | $1,295 | $1.29 | 20d | 1 | 1.25mi |
| 220 Brooklyn Ave Kansas City, MO | 2.0 | 1.0 | 1000 | $1,295 | $1.29 | 7d | 1 | 1.25mi |
| 4405 Norledge Ave Kansas City, MO | 3.0 | 1.0 | 1510 | $1,600 | $1.06 | 43d | 1 | 1.25mi |
| 347 Maple Blvd Kansas City, MO | 3.0 | 1.5 | 1246 | $1,350 | $1.08 | 23d | 1 | 1.26mi |
| 129 Brooklyn Ave Kansas City, MO | 2.0 | 1.0 | 1225 | $1,195 | $0.98 | 10d | 1 | 1.28mi |
| 105 Brooklyn Ave Kansas City, MO | 3.0 | 1.5 | 1152 | $1,250 | $1.09 | 4d | 1 | 1.33mi |
| 5213 Wilburn Ct Kansas City, MO | 3.0 | 1.0 | 1274 | $1,375 | $1.08 | 21d | 1 | 1.49mi |
Listing history 17 events
-
2026-06-18days on market $150,000 Active 70 DOM
-
2026-06-17days on market $150,000 Active 69 DOM
-
2026-06-16days on market $150,000 Active 68 DOM
-
2026-06-15days on market $150,000 Active 67 DOM
-
2026-06-13days on market $150,000 Active 65 DOM
-
2026-06-09days on market $150,000 Active 61 DOM
-
2026-06-08days on market $150,000 Active 60 DOM
-
2026-06-07days on market $150,000 Active 59 DOM
-
2026-06-05days on market $150,000 Active 56 DOM
-
2026-06-03days on market $150,000 Active 55 DOM
-
2026-06-02days on market $150,000 Active 54 DOM
-
2026-06-01days on market $150,000 Active 53 DOM
-
2026-05-31days on market $150,000 Active 52 DOM
-
2026-04-09$150,000 Active 826-char remark
Show marketing remark (826 chars)
Charming 3 bedroom, 1 bath two story home located less than 10 minutes from downtown Kansas City with excellent highway access. This inviting home features a welcoming front porch, beautiful hardwood floors throughout, and light, neutral paint that enhances the abundance of natural light from ample windows. The kitchen offer generous cabinetry for storage, while the cozy family room includes a fireplace perfect for relaxing evenings. Enjoy outdoor living on the spacious back patio, ideal for grilling and entertaining, overlooking a nice size yard. Additional highlights include a designated laundry room, an updated bathroom with a shower/tub combo, and an unfinished basement providing excellent storage space. Move in ready and full of charm, don't miss this one! * * AC condensor to be installed prior to closing
-
2010-12-29historical
-
2010-11-15$59,000
-
1989-08-18soldstatus
ⓘ Source: listings_history table (triggers on properties + properties_extension) + one-shot
backfill from property_details.listing_events for pre-trigger history.
Tax reassessment forecast MO · Resets to sale price
- Current annual tax
- $611 · $51/mo
- Projected year-2 tax
- $1,455 · $121/mo
- Expected delta
- +$844/yr (+$70/mo · 138.1%)
ⓘ Screening estimate from a state-policy table — verify with the county assessor before closing.
Climate risk First Street
- Flood 1/10 Low FEMA zone X (unshaded) · 0% chance over 30 yrs
- Wildfire 1/10 Low
- Heat 4/10 Moderate 7 d/yr ≥106°F today · 17 d/yr by 30 yrs out
- Wind 2/10 Low
- Air quality 3/10 Moderate 2 unhealthy d/yr today · 3 by 30 yrs out
Nearby sold comps map
Loading sold comps map…
Walkable amenities ~0.75 mi
Loading nearby amenities…
Taxation est. · year 1
- Rental income
- $17,313
- − Mortgage interest
- −$8,402
- − Property taxes
- −$611
- − Insurance
- −$750
- − Repairs & maintenance
- −$1,385
- − Management
- −$1,385
- − Depreciation
- −$4,364
- Taxable income
- $416
- Est. tax owed @ 24.0%
- −$100
- After-tax cash flow
- $2,777/yr
For passive investors: Depreciation is non-cash, so a rental often shows a tax loss while cash-flowing — sheltering income. Rental losses are passive: they offset passive income freely, and up to $25,000/yr can offset ordinary (W-2) income if you actively participate and your MAGI is under $100k (phasing out to $0 by $150k); unused losses carry forward. On sale, claimed depreciation is recaptured at up to 25%, and gains may owe capital-gains tax (a 1031 exchange can defer both). Figures are a year-1 estimate at your 24.0% rate — not tax advice; consult a CPA.
Schools (NCES district)
- District
- Kansas City 33
- NCES district ID
- 2916400
- Math proficiency
- 12% ▼ -8.00%
- Reading proficiency
- 24% ▬ 0.00%
- Median HH income
- $35,227
- Composite
- 14.8/100
- National rank
- #9387
- State rank
- #308 of 324 in MO
Livability — Kansas City
- Score
- 78/100
- State rank
- #28
- US rank
- #2671
Category grades
Schools grade is shown separately in the Schools card above.
Census & demographics
- Census place
- Kansas City, MO
- County
- Jackson County · 687,798 people
- City population
- 439,467
- Metro
- Kansas City, MO-KS
- Population (ZIP)
- 17,668
- Household income
- $33,111
- Rent vs Own
- Severe rent burden
- 1943.0
Population outlook (Jackson County) Hauer SSP2
- Today (2025)
- 719,589 people
- By 2030
- 731,456 · +1.6%
- By 2040
- 746,689 · +3.8%
- By 2050
- 749,289 · +4.1%
- By 2075
- 736,227 · +2.3%
- By 2100
- 668,210 · -7.1%
Race, ethnicity, and origin ACS 2023
- Neighborhood character
- Diverse neighborhood (Simpson 0.65)
- Race & ethnicity
- Black 42% Hispanic / Latino 40% Two or more races 13% White 12% Native American 1%
- Hispanic origin (detail)
- Mexican 28%
- Foreign-born
- 20% · Canada, Vietnam
- Languages at home
- 67% English-only · Spanish 29%
Political lean MEDSL · Jackson
- 2024 margin
- D (+19.3) · D 58.9% · R 39.5% · Other 1.6%
- 2008→2024 swing
- -6.1pp toward R · 2008: 25.4pp · 2024: 19.3pp
- All cycles
- 2024: D+19.3 2020: D+22.0 2016: D+16.6 2012: D+19.0 2008: D+25.4
Not yet ingested
- Civics
- —
Market trends
- HPI YoY
- ▼ -7.88%
- Current HPI
- 289.2468
- Rent YoY
- ▲ 0.94%
- Metro
- Kansas City, MO-KS
- State GDP YoY
- ▲ 1.84%
- F500 in state
- 20
Industry mix (Fortune 500 HQ in MO)
| Industry | F500 HQs | Revenue |
|---|---|---|
| Healthcare | 1 | $163B |
|
||
| Insurance | 1 | $21B |
|
||
| Industrial Technology | 1 | $17B |
|
||
| Retail | 1 | $16B |
|
||
| Industrial Distribution | 1 | $10B |
|
||
| Utilities | 1 | $9B |
|
||
Price history
+154.2% since first listed4 events — show timeline
- 2026-04-09 Listed $150,000 Heartland MLS as Distributed by MLS Grid
- 2010-12-29 Listing Removed — Heartland MLS as Distributed by MLS Grid
- 2010-11-15 Listed $59,000 Heartland MLS as Distributed by MLS Grid
- 1989-08-18 Sold (Public Records) — Public Records
Property tax history
+4.7%/yrLatest (2025): $611 · -26.3% YoY. Source: county tax records.
Cash-flow waterfall
monthlySold comps — $/sqft
last 12 mo · ≤1 miLoading sold comps…