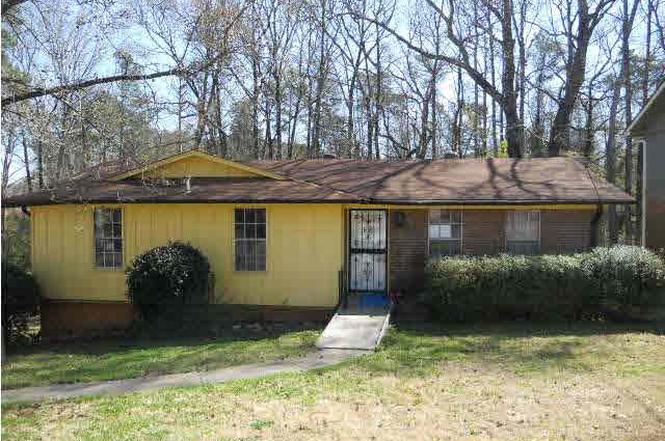
1125 Grand Blvd · Birmingham, AL
Flood risk 1/10 · Minimal
- FEMA flood zone
- X (unshaded)
- Chance of flooding over 30 yrs
- 0.0%
- Est. flood insurance / yr
- $473 – $860
Fire risk 4/10 · Minor
- Est. fire insurance / yr
- $916 – $1,700
Heat risk 5/10 · Moderate
- Hot days now (above 106°F)
- 7 days/yr
- Hot days in 30 yrs
- 18 days/yr
Wind risk 6/10 · Moderate
- Chance of severe wind over 30 yrs
- 27.0%
Air-quality risk 4/10 · Minor
- Unhealthy air days now
- 4 days/yr
- Unhealthy air days in 30 yrs
- 8 days/yr
Risk factors via First Street. Map © Google.
Why this score? — see what drove the D+ grade
The composite is a weighted blend of 9 inputs, each scored 0–100. Each bar is that input's sub-score; the figure is the points it added to the 100-point composite (weight × sub-score).
- Cash flow +15.8/30.0
- ARV discount +15.0/15.0
- DSCR +4.9/10.0
- 1% rule +4.1/10.0
- Livability +3.4/5.0
- Rent growth +2.7/5.0
- Condition / age +2.5/5.0
- Schools +0.9/10.0
- Appreciation +0.0/10.0
$145,000
🖨 Deal sheet (PDF) 📄 Offer letter ✓ Due diligence
Listing remarks MLS
3 Bedroom, 2 Bath home - Update to make your own! Right of Redemption may apply.
Key facts
- 0.23 acre lot
- Garage
- Built 1978
Neighborhood map
What this means for you Summary
Snapshot
- This is a 3-bed/2.0-bath single-family listed at $145k.
Deal economics
- At list price, monthly cash flow is $65 ($786/yr) — positive.
- The deal already cash-flows at list — no discount required.
- To meet the 1% rule (rent ≥ 1% of price), the offer needs to be $132k (8.6% below list).
- Recommended offer: $128k (12.0% below list) — sets the bar for market timing.
Location & tenants
- Location reads 67/100 on livability (#78 in AL) — a middle-class / working-renter tenant base. Strengths: commute A+, cost of living A+, housing A+; Watch: amenities C-, crime F, employment F.
- Birmingham City (urban): math 4% / reading 20% proficiency, ranked #116 of 129 in AL (top 90%) — low school quality limits family demand, transient renter base, plan for 1-2y turnover; 82% free/reduced lunch — lower-income household profile, screen leases tightly.
- Zoned schools: South Hampton K8 (math 4% / reading 22%, grade F, #532 of 627 statewide, top 85%, 513 students, 86% FRL) — zoned schools at 86% FRL track the district average.
- Market conditions: Rents flat; 116 active listings in the ZIP; 25 comparable units currently listed for rent nearby; rentals at typical pace (median 21d on market — plan ~3-4 weeks tenant-placement turnaround); 2,114 units permitted in Jefferson County in 2024 (556 in 5+ unit buildings).
Forward outlook
- Local home prices are declining (-3.0%/yr); year-one equity from $1k of loan paydown is wiped out by about $4k of value loss. Plan a longer hold.
- Jefferson County population projected to shrink 4% by 2050 — rents likely to lag national; underwrite the cash flow, not the appreciation.
Negotiation context
- It's been on market 294 days — a 12% lower offer ($128k) is reasonable based on typical stale-listing flexibility.
- 4 sale attempts since 13y ago; this cycle's ask has dropped $20k (12%) from the opening price — seller is motivated, your offer sets the floor, not the list.
Risks & watch-outs
- Climate carrying-cost: major wind risk, 27% chance of damaging wind over 30y; extreme-heat days projected 7→18/yr by 2055 (HVAC capex compounding) — expect insurance premiums to compound above CPI over the hold.
Questions for the listing agent
- It's been on market 294 days. Have you received any prior offers? Is the seller open to a 12% concession, seller financing, or rate buy-down credit?
- Built in 1978 — when were the roof, HVAC, electrical panel, plumbing, and water heater last replaced?
- Why hasn't it sold? Are there any deal-killer items the seller is aware of (foundation, flood, title, zoning, code violations)?
- Is there a deadline driving the sale (1031 exchange, divorce, estate, relocation)? That informs how much negotiation room exists.
- Schools are F-rated, which usually means shorter tenancies and higher turnover. Who's the typical renter profile here, and what's been the actual vacancy rate?
- Crime grade is F in this area — have there been break-ins, vandalism, or insurance claims at this property in the last 3 years? What carrier currently insures it and at what premium?
- The area grade is low — what's the realistic commute time and amenity access for the typical tenant pool here? Any planned neighborhood developments (good or bad) we should know about?
- What's the average days-on-market for RENTAL listings here right now (not sales)? A rising rental-DOM trend means longer vacancies and softer asking-rent achievability than the comps imply.
- What's the recent tenant-quality profile in this submarket — average credit score on applications, eviction rate, late-payment / NSF rate, and stable-employment percentage? A property-management company in the area should have these aggregated.
- How much new for-sale + rental construction is in the pipeline within 1–3 miles? Heavy new supply typically softens prices + rents 12–24 months out; constrained supply supports both.
Investment metrics
- 1% rule
- 0.91% ✗
- Cap rate
- 6.83%
- Cash-on-cash
- 1.94%
- DSCR
- 1.09
- GRM
- 9.1
CMA / ARV
- ARV (on-the-fly)
- $238,280
- Comps found
- 12
Show comp detail 12 sales within ~0.75 mi
| Address | Dist | Beds/Ba | Sqft | Sold | Price | $/sf | Match |
|---|---|---|---|---|---|---|---|
| 1165 Grand Blvd | 0.15mi | 3/2.5 | 1,576 (-7%) | 2mo | $230,000 | $146 | 77 |
| 1120 Grand Blvd | 0.03mi | 4/2.5 (+1) | 1,560 (-8%) | 3mo | $130,000 | $83 | 75 |
| 1137 Circle Trl | 0.12mi | 3/2.5 | 1,890 (+11%) | 4mo | $265,000 | $140 | 70 |
| 1224 Circle Trl | 0.15mi | 3/3.0 | 1,728 (+2%) | 22mo | $200,000 | $116 | 68 |
| 939 Brandy Ln | 0.58mi | 3/1.0 | 1,652 (-3%) | 3mo | $107,500 | $65 | 62 |
| 1312 U W Clemon Dr | 0.26mi | 3/2.5 | 1,604 (-6%) | 20mo | $235,000 | $147 | 60 |
| 1050 Plum Ln | 0.56mi | 3/2.0 | 1,498 (-12%) | 2mo | $93,000 | $62 | 52 |
| 987 Chichester Dr | 0.64mi | 4/2.0 (+1) | 1,632 (-4%) | 8mo | $187,500 | $115 | 51 |
| 1607 U W Clemon Dr | 0.49mi | 4/3.0 (+1) | 1,774 (+4%) | 20mo | $272,990 | $154 | 45 |
| 1668 U W Clemon Dr | 0.55mi | 4/2.5 (+1) | 1,880 (+10%) | 8mo | $279,999 | $149 | 43 |
| 1382 Tomahawk Rd | 0.75mi | 3/3.0 | 1,815 (+7%) | 8mo | $245,000 | $135 | 43 |
| 1503 Hollins Dr | 0.49mi | 4/3.0 (+1) | 1,774 (+4%) | 22mo | $264,990 | $149 | 43 |
Match score weights: distance 35% · size 25% · config 20% · recency 20%. Top-matched comps best support the ARV.
Projected returns pro-forma
-3.0% appreciation · 0.74% rent growth · sell at horizon
- IRR
- -15.7%
- Equity multiple
- 0.45×
- Total profit
- $-22,265
- Equity at exit
- $21,620
- IRR
- -11.7%
- Equity multiple
- 0.37×
- Total profit
- $-25,544
- Equity at exit
- $12,537
Cash invested: $40,600 (down + closing). Projections, not guarantees.
Landlord ↔ Tenant lean methodology
- Overall (STATE)
- 90 Strongly Landlord-Friendly
- State Alabama
- 90 Strongly Landlord-Friendly · R+15
- County
- — inherits STATE
- City
- — inherits STATE
ZIP-level market 35214
- Home prices YoY
- -20.0%
- Rents YoY
- 0.7%
- Active inventory
- 116
- Price-to-rent
- 9.1×
Monthly cashflow live
- Estimated rent
- $1,325 high interval (Pro) →
- Mortgage (P&I)
- −$760
- Tax from tax record
- −$160 /mo · $1,924/yr
- Insurance
- −$60
- HOA
- −$0
- Vacancy / Maint / Mgmt
- −$278
- Net cashflow
- $65
Break-even live
Sensitivity live
| Price | -10% $148 | -5% $107 | +0% $65 | +5% $24 | +10% $-17 |
|---|---|---|---|---|---|
| Rent | -10% $-39 | -5% $13 | +0% $65 | +5% $118 | +10% $170 |
| Rate | -1.0pp $138 | -0.5pp $102 | base $65 | +0.5pp $28 | +1.0pp $-10 |
UW: 25.0% down · 7.5% · 30yr · 1.5% tax · 5.0% vac · 8.0% maint · 8.0% mgmt
Financing live
Cash to close
- Down payment
- $36,250
- Closing costs
- $4,350
- Reserves months
- —
- Total cash needed
- —
Loan-product check · same deal, 3 products live
Conventional
25% down · 7.5% · 30yr
- Down + closing
- —
- Monthly P&I
- —
- Monthly cashflow
- —
- DSCR
- —
- Eligible?
- —
Personal DTI + credit; lowest rate.
DSCR
20% down · 8.5% · 30yr
- Down + closing
- —
- Monthly P&I
- —
- Monthly cashflow
- —
- DSCR
- —
- Eligible?
- —
No personal income docs; deal must DSCR.
Hard money
10% down · 12.0% · 12mo
- Down + closing
- —
- Monthly P&I
- —
- Monthly cashflow
- —
- DSCR
- —
- Eligible?
- —
Short-term bridge; refi at stabilization.
Rent comps 25 comps
| Address | Beds | Baths | Sqft | Rent | $/sqft | DOM | Units | Dist |
|---|---|---|---|---|---|---|---|---|
| 120 Dewberry Ln Birmingham, AL | 3.0 | 2.0 | 1485 | $1,510 | $1.02 | 21d | 1 | 0.52mi |
| 939 Brandy Ln Birmingham, AL | 3.0 | 1.0 | 1652 | $1,180 | $0.71 | 45d | 1 | 0.59mi |
| 115 Crabapple Ln Birmingham, AL | 1.0–3.0 | 1.0–2.0 | 906 | $1,027 | $1.13 | 13d | 19 | 0.61mi |
| 634 Broken Bow Cir Birmingham, AL | 3.0 | 2.0 | 1890 | $1,625 | $0.86 | 21d | 1 | 0.75mi |
| 1500 Cherry Ave Birmingham, AL | 3.0 | 1.0 | 1144 | $1,225 | $1.07 | 4d | 1 | 0.84mi |
| 1512 Cherry Ave Birmingham, AL | 4.0 | 1.0 | 1146 | $1,200 | $1.05 | 45d | 1 | 0.88mi |
| 305 Rose Hill Rd Birmingham, AL | 3.0 | 1.5 | 1285 | $1,200 | $0.93 | 12d | 1 | 0.94mi |
| 944 Cagle Rd Birmingham, AL | 3.0 | 2.0 | 1174 | $1,425 | $1.21 | 25d | 1 | 0.94mi |
| 161 Cindy Ln Birmingham, AL | 3.0 | 2.0 | 1388 | $1,425 | $1.03 | 25d | 1 | 0.95mi |
| 609 Cherry Ave Birmingham, AL | 3.0 | 1.5 | 1104 | $1,495 | $1.35 | 25d | 1 | 1.07mi |
| 1147 Oakley Dr Birmingham, AL | 3.0 | 1.0 | 1352 | $1,250 | $0.92 | 45d | 1 | 1.08mi |
| 1143 Oakley Dr Birmingham, AL | 3.0 | 1.0 | 1066 | $1,300 | $1.22 | 45d | 1 | 1.09mi |
| 1425 Hibernian St Birmingham, AL | 3.0 | 1.0 | 1152 | $1,200 | $1.04 | 25d | 1 | 1.14mi |
| 408 Miles Ave Birmingham, AL | 3.0 | 2.0 | 1377 | $1,050 | $0.76 | 23d | 1 | 1.14mi |
| 779 Heflin Ave E Birmingham, AL | 3.0 | 1.5 | 1052 | $1,100 | $1.05 | 21d | 1 | 1.22mi |
| 1533 Choctaw Dr Birmingham, AL | 3.0 | 1.0 | 1241 | $1,175 | $0.95 | 45d | 1 | 1.24mi |
| 225 Bayberry Rd Birmingham, AL | 3.0 | 1.0 | 1496 | $1,261 | $0.84 | 21d | 1 | 1.24mi |
| 1647 Cherry Ave Birmingham, AL | 3.0 | 2.0 | 1079 | $1,150 | $1.07 | 13d | 1 | 1.28mi |
| 213 Beech Ave Birmingham, AL | 3.0 | 1.0 | 1288 | $1,000 | $0.78 | 21d | 1 | 1.29mi |
| 528 Lamplighter Ln Birmingham, AL | 3.0 | 1.0 | 1114 | $1,220 | $1.10 | 5d | 1 | 1.31mi |
| 629 Lanett Ave Birmingham, AL | 3.0 | 1.0 | 1092 | $1,200 | $1.10 | 45d | 1 | 1.35mi |
| 1204 Pratt Hwy Birmingham, AL | 3.0 | 1.0 | 1124 | $1,125 | $1.00 | 17d | 1 | 1.37mi |
| 656 Kenwood Dr Birmingham, AL | 3.0 | 1.0 | 1252 | $1,175 | $0.94 | 17d | 1 | 1.38mi |
| 617 Ozark Ct Birmingham, AL | 3.0 | 2.0 | 1242 | $1,195 | $0.96 | 5d | 1 | 1.42mi |
| 1208 2nd St Birmingham, AL | 3.0 | 2.0 | 1506 | $1,050 | $0.70 | 45d | 1 | 1.43mi |
Listing history 12 events
-
2026-02-20status Pending
-
2026-01-28price $145,000
-
2026-01-12status Active
-
2026-01-01historical
-
2025-10-06status Active
-
2025-09-13historical
-
2025-08-28price $155,000
-
2025-03-20$165,500 Active
-
2017-05-23soldstatus $6,335,000
-
2013-07-02soldstatus $36,100 80-char remark
Show marketing remark (80 chars)
3 Bedroom, 2 Bath home - Update to make your own! Right of Redemption may apply.
-
2013-04-11$40,000 80-char remark
Show marketing remark (80 chars)
3 Bedroom, 2 Bath home - Update to make your own! Right of Redemption may apply.
-
1981-04-01soldstatus $59,200
ⓘ Source: listings_history table (triggers on properties + properties_extension) + one-shot
backfill from property_details.listing_events for pre-trigger history.
Tax reassessment forecast AL · Resets to sale price
- Current annual tax
- $1,924 · $160/mo
- Projected year-2 tax
- $1,924 · $160/mo
- Expected delta
- $0/yr ($0/mo · 0.0%)
ⓘ Screening estimate from a state-policy table — verify with the county assessor before closing.
Climate risk First Street
- Flood 1/10 Low FEMA zone X (unshaded) · 0% chance over 30 yrs
- Wildfire 4/10 Moderate
- Heat 5/10 Major 7 d/yr ≥106°F today · 18 d/yr by 30 yrs out
- Wind 6/10 Major 27% chance of damaging wind over 30 yrs
- Air quality 4/10 Moderate 4 unhealthy d/yr today · 8 by 30 yrs out
Nearby sold comps map
Loading sold comps map…
Walkable amenities ~0.75 mi
Loading nearby amenities…
Taxation est. · year 1
- Rental income
- $15,898
- − Mortgage interest
- −$8,122
- − Property taxes
- −$1,924
- − Insurance
- −$725
- − Repairs & maintenance
- −$1,272
- − Management
- −$1,272
- − Depreciation
- −$4,218
- Taxable loss
- −$1,635
- Est. tax savings @ 24.0%
- +$392
- After-tax cash flow
- $1,178/yr
For passive investors: Depreciation is non-cash, so a rental often shows a tax loss while cash-flowing — sheltering income. Rental losses are passive: they offset passive income freely, and up to $25,000/yr can offset ordinary (W-2) income if you actively participate and your MAGI is under $100k (phasing out to $0 by $150k); unused losses carry forward. On sale, claimed depreciation is recaptured at up to 25%, and gains may owe capital-gains tax (a 1031 exchange can defer both). Figures are a year-1 estimate at your 24.0% rate — not tax advice; consult a CPA.
Schools (NCES district)
- District
- Birmingham City
- NCES district ID
- 0100390
- Math proficiency
- 4% ▼ -17.00%
- Reading proficiency
- 20% ▼ -4.00%
- Median HH income
- $31,988
- Composite
- 9.49/100
- National rank
- #9850
- State rank
- #116 of 129 in AL
Livability — Birmingham
- Score
- 67/100
- State rank
- #78
- US rank
- #10412
Category grades
Schools grade is shown separately in the Schools card above.
Census & demographics
- Census place
- Birmingham, AL
- County
- Jefferson County · 527,445 people
- City population
- 210,422
- Metro
- Birmingham-Hoover, AL
- Population (ZIP)
- 17,027
- Household income
- $56,383
- Rent vs Own
- Severe rent burden
- 578.0
Population outlook (Jefferson County) Hauer SSP2
- Today (2025)
- 669,185 people
- By 2030
- 669,694 · +0.1%
- By 2040
- 661,388 · -1.2%
- By 2050
- 643,086 · -3.9%
- By 2075
- 577,267 · -13.7%
- By 2100
- 474,758 · -29.1%
Race, ethnicity, and origin ACS 2023
- Neighborhood character
- Predominantly Black (77%)
- Race & ethnicity
- Black 77% White 18% Two or more races 2%
- Foreign-born
- 1% · Canada
- Languages at home
- 98% English-only · Spanish 2%
Political lean MEDSL · Jefferson
- 2024 margin
- D (+10.4) · D 54.6% · R 44.2% · Other 1.2%
- 2008→2024 swing
- +5.4pp toward D · 2008: 5.1pp · 2024: 10.4pp
- All cycles
- 2024: D+10.4 2020: D+13.2 2016: D+7.2 2012: D+6.0 2008: D+5.1
Not yet ingested
- Civics
- —
Market trends
- HPI YoY
- ▼ -54.48%
- Current HPI
- 218.5233
- Rent YoY
- ▲ 0.74%
- Metro
- Birmingham-Hoover, AL
- State GDP YoY
- ▲ 2.94%
- F500 in state
- 4
Industry mix (Fortune 500 HQ in AL)
| Industry | F500 HQs | Revenue |
|---|---|---|
| Financial Services | 1 | $8B |
|
||
| Healthcare | 1 | $5B |
|
||
Price history
+144.9% since first listed12 events — show timeline
- 2026-02-20 Pending — Greater Alabama MLS
- 2026-01-28 Price Changed $145,000 Greater Alabama MLS
- 2026-01-12 Relisted — Greater Alabama MLS
- 2026-01-01 Delisted — Greater Alabama MLS
- 2025-10-06 Relisted — Greater Alabama MLS
- 2025-09-13 Delisted — Greater Alabama MLS
- 2025-08-28 Price Changed $155,000 Greater Alabama MLS
- 2025-03-20 Listed $165,500 Greater Alabama MLS
- 2017-05-23 Sold (Public Records) $6,335,000 Public Records
- 2013-07-02 Sold (MLS) $36,100 Greater Alabama MLS
- 2013-04-11 Listed $40,000 Greater Alabama MLS
- 1981-04-01 Sold (Public Records) $59,200 Public Records
Property tax history
+1.5%/yrLatest (2025): $1,924 · +5.6% YoY. Source: county tax records.
Cash-flow waterfall
monthlySold comps — $/sqft
last 12 mo · ≤1 miLoading sold comps…