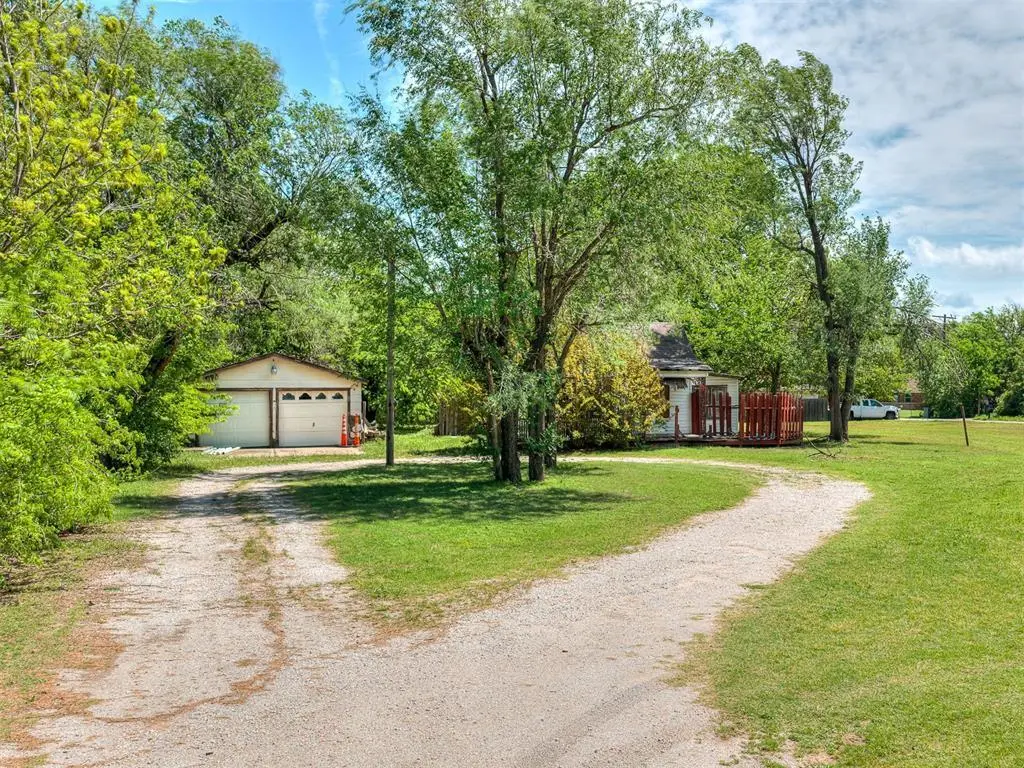
816 S Sooner Rd · Midwest City, OK
Flood risk 1/10 · Minimal
- FEMA flood zone
- X (unshaded)
- Chance of flooding over 30 yrs
- 0.0%
- Est. flood insurance / yr
- $507 – $1,088
Fire risk 1/10 · Minimal
- Est. fire insurance / yr
- $2,463 – $4,575
Heat risk 5/10 · Moderate
- Hot days now (above 107°F)
- 7 days/yr
- Hot days in 30 yrs
- 18 days/yr
Wind risk 3/10 · Minor
- Chance of severe wind over 30 yrs
- 4.0%
Air-quality risk 2/10 · Minimal
- Unhealthy air days now
- 1 days/yr
- Unhealthy air days in 30 yrs
- 2 days/yr
Risk factors via First Street. Map © Google.
Why this score? — see what drove the B grade
The composite is a weighted blend of 9 inputs, each scored 0–100. Each bar is that input's sub-score; the figure is the points it added to the 100-point composite (weight × sub-score).
- Cash flow +28.6/30.0
- ARV discount +15.0/15.0
- DSCR +10.0/10.0
- 1% rule +7.5/10.0
- Livability +3.6/5.0
- Rent growth +3.2/5.0
- Condition / age +2.5/5.0
- Schools +1.2/10.0
- Appreciation +0.0/10.0
$99,900
🖨 Deal sheet 📄 Offer letter ✓ Due diligence
Listing remarks MLS
This is a HUD owned property subject to HUD regulations and bidding procedures uninsurable by HUD. Asset managed by MMREM and sold in as is condition. Go to HUDHomestore website for more information. Case # 421-336610.
Key facts
- Outstanding location
- Close to restaurants
- Potential rezoning
Tags
Property features AI
Finance
- Other: Lot measures approximately 87 x 305; Lot size about 0.64 acres; Property listed as active
- Financial info: Cash only or conventional financing accepted; Loan qualification possible; Assumable: No
- HOA & community: No mandatory association dues
Exterior
- Parking: 2-car garage
- Utilities: No flood insurance required
- Home design: Single family residence; One level; Faces west; Residential property; Existing property
- Construction: Frame construction; Composition roof; Built on conventional foundation
- Exterior features: No notable exterior features; Interior lot
Interior
- Kitchen: Range
- Bedrooms: 2 bedrooms
- Bathrooms: 1 full bathroom
- Heating & cooling: No heating; No cooling
- Interior features: No fireplace; No in-law plan
- Laundry & utility: Conventional foundation
Neighborhood map
What this means for you Summary
Snapshot
- This is a 2-bed/1.0-bath single-family listed at $100k.
Deal economics
- At list price, monthly cash flow is $330 ($4k/yr) — positive.
- The deal already cash-flows at list — no discount required.
- Meets the 1% rule at list price ($1k rent vs $100k).
- Recommended offer: $94k (6.0% below list) — sets the bar for market timing.
- Cap rate 10.3% vs local median 5.6% in Midwest City — top-decile yield for the area; either an underpriced asset or a hidden risk that comps aren't pricing in. Stress-test before assuming the spread holds.
Location & tenants
- Location reads 71/100 on livability (#30 in OK) — a middle-class / working-renter tenant base. Strengths: cost of living A+, housing A+, health & safety A; Watch: crime D+, employment D, amenities F.
- Midwest City-Del City (suburban): math 10% / reading 17% proficiency, ranked #231 of 270 in OK (top 86%) — low school quality limits family demand, transient renter base, plan for 1-2y turnover.
- Zoned schools: Epperly Heights Es (math 2% / reading 8%, grade F, #766 of 845 statewide, top 94%, 644 students, 0% FRL); Del City Hs (math 5% / reading 15%, grade F, #361 of 447 statewide, top 94%, 1,158 students, 0% FRL) — zoned schools average 0% FRL vs 57% district-wide (57 pts lower); this property's tenant base skews higher-income than the district average.
- Market conditions: Rents rising (+3.0%/yr); 171 active listings in the ZIP; 40 comparable units currently listed for rent nearby; rentals at typical pace (median 21d on market — plan ~3-4 weeks tenant-placement turnaround); 5,365 units permitted in Oklahoma County in 2024 (569 in 5+ unit buildings).
Forward outlook
- Local home prices are declining (-3.0%/yr); year-one equity from $691 of loan paydown is wiped out by about $3k of value loss. Plan a longer hold.
- Oklahoma County population projected at +41% by 2050 — long-run rental-demand tailwind backs the buy-and-hold thesis.
- At projected returns (-3.0% appreciation + 3.0% rent growth), your $28k cash investment doubles in ~9 years — after that, you're playing with house money.
Negotiation context
- It's been on market 64 days — a 6% lower offer ($94k) is reasonable based on typical stale-listing flexibility.
- 6 sale attempts since 20y ago with the ask held roughly flat each time — persistent listings suggest the price (not the market) is what's stuck; bring a comps-based counter.
- Current owner paid $20k; list at $100k implies a 399% gain — meaningful room to come down on a strong offer.
Risks & watch-outs
- Watch-outs: built in 1910 — expect roof / HVAC / electrical / plumbing capex.
- Climate carrying-cost: extreme-heat days projected 7→18/yr by 2055 (HVAC capex compounding) — expect insurance premiums to compound above CPI over the hold.
Questions for the listing agent
- It's been on market 64 days. Have you received any prior offers? Is the seller open to a 6% concession, seller financing, or rate buy-down credit?
- Built in 1910 — when were the roof, HVAC, electrical panel, plumbing, and water heater last replaced?
- Why hasn't it sold? Are there any deal-killer items the seller is aware of (foundation, flood, title, zoning, code violations)?
- Is there a deadline driving the sale (1031 exchange, divorce, estate, relocation)? That informs how much negotiation room exists.
- Schools are D-rated, which usually means shorter tenancies and higher turnover. Who's the typical renter profile here, and what's been the actual vacancy rate?
- Crime grade is D in this area — have there been break-ins, vandalism, or insurance claims at this property in the last 3 years? What carrier currently insures it and at what premium?
- What's the average days-on-market for RENTAL listings here right now (not sales)? A rising rental-DOM trend means longer vacancies and softer asking-rent achievability than the comps imply.
- What's the recent tenant-quality profile in this submarket — average credit score on applications, eviction rate, late-payment / NSF rate, and stable-employment percentage? A property-management company in the area should have these aggregated.
- How much new for-sale + rental construction is in the pipeline within 1–3 miles? Heavy new supply typically softens prices + rents 12–24 months out; constrained supply supports both.
Investment metrics
- 1% rule
- 1.25% ✓
- Cap rate
- 10.26%
- Cash-on-cash
- 14.17%
- DSCR
- 1.63
- GRM
- 6.6
CMA / ARV
- ARV (on-the-fly)
- $154,760
- Comps found
- 12
Show comp detail 12 sales within ~0.75 mi
| Address | Dist | Beds/Ba | Sqft | Sold | Price | $/sf | Match |
|---|---|---|---|---|---|---|---|
| 616 Leslie Dr | 0.36mi | 2/1.5 | 1,076 (+2%) | 2mo | $167,000 | $155 | 77 |
| 4801 Lisa Ln | 0.41mi | 3/1.5 (+1) | 1,010 (-5%) | 3mo | $132,000 | $131 | 64 |
| 513 Leslie Dr | 0.41mi | 3/1.5 (+1) | 978 (-8%) | 1mo | $156,000 | $160 | 60 |
| 4720 Trapp Dr | 0.52mi | 3/1.5 (+1) | 1,110 (+5%) | 4mo | $142,500 | $128 | 58 |
| 1133 W Peebly Dr | 0.75mi | 3/1.5 (+1) | 1,067 (+1%) | 1mo | $182,500 | $171 | 56 |
| 1800 N Mitchell Dr | 0.73mi | 3/1.5 (+1) | 1,038 (-2%) | 6mo | $142,900 | $138 | 51 |
| 6220 SE 11th St | 0.47mi | 3/1.0 (+1) | 933 (-12%) | 4mo | $155,000 | $166 | 50 |
| 4805 Leslie Dr | 0.50mi | 3/1.0 (+1) | 1,191 (+12%) | 2mo | $142,000 | $119 | 49 |
| 4925 Michael Pl | 0.50mi | 3/1.0 (+1) | 918 (-13%) | 1mo | $149,999 | $163 | 49 |
| 4713 Crest Pl | 0.74mi | 3/1.5 (+1) | 1,012 (-4%) | 3mo | $75,000 | $74 | 49 |
| 410 Vickie Dr | 0.57mi | 3/2.0 (+1) | 1,188 (+12%) | 4mo | $173,000 | $146 | 41 |
| 3001 N Peebly Dr | 0.69mi | 3/1.5 (+1) | 1,188 (+12%) | 4mo | $172,500 | $145 | 38 |
Match score weights: distance 35% · size 25% · config 20% · recency 20%. Top-matched comps best support the ARV.
Projected returns pro-forma
-3.0% appreciation · 2.99% rent growth · sell at horizon
- IRR
- 4.5%
- Equity multiple
- 1.17×
- Total profit
- $4,841
- Equity at exit
- $14,895
- IRR
- 13.9%
- Equity multiple
- 2.12×
- Total profit
- $31,258
- Equity at exit
- $8,638
Cash invested: $27,972 (down + closing). Projections, not guarantees.
Landlord ↔ Tenant lean methodology
- Overall (STATE)
- 83 Strongly Landlord-Friendly
- State Oklahoma
- 83 Strongly Landlord-Friendly · R+20
- County
- — inherits STATE
- City
- — inherits STATE
ZIP-level market 73110
- Rents YoY
- 3.0%
- Active inventory
- 171
- Price-to-rent
- 6.6×
Monthly cashflow live
- Estimated rent
- $1,253 high interval (Pro) →
- Mortgage (P&I)
- −$524
- Tax from tax record
- −$94 /mo · $1,125/yr
- Insurance
- −$42
- HOA
- −$0
- Vacancy / Maint / Mgmt
- −$263
- Net cashflow
- $330
Break-even live
UW: 25.0% down · 7.5% · 30yr · 1.5% tax · 5.0% vac · 8.0% maint · 8.0% mgmt
Financing live
Cash to close
- Down payment
- $24,975
- Closing costs
- $2,997
- Reserves months
- —
- Total cash needed
- —
Loan-product check · same deal, 3 products live
Conventional
25% down · 7.5% · 30yr
- Down + closing
- —
- Monthly P&I
- —
- Monthly cashflow
- —
- DSCR
- —
- Eligible?
- —
Personal DTI + credit; lowest rate.
DSCR
20% down · 8.5% · 30yr
- Down + closing
- —
- Monthly P&I
- —
- Monthly cashflow
- —
- DSCR
- —
- Eligible?
- —
No personal income docs; deal must DSCR.
Hard money
10% down · 12.0% · 12mo
- Down + closing
- —
- Monthly P&I
- —
- Monthly cashflow
- —
- DSCR
- —
- Eligible?
- —
Short-term bridge; refi at stabilization.
Rent comps 40 comps
| Address | Beds | Baths | Sqft | Rent | $/sqft | DOM | Units | Dist |
|---|---|---|---|---|---|---|---|---|
| 6001 SE 8th St Oklahoma City, OK | 3.0 | 2.0 | 1435 | $1,900 | $1.32 | 1d | 1 | 0.27mi |
| 4812 Gina Pl Oklahoma City, OK | 3.0 | 1.5 | 1138 | $1,100 | $0.97 | 23d | 1 | 0.37mi |
| 6000 E Reno Ave Oklahoma City, OK | 1.0–2.0 | 1.0–2.0 | 692 | $989 | $1.43 | 23d | 1 | 0.53mi |
| 4816 Michael Dr Oklahoma City, OK | 3.0 | 2.0 | 1497 | $1,525 | $1.02 | 14d | 1 | 0.55mi |
| 4625 Tinker Diagonal Oklahoma City, OK | 2.0 | 2.0 | 900 | $1,050 | $1.17 | 11d | 1 | 0.60mi |
| 4625 Tinker Diagonal Oklahoma City, OK | 3.0 | 3.0 | 1400 | $1,300 | $0.93 | 17d | 1 | 0.60mi |
| 6608 SE 15th St Oklahoma City, OK | 3.0 | 2.0 | 1103 | $1,425 | $1.29 | 21d | 1 | 0.83mi |
| 309 Spring Creek Rd Oklahoma City, OK | 3.0 | 1.0 | 1336 | $1,395 | $1.04 | 23d | 1 | 0.92mi |
| 4340 Woodedge Dr Oklahoma City, OK | 3.0 | 1.0 | 1026 | $1,250 | $1.22 | 2d | 1 | 0.94mi |
| 441 Hidden Creek Way Oklahoma City, OK | 3.0 | 2.0 | 1338 | $1,775 | $1.33 | 16d | 1 | 1.02mi |
| 1111 Jet Dr Oklahoma City, OK | 3.0 | 1.0 | 1067 | $1,095 | $1.03 | 21d | 1 | 1.08mi |
| 1111 Jet Dr Oklahoma City, OK | 3.0 | 1.0 | 1067 | $1,095 | $1.03 | 4d | 1 | 1.08mi |
| 4772 SE 23rd St Oklahoma City, OK | 3.0 | 1.0 | 1044 | $1,300 | $1.25 | 2d | 1 | 1.11mi |
| 4713 SE 23rd St Oklahoma City, OK | 3.0 | 1.0 | 750 | $1,095 | $1.46 | 23d | 1 | 1.14mi |
| 317 W Peach St Oklahoma City, OK | 2.0 | 1.0 | 878 | $1,045 | $1.19 | 3d | 1 | 1.15mi |
| 313 W Peach St Oklahoma City, OK | 2.0 | 1.0 | 724 | $975 | $1.35 | 17d | 1 | 1.17mi |
| 314 W Peach St Midwest City, OK | 2.0 | 1.0 | 736 | $950 | $1.29 | 23d | 1 | 1.18mi |
| 1700 Karen Dr Oklahoma City, OK | 2.0 | 1.0 | 748 | $950 | $1.27 | 23d | 1 | 1.21mi |
| 4765 SE 25th St Oklahoma City, OK | 2.0 | 1.0 | 864 | $895 | $1.04 | 4d | 1 | 1.22mi |
| 4010 SE 14th Pl Del City, OK | 3.0 | 2.0 | 1500 | $1,295 | $0.86 | 23d | 1 | 1.29mi |
| 2105 Maple Dr Midwest City, OK | 3.0 | 2.0 | 1032 | $1,295 | $1.25 | 23d | 1 | 1.29mi |
| 2904 Treight Creek Ln Midwest City, OK | 2.0 | 2.0 | 984 | $1,495 | $1.52 | 1d | 2 | 1.31mi |
| 204 Elm St Oklahoma City, OK | 3.0 | 2.0 | 1098 | $1,250 | $1.14 | 23d | 1 | 1.31mi |
| 1608 Breckenridge Dr Del City, OK | 2.0 | 1.0 | 820 | $1,050 | $1.28 | 2d | 1 | 1.32mi |
| 7122 SE 15th St Oklahoma City, OK | 2.0 | 1.0 | 816 | $1,100 | $1.35 | 4d | 1 | 1.33mi |
| 4769 SE 27th St Oklahoma City, OK | 3.0 | 1.0 | 1000 | $1,300 | $1.30 | 23d | 1 | 1.34mi |
| 2220 S Air Depot Blvd Oklahoma City, OK | 3.0 | 1.0 | 1020 | $1,395 | $1.37 | 23d | 1 | 1.34mi |
| 110 E Myrtle Dr Oklahoma City, OK | 3.0 | 1.5 | 1236 | $1,300 | $1.05 | 11d | 1 | 1.35mi |
| 3928 Teal Dr Oklahoma City, OK | 3.0 | 1.0 | 1033 | $1,200 | $1.16 | 17d | 1 | 1.38mi |
| 809 Markdrive Delcity Del City, OK | 3.0 | 1.5 | 1250 | $1,250 | $1.00 | 23d | 1 | 1.40mi |
| 4722 SE 27th St Oklahoma City, OK | 3.0 | 2.0 | 1130 | $1,175 | $1.04 | 23d | 1 | 1.40mi |
| 3939 SE 14th Pl Del City, OK | 3.0 | 2.0 | 1134 | $1,395 | $1.23 | 4d | 1 | 1.40mi |
| 3939 SE 14th Pl Del City, OK | 3.0 | 2.0 | 1134 | $1,395 | $1.23 | 23d | 1 | 1.40mi |
| 407 W Fairchild Dr Oklahoma City, OK | 3.0 | 1.0 | 1062 | $1,045 | $0.98 | 2d | 1 | 1.40mi |
| 210 W Jacobs Dr Oklahoma City, OK | 3.0 | 1.0 | 1200 | $1,200 | $1.00 | 23d | 1 | 1.43mi |
| 4613 SE 27th St Oklahoma City, OK | 2.0 | 1.0 | 768 | $1,050 | $1.37 | 23d | 1 | 1.43mi |
| 423 W Douglas Dr Oklahoma City, OK | 3.0 | 1.0 | 1014 | $1,095 | $1.08 | 21d | 1 | 1.44mi |
| 1817 Breckenridge Dr Del City, OK | 3.0 | 2.0 | 1155 | $1,295 | $1.12 | 23d | 1 | 1.45mi |
| 1817 Breckenridge Dr Del City, OK | 3.0 | 2.0 | 1155 | $1,295 | $1.12 | 2d | 1 | 1.45mi |
| 215 W McArthur Dr Oklahoma City, OK | 2.0 | 1.0–2.0 | 795 | $1,122 | $1.41 | 2d | 5 | 1.45mi |
Listing history 29 events
-
2026-06-18days on market $99,900 Active 64 DOM
-
2026-06-17days on market $99,900 Active 63 DOM
-
2026-06-16days on market $99,900 Active 62 DOM
-
2026-06-15days on market $99,900 Active 61 DOM
-
2026-06-13days on market $99,900 Active 59 DOM
-
2026-06-13days on market $99,900 Active 58 DOM
-
2026-06-09days on market $99,900 Active 55 DOM
-
2026-06-08days on market $99,900 Active 54 DOM
-
2026-06-07days on market $99,900 Active 53 DOM
-
2026-06-05days on market $99,900 Active 50 DOM
-
2026-06-03days on market $99,900 Active 49 DOM
-
2026-06-02days on market $99,900 Active 48 DOM
-
2026-06-01days on market $99,900 Active 47 DOM
-
2026-05-31days on market $99,900 Active 46 DOM
-
2026-04-15$99,900 Active
-
2026-04-08historical
-
2026-01-17price $124,900
-
2025-07-05status Active
-
2025-06-24status Pending
-
2024-08-14price $125,000
-
2024-05-16$155,000 Active
-
2011-03-30soldstatus $20,010 218-char remark
Show marketing remark (218 chars)
This is a HUD owned property subject to HUD regulations and bidding procedures uninsurable by HUD. Asset managed by MMREM and sold in as is condition. Go to HUDHomestore website for more information. Case # 421-336610.
-
2011-02-22$17,000 218-char remark
Show marketing remark (218 chars)
This is a HUD owned property subject to HUD regulations and bidding procedures uninsurable by HUD. Asset managed by MMREM and sold in as is condition. Go to HUDHomestore website for more information. Case # 421-336610.
-
2007-12-19historical
-
2007-01-23historical
-
2007-01-17$57,500
-
2006-08-03$59,000
-
1997-09-05soldstatus $53,000
-
1992-09-16soldstatus $20,000
ⓘ Source: listings_history table (triggers on properties + properties_extension) + one-shot
backfill from property_details.listing_events for pre-trigger history.
Tax reassessment forecast OK · Resets to sale price
- Current annual tax
- $1,125 · $94/mo
- Projected year-2 tax
- $1,125 · $94/mo
- Expected delta
- $0/yr ($0/mo · 0.0%)
ⓘ Screening estimate from a state-policy table — verify with the county assessor before closing.
Climate risk First Street
- Flood 1/10 Low FEMA zone X (unshaded) · 0% chance over 30 yrs
- Wildfire 1/10 Low
- Heat 5/10 Major 7 d/yr ≥107°F today · 18 d/yr by 30 yrs out
- Wind 3/10 Moderate 4% chance of damaging wind over 30 yrs
- Air quality 2/10 Low 1 unhealthy d/yr today · 2 by 30 yrs out
Nearby sold comps map
Loading sold comps map…
Walkable amenities ~0.75 mi
Loading nearby amenities…
Taxation est. · year 1
- Rental income
- $15,032
- − Mortgage interest
- −$5,596
- − Property taxes
- −$1,125
- − Insurance
- −$500
- − Repairs & maintenance
- −$1,203
- − Management
- −$1,203
- − Depreciation
- −$2,906
- Taxable income
- $2,501
- Est. tax owed @ 24.0%
- −$600
- After-tax cash flow
- $3,364/yr
For passive investors: Depreciation is non-cash, so a rental often shows a tax loss while cash-flowing — sheltering income. Rental losses are passive: they offset passive income freely, and up to $25,000/yr can offset ordinary (W-2) income if you actively participate and your MAGI is under $100k (phasing out to $0 by $150k); unused losses carry forward. On sale, claimed depreciation is recaptured at up to 25%, and gains may owe capital-gains tax (a 1031 exchange can defer both). Figures are a year-1 estimate at your 24.0% rate — not tax advice; consult a CPA.
Schools (NCES district)
- District
- Midwest City-Del City
- NCES district ID
- 4019950
- Math proficiency
- 10% ▼ -11.00%
- Reading proficiency
- 17% ▼ -8.00%
- Median HH income
- $45,724
- Composite
- 12.09/100
- National rank
- #9658
- State rank
- #231 of 270 in OK
Livability — Midwest City
- Score
- 71/100
- State rank
- #30
- US rank
- #6637
Category grades
Schools grade is shown separately in the Schools card above.
Census & demographics
- Census place
- Midwest City, OK
- County
- Oklahoma County · 771,644 people
- City population
- 57,386
- Metro
- Oklahoma City, OK
- Population (ZIP)
- 32,348
- Household income
- $51,228
- Rent vs Own
- Severe rent burden
- 1440.0
Population outlook (Oklahoma County) Hauer SSP2
- Today (2025)
- 911,875 people
- By 2030
- 982,413 · +7.7%
- By 2040
- 1,130,468 · +24.0%
- By 2050
- 1,288,422 · +41.3%
- By 2075
- 1,711,482 · +87.7%
- By 2100
- 2,088,448 · +129.0%
Race, ethnicity, and origin ACS 2023
- Neighborhood character
- Diverse neighborhood (Simpson 0.63)
- Race & ethnicity
- White 55% Black 25% Two or more races 11% Hispanic / Latino 7% Native American 4% Asian 1%
- Hispanic origin (detail)
- Mexican 5%
- Common ancestry
- Lithuanian 2% Slovak 1% Serbian 1%
- Foreign-born
- 3% · Canada, Vietnam
- Languages at home
- 95% English-only · Spanish 3%
Political lean MEDSL · Oklahoma
- 2024 margin
- Toss-up / Even · D 48.0% · R 49.7% · Other 2.3%
- 2008→2024 swing
- +15.1pp toward D · 2008: -16.8pp · 2024: -1.7pp
- All cycles
- 2024: R+1.7 2020: R+1.1 2016: R+10.5 2012: R+16.7 2008: R+16.8
Not yet ingested
- Civics
- —
Market trends
- HPI YoY
- ▼ -156.25%
- Current HPI
- 257.0791
- Rent YoY
- ▲ 2.99%
- Metro
- Oklahoma City, OK
- State GDP YoY
- ▲ 1.55%
- F500 in state
- 6
Industry mix (Fortune 500 HQ in OK)
| Industry | F500 HQs | Revenue |
|---|---|---|
| Energy | 3 | $48B |
|
||
Price history
+399.5% since first listed15 events — show timeline
- 2026-04-15 Listed $99,900 MLSOK
- 2026-04-08 Listing Removed — MLSOK
- 2026-01-17 Price Changed $124,900 MLSOK
- 2025-07-05 Relisted — MLSOK
- 2025-06-24 Pending — MLSOK
- 2024-08-14 Price Changed $125,000 MLSOK
- 2024-05-16 Listed $155,000 MLSOK
- 2011-03-30 Sold (MLS) $20,010 MLSOK
- 2011-02-22 Listed $17,000 MLSOK
- 2007-12-19 Listing Removed — MLSOK
- 2007-01-23 Listing Removed — MLSOK
- 2007-01-17 Listed $57,500 MLSOK
- 2006-08-03 Listed $59,000 MLSOK
- 1997-09-05 Sold (Public Records) $53,000 Public Records
- 1992-09-16 Sold (Public Records) $20,000 Public Records
Property tax history
+3.7%/yrLatest (2025): $1,125 · +2.5% YoY. Source: county tax records.
Cash-flow waterfall
monthlySold comps — $/sqft
last 12 mo · ≤1 miLoading sold comps…