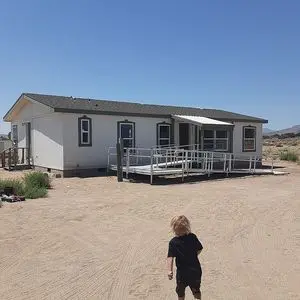
3185 E 4th St · Silver Springs, NV
Flood risk 1/10 · Minimal
- FEMA flood zone
- X (unshaded)
- Chance of flooding over 30 yrs
- 0.0%
- Est. flood insurance / yr
- $507 – $1,088
Fire risk 4/10 · Minor
- Est. fire insurance / yr
- $490 – $910
Heat risk 6/10 · Moderate
- Hot days now (above 96°F)
- 7 days/yr
- Hot days in 30 yrs
- 20 days/yr
Wind risk 1/10 · Minimal
- Chance of severe wind over 30 yrs
- —
Air-quality risk 8/10 · Major
- Unhealthy air days now
- 16 days/yr
- Unhealthy air days in 30 yrs
- 17 days/yr
Risk factors via First Street. Map © Google.
Why this score? — see what drove the D grade
The composite is a weighted blend of 9 inputs, each scored 0–100. Each bar is that input's sub-score; the figure is the points it added to the 100-point composite (weight × sub-score).
- Cash flow +10.2/30.0
- Appreciation +8.2/10.0
- ARV discount +6.5/15.0
- Livability +3.2/5.0
- DSCR +2.9/10.0
- Rent growth +2.5/5.0
- Condition / age +2.5/5.0
- Schools +2.4/10.0
- 1% rule +1.7/10.0
$294,900
🖨 Deal sheet (PDF) 📄 Offer letter ✓ Due diligence
Listing remarks MLS
Lovely home in the country. It could be income property or your own Personal retreat. Also, this is an all electric home! NO big propane bills! Wiith nearly 5 acres of land you will have plenty of room for all your animals, toys, and various projects. Inside you will discover a fine floor plan and an updated kitchen.
Key facts
- All electric home
- Updated kitchen
- Built 2004
Tags
Property features AI
Exterior
- Home design: Built in 2004
- Construction: Living area approximately 1,248
- Exterior features: Property sits on a 4.77-acre lot
Neighborhood map
What this means for you Summary
Snapshot
- This is a 3-bed/2.0-bath manufactured listed at $295k.
Deal economics
- At list price, monthly cash flow is $-166 ($-2k/yr) — negative.
- To cash-flow at today's rent, offer at most $266k (10.0% below list).
- To meet the 1% rule (rent ≥ 1% of price), the offer needs to be $198k (32.7% below list).
- Recommended offer: $198k (32.7% below list) — sets the bar for 1% rule.
- Cap rate 5.6% vs local median 3.7% in Silver Springs — top-decile yield for the area; either an underpriced asset or a hidden risk that comps aren't pricing in. Stress-test before assuming the spread holds.
Location & tenants
- Location reads 65/100 on livability (#42 in NV) — a middle-class / working-renter tenant base. Strengths: cost of living A+, housing A+, health & safety A-; Watch: schools F, amenities F, commute F.
- Lyon County School District (town): math 21% / reading 35% proficiency, ranked #14 of 17 in NV (top 82%) — low school quality limits family demand, transient renter base, plan for 1-2y turnover.
- Market conditions: 247 active listings in the ZIP; 297 units permitted in Lyon County in 2024 (80 in 5+ unit buildings).
Forward outlook
- In year one you build about $21k of equity ($2k loan paydown + $19k appreciation (6.4% local appreciation)).
- Lyon County population projected at -20% by 2050 — secular population decline; favor cash flow + early exit over multi-decade hold.
- By year 2, paydown + projected appreciation supports a ~$33k cash-out refi (75% LTV) — recoverable capital for the next deal without selling this one.
Negotiation context
- It's been on market 40 days — a 3% lower offer ($286k) is reasonable based on typical stale-listing flexibility.
- 4 sale attempts since 12y ago; this cycle's ask is 4% above the opening price — seller raised mid-cycle; expect resistance to lowballs.
- Current owner paid $50k; list at $295k implies a 490% gain — meaningful room to come down on a strong offer.
Risks & watch-outs
- Climate carrying-cost: extreme-heat days projected 7→20/yr by 2055 (HVAC capex compounding) — expect insurance premiums to compound above CPI over the hold.
Questions for the listing agent
- What do current leases actually rent for vs. the listed asking? Can we see a recent rent roll and the last 12 months of T-12 income?
- It's been on market 40 days. Have you received any prior offers? Is the seller open to a 33% concession, seller financing, or rate buy-down credit?
- Is there a deadline driving the sale (1031 exchange, divorce, estate, relocation)? That informs how much negotiation room exists.
- Schools are F-rated, which usually means shorter tenancies and higher turnover. Who's the typical renter profile here, and what's been the actual vacancy rate?
- The area grade is low — what's the realistic commute time and amenity access for the typical tenant pool here? Any planned neighborhood developments (good or bad) we should know about?
- What's the average days-on-market for RENTAL listings here right now (not sales)? A rising rental-DOM trend means longer vacancies and softer asking-rent achievability than the comps imply.
- What's the recent tenant-quality profile in this submarket — average credit score on applications, eviction rate, late-payment / NSF rate, and stable-employment percentage? A property-management company in the area should have these aggregated.
- How much new for-sale + rental construction is in the pipeline within 1–3 miles? Heavy new supply typically softens prices + rents 12–24 months out; constrained supply supports both.
Investment metrics
- 1% rule
- 0.67% ✗
- Cap rate
- 5.62%
- Cash-on-cash
- -2.42%
- DSCR
- 0.89
- GRM
- 12.4
CMA / ARV
- ARV (on-the-fly)
- $288,288
- Comps found
- 3
Show comp detail 3 sales within ~0.75 mi
| Address | Dist | Beds/Ba | Sqft | Sold | Price | $/sf | Match |
|---|---|---|---|---|---|---|---|
| 3035 4th St | 0.18mi | 3/2.0 | 1,296 (+4%) | 1mo | $390,000 | $301 | 84 |
| 3345 E 5th St | 0.29mi | 3/2.0 | 1,080 (-14%) | 17mo | $250,000 | $231 | 50 |
| 2535 E 3rd St | 0.72mi | 3/2.0 | 1,380 (+11%) | 9mo | $302,000 | $219 | 41 |
Match score weights: distance 35% · size 25% · config 20% · recency 20%. Top-matched comps best support the ARV.
Projected returns pro-forma
6.36% appreciation · 3.0% rent growth · sell at horizon
- IRR
- 14.3%
- Equity multiple
- 1.98×
- Total profit
- $80,764
- Equity at exit
- $192,154
- IRR
- 14.5%
- Equity multiple
- 3.95×
- Total profit
- $243,990
- Equity at exit
- $354,457
Cash invested: $82,572 (down + closing). Projections, not guarantees.
Landlord ↔ Tenant lean methodology
- Overall (STATE)
- 71 Landlord-Friendly
- State Nevada
- 71 Landlord-Friendly · R+1
- County
- — inherits STATE
- City
- — inherits STATE
ZIP-level market 89429
- Home prices YoY
- 2.4%
- Active inventory
- 247
- Price-to-rent
- 12.4×
Monthly cashflow live
- Estimated rent
- $1,984 medium interval (Pro) →
- Mortgage (P&I)
- −$1,546
- Tax from tax record
- −$64 /mo · $768/yr
- Insurance
- −$123
- HOA
- −$0
- Vacancy / Maint / Mgmt
- −$417
- Net cashflow
- $-166
Break-even live
Sensitivity live
| Price | -10% $1 | -5% $-83 | +0% $-166 | +5% $-250 | +10% $-333 |
|---|---|---|---|---|---|
| Rent | -10% $-323 | -5% $-245 | +0% $-166 | +5% $-88 | +10% $-9 |
| Rate | -1.0pp $-18 | -0.5pp $-91 | base $-166 | +0.5pp $-243 | +1.0pp $-320 |
UW: 25.0% down · 7.5% · 30yr · 1.5% tax · 5.0% vac · 8.0% maint · 8.0% mgmt
Financing live
Cash to close
- Down payment
- $73,725
- Closing costs
- $8,847
- Reserves months
- —
- Total cash needed
- —
Loan-product check · same deal, 3 products live
Conventional
25% down · 7.5% · 30yr
- Down + closing
- —
- Monthly P&I
- —
- Monthly cashflow
- —
- DSCR
- —
- Eligible?
- —
Personal DTI + credit; lowest rate.
DSCR
20% down · 8.5% · 30yr
- Down + closing
- —
- Monthly P&I
- —
- Monthly cashflow
- —
- DSCR
- —
- Eligible?
- —
No personal income docs; deal must DSCR.
Hard money
10% down · 12.0% · 12mo
- Down + closing
- —
- Monthly P&I
- —
- Monthly cashflow
- —
- DSCR
- —
- Eligible?
- —
Short-term bridge; refi at stabilization.
Listing history 28 events
-
2026-06-22days on market $294,900 Active 40 DOM
-
2026-06-19remarks 319-char remark
-
2026-06-19pricedays on market $294,900 Active 37 DOM
-
2026-06-18days on market $284,500 Active 29 DOM
-
2026-06-17days on market $284,500 Active 28 DOM
-
2026-06-16days on market $284,500 Active 27 DOM
-
2026-06-15days on market $284,500 Active 26 DOM
-
2026-06-14days on market $284,500 Active 24 DOM
-
2026-06-13days on market $284,500 Active 23 DOM
-
2026-06-10days on market $284,500 Active 21 DOM
-
2026-06-09days on market $284,500 Active 20 DOM
-
2026-06-08days on market $284,500 Active 19 DOM
-
2026-06-07days on market $284,500 Active 18 DOM
-
2026-06-03days on market $284,500 Active 14 DOM
-
2026-06-02days on market $284,500 Active 13 DOM
-
2026-06-01days on market $284,500 Active 12 DOM
-
2026-05-31days on market $284,500 Active 11 DOM
-
2026-05-30days on market $284,500 Active 10 DOM
-
2026-05-12$294,900 Active 319-char remark
Show marketing remark (319 chars)
Lovely home in the country. It could be income property or your own Personal retreat. Also, this is an all electric home! NO big propane bills! Wiith nearly 5 acres of land you will have plenty of room for all your animals, toys, and various projects. Inside you will discover a fine floor plan and an updated kitchen.
-
2025-10-09historical Active Under Contract-Show
-
2025-10-06price $285,000
-
2025-09-07price $289,900
-
2025-08-27price $289,900
-
2025-08-16$299,500 Active
-
2014-12-31soldstatus $50,000 Sold
-
2014-12-31soldstatus $50,000
-
2014-10-24historical
-
2014-10-13$60,000
ⓘ Source: listings_history table (triggers on properties + properties_extension) + one-shot
backfill from property_details.listing_events for pre-trigger history.
Tax reassessment forecast NV · Resets to sale price
- Current annual tax
- $768 · $64/mo
- Projected year-2 tax
- $1,740 · $145/mo
- Expected delta
- +$972/yr (+$81/mo · 126.5%)
ⓘ Screening estimate from a state-policy table — verify with the county assessor before closing.
Climate risk First Street
- Flood 1/10 Low FEMA zone X (unshaded) · 0% chance over 30 yrs
- Wildfire 4/10 Moderate
- Heat 6/10 Major 7 d/yr ≥96°F today · 20 d/yr by 30 yrs out
- Wind 1/10 Low
- Air quality 8/10 Severe 16 unhealthy d/yr today · 17 by 30 yrs out
Nearby sold comps map
Loading sold comps map…
Walkable amenities ~0.75 mi
Loading nearby amenities…
Taxation est. · year 1
- Rental income
- $23,805
- − Mortgage interest
- −$16,519
- − Property taxes
- −$768
- − Insurance
- −$1,474
- − Repairs & maintenance
- −$1,904
- − Management
- −$1,904
- − Depreciation
- −$8,579
- Taxable loss
- −$7,344
- Est. tax savings @ 24.0%
- +$1,763
- After-tax cash flow
- $-232/yr
For passive investors: Depreciation is non-cash, so a rental often shows a tax loss while cash-flowing — sheltering income. Rental losses are passive: they offset passive income freely, and up to $25,000/yr can offset ordinary (W-2) income if you actively participate and your MAGI is under $100k (phasing out to $0 by $150k); unused losses carry forward. On sale, claimed depreciation is recaptured at up to 25%, and gains may owe capital-gains tax (a 1031 exchange can defer both). Figures are a year-1 estimate at your 24.0% rate — not tax advice; consult a CPA.
Schools (NCES district)
- District
- Lyon County School District
- NCES district ID
- 3200300
- Math proficiency
- 21% ▼ -11.00%
- Reading proficiency
- 35% ▼ -7.00%
- Median HH income
- $48,197
- Composite
- 24.32/100
- National rank
- #7707
- State rank
- #14 of 17 in NV
Livability — Silver Springs
- Score
- 65/100
- State rank
- #42
- US rank
- #13362
Category grades
Schools grade is shown separately in the Schools card above.
Census & demographics
- Census place
- Silver Springs, NV
- City population
- 7,949
- Population (ZIP)
- 7,949
Population outlook (Lyon County) Hauer SSP2
- Today (2025)
- 51,655 people
- By 2030
- 50,194 · -2.8%
- By 2040
- 46,155 · -10.6%
- By 2050
- 41,580 · -19.5%
- By 2075
- 32,687 · -36.7%
- By 2100
- 24,111 · -53.3%
Race, ethnicity, and origin ACS 2023
- Neighborhood character
- Predominantly White (83%)
- Race & ethnicity
- White 83% Two or more races 8% Hispanic / Latino 8% Native American 2%
- Hispanic origin (detail)
- Mexican 7%
- Common ancestry
- Slovak 3% Lithuanian 2% Italian 2%
- Foreign-born
- 5% · Canada, China
- Languages at home
- 92% English-only · Spanish 5% Arabic 1% Chinese 1%
Political lean MEDSL · Lyon
- 2024 margin
- Solid R (+44.4) · D 26.7% · R 71.1% · Other 2.2%
- 2008→2024 swing
- -26.5pp toward R · 2008: -17.9pp · 2024: -44.4pp
- All cycles
- 2024: R+44.4 2020: R+41.1 2016: R+41.5 2012: R+28.6 2008: R+17.9
Not yet ingested
- Civics
- —
Market trends
- HPI YoY
- ▲ 6.36%
- Current HPI
- 271.5945
- Rent YoY
- —
- Metro
- —
- State GDP YoY
- ▲ 3.08%
- F500 in state
- 6
Industry mix (Fortune 500 HQ in NV)
| Industry | F500 HQs | Revenue |
|---|---|---|
| Hotels / Casinos | 3 | $36B |
|
||
Price history
+374.2% since first listed11 events — show timeline
- 2026-05-19 Listed $284,500 FSBO.com
- 2026-05-12 Listed $294,900 FSBO.com
- 2025-10-09 Contingent — NNRMLS
- 2025-10-06 Price Changed $285,000 NNRMLS
- 2025-09-07 Price Changed $289,900 Fizber.com
- 2025-08-27 Price Changed $289,900 NNRMLS
- 2025-08-16 Listed $299,500 NNRMLS
- 2014-12-31 Sold (Public Records) $50,000 Public Records
- 2014-12-31 Sold (MLS) $50,000 NNRMLS
- 2014-10-24 Listing Removed — NNRMLS
- 2014-10-13 Listed $60,000 NNRMLS
Property tax history
+3.4%/yrLatest (2025): $768 · +3.0% YoY. Source: county tax records.
Cash-flow waterfall
monthlySold comps — $/sqft
last 12 mo · ≤1 miLoading sold comps…