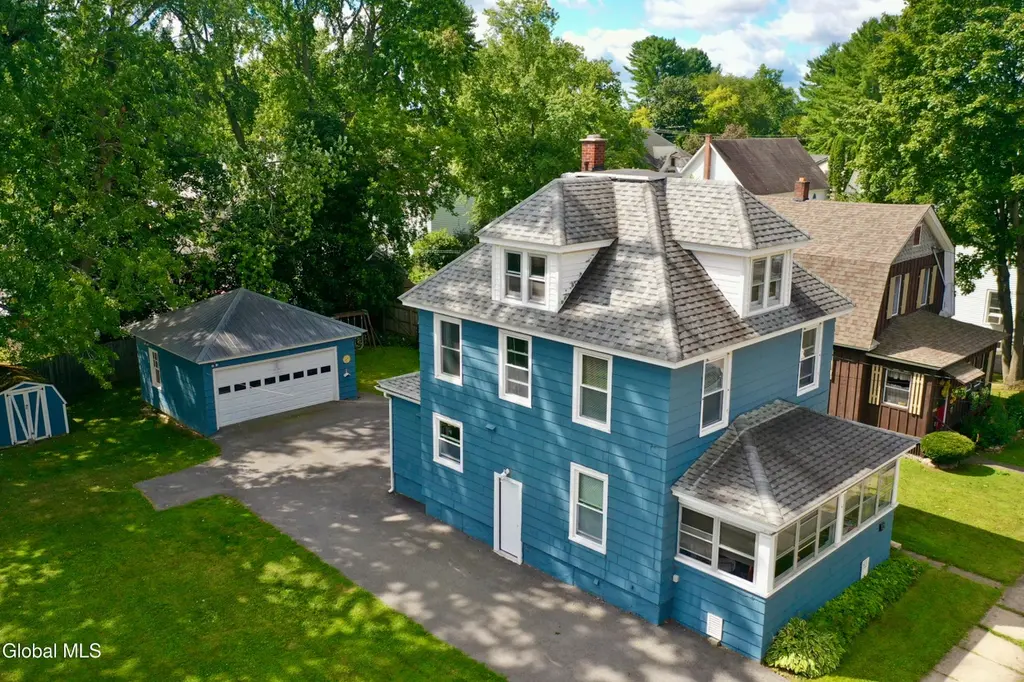
12 Newman St · Gloversville, NY
Flood risk 1/10 · Minimal
- FEMA flood zone
- X
- Chance of flooding over 30 yrs
- 0.0%
- Est. flood insurance / yr
- $473 – $860
Fire risk 3/10 · Minor
- Est. fire insurance / yr
- $691 – $1,283
Heat risk 2/10 · Minimal
- Hot days now (above 93°F)
- 7 days/yr
- Hot days in 30 yrs
- 16 days/yr
Wind risk 2/10 · Minimal
- Chance of severe wind over 30 yrs
- 3.0%
Air-quality risk 1/10 · Minimal
- Unhealthy air days now
- 0 days/yr
- Unhealthy air days in 30 yrs
- 0 days/yr
Risk factors via First Street. Map © Google.
Why this score? — see what drove the D- grade
The composite is a weighted blend of 9 inputs, each scored 0–100. Each bar is that input's sub-score; the figure is the points it added to the 100-point composite (weight × sub-score).
- Appreciation +10.0/10.0
- Cash flow +8.5/30.0
- Livability +4.1/5.0
- ARV discount +3.2/15.0
- Schools +2.8/10.0
- Rent growth +2.5/5.0
- Condition / age +2.5/5.0
- DSCR +2.3/10.0
- 1% rule +1.6/10.0
$189,900
🖨 Deal sheet 📄 Offer letter ✓ Due diligence
Listing remarks
Beautifully updated 3-bedroom, 1-bath home located on a quiet street within walking distance to Darling Field with tennis, soccer, and pickleball courts. Features include a newer roof, replacement windows, central air, luxury vinyl flooring, a modern kitchen, and a spacious full bath. The enclosed front porch offers additional living space, while the rear deck overlooks a generous double lot, perfect for outdoor enjoyment. A well-maintained property offering comfort and convenience in an ideal location.
Key facts
- Quiet street
- Newer roof
- Updated home
Tags
Property features AI
Exterior
- Parking: Detached garage with 2 garage spaces; Additional paved off-street parking (total 4 spaces); Driveway with garage door opener
- Utilities: Public water; Public sewer; Circuit breaker electrical service; Cable connected
- Home design: Single family residence; Updated / remodeled; Shingle siding
- Construction: Asphalt roof
- Exterior features: Deck; Front porch (glass enclosed); Paved driveway; Exterior lighting; Detached garage(s)
Interior
- Kitchen: Dishwasher; Freezer; Microwave; Range; Refrigerator
- Bedrooms: Three bedrooms on the second level
- Flooring: Tile; Carpet; Hardwood
- Bathrooms: One full bathroom located on the second level
- Heating & cooling: Forced air heating (natural gas); Central air conditioning
- Interior features: Paddle fan; Solid surface counters; Ceramic tile bath; 7 total rooms
- Laundry & utility: Washer hookup in the basement; Basement laundry area
Neighborhood map
What this means for you Summary
Snapshot
- This is a 2-bed/1.0-bath single-family listed at $190k.
Deal economics
- At list price, monthly cash flow is $-167 ($-2k/yr) — negative.
- To cash-flow at today's rent, offer at most $160k (15.6% below list).
- To meet the 1% rule (rent ≥ 1% of price), the offer needs to be $125k (33.9% below list).
- Recommended offer: $125k (33.9% below list) — sets the bar for 1% rule.
- Cap rate 5.2% vs local median 8.7% in Gloversville — below-typical yield; the buyer is paying a premium for something (appreciation thesis, condition, location) that the cap rate doesn't capture.
Location & tenants
- Location reads 82/100 on livability (#70 in NY, #1,048 nationally) — a professional / high-income tenant draw. Strengths: amenities A+, commute A+, cost of living A+; Watch: employment F.
- Gloversville City School District (town): math 26% / reading 42% proficiency, ranked #565 of 590 in NY (top 96%) — families likely to look elsewhere, expect single-tenant / working-renter base with shorter leases.
- Zoned schools: Gloversville High School (math 82% / reading 77%, grade A-, #518 of 1,100 statewide, top 51%, 697 students, 71% FRL) — zoned schools average 71% FRL vs 54% district-wide (17 pts higher); higher-poverty schools than district average — tighter screening recommended.
- Zoned-school proficiency averages 80% at this address vs 34% district-wide (+46 pts) — the actual schools serving this property are materially stronger than the Gloversville City School District average implies; a family-tenant draw the district grade alone would hide.
- Market conditions: 165 active listings in the ZIP; 2 comparable units currently listed for rent nearby; 112 units permitted in Fulton County in 2024 (50 in 5+ unit buildings).
Forward outlook
- In year one you build about $20k of equity ($1k loan paydown + $19k appreciation (10.0% local appreciation)).
- Fulton County population projected at -23% by 2050 — secular population decline; favor cash flow + early exit over multi-decade hold.
- By year 2, paydown + projected appreciation supports a ~$33k cash-out refi (75% LTV) — recoverable capital for the next deal without selling this one.
Negotiation context
- Only 11 days on market — expect competitive offers; lowballing is unlikely to land.
- 2 sale attempts with the ask held roughly flat each time — persistent listings suggest the price (not the market) is what's stuck; bring a comps-based counter.
- Current owner paid $57k; list at $190k implies a 235% gain — meaningful room to come down on a strong offer.
Risks & watch-outs
- Watch-outs: built in 1953 — expect roof / HVAC / electrical / plumbing capex.
Questions for the listing agent
- What do current leases actually rent for vs. the listed asking? Can we see a recent rent roll and the last 12 months of T-12 income?
- Built in 1953 — when were the roof, HVAC, electrical panel, plumbing, and water heater last replaced?
- Is there a deadline driving the sale (1031 exchange, divorce, estate, relocation)? That informs how much negotiation room exists.
- Schools are D-rated, which usually means shorter tenancies and higher turnover. Who's the typical renter profile here, and what's been the actual vacancy rate?
- The area grade is low — what's the realistic commute time and amenity access for the typical tenant pool here? Any planned neighborhood developments (good or bad) we should know about?
- What's the average days-on-market for RENTAL listings here right now (not sales)? A rising rental-DOM trend means longer vacancies and softer asking-rent achievability than the comps imply.
- What's the recent tenant-quality profile in this submarket — average credit score on applications, eviction rate, late-payment / NSF rate, and stable-employment percentage? A property-management company in the area should have these aggregated.
- How much new for-sale + rental construction is in the pipeline within 1–3 miles? Heavy new supply typically softens prices + rents 12–24 months out; constrained supply supports both.
Investment metrics
- 1% rule
- 0.66% ✗
- Cap rate
- 5.24%
- Cash-on-cash
- -3.78%
- DSCR
- 0.83
- GRM
- 12.6
CMA / ARV
- ARV (median comp)
- $173,363
- List price
- $189,900
- Delta
- 9.54%
- Verdict
- FAIR
- Comps
- 20 within 1.0 mi
Show comp detail 12 sales within ~0.75 mi
| Address | Dist | Beds/Ba | Sqft | Sold | Price | $/sf | Match |
|---|---|---|---|---|---|---|---|
| 10 Franklin St | 0.06mi | 2/1.0 | 1,184 (-10%) | 1mo | $43,000 | $36 | 80 |
| 119 5th Ave | 0.31mi | 3/1.0 (+1) | 1,350 (+2%) | 1mo | $146,260 | $108 | 76 |
| 139 5th Ave | 0.33mi | 3/1.0 (+1) | 1,332 (+1%) | 5mo | $105,000 | $79 | 74 |
| 96 6th Ave | 0.28mi | 3/1.0 (+1) | 1,425 (+8%) | 2mo | $179,500 | $126 | 67 |
| 20 Easterly St | 0.43mi | 3/2.0 (+1) | 1,350 (+2%) | 4mo | $198,000 | $147 | 64 |
| 20 North Blvd | 0.19mi | 2/2.0 | 1,458 (+10%) | 7mo | $199,900 | $137 | 63 |
| 13 Newman St | 0.02mi | 3/2.0 (+1) | 1,152 (-13%) | 8mo | $160,000 | $139 | 62 |
| 44 W 8th Ave | 0.54mi | 3/1.5 (+1) | 1,408 (+7%) | 5mo | $141,000 | $100 | 53 |
| 62 3rd Ave | 0.54mi | 3/2.0 (+1) | 1,209 (-8%) | 3mo | $135,000 | $112 | 50 |
| 3 State Cir | 0.58mi | 3/1.0 (+1) | 1,189 (-10%) | 6mo | $219,000 | $184 | 46 |
| 503 N Main St | 0.72mi | 2/1.0 | 1,200 (-9%) | 9mo | $60,000 | $50 | 44 |
| 56 W State St | 0.70mi | 3/1.0 (+1) | 1,172 (-11%) | 6mo | $195,000 | $166 | 39 |
Match score weights: distance 35% · size 25% · config 20% · recency 20%. Top-matched comps best support the ARV.
Projected returns pro-forma
10.0% appreciation · 3.0% rent growth · sell at horizon
- IRR
- 21.6%
- Equity multiple
- 2.74×
- Total profit
- $92,694
- Equity at exit
- $171,077
- IRR
- 19.5%
- Equity multiple
- 6.29×
- Total profit
- $281,197
- Equity at exit
- $368,934
Cash invested: $53,172 (down + closing). Projections, not guarantees.
Landlord ↔ Tenant lean methodology
- Overall (STATE)
- 15 Strongly Tenant-Friendly
- State New York
- 15 Strongly Tenant-Friendly · D+10
- County
- — inherits STATE
- City
- — inherits STATE
ZIP-level market 12078
- Home prices YoY
- 12.2%
- Active inventory
- 165
- Price-to-rent
- 12.6×
Monthly cashflow live
- Estimated rent
- $1,255 medium interval (Pro) →
- Mortgage (P&I)
- −$996
- Tax from tax record
- −$83 /mo · $1,002/yr
- Insurance
- −$79
- HOA
- −$0
- Vacancy / Maint / Mgmt
- −$263
- Net cashflow
- $-167
Break-even live
UW: 25.0% down · 7.5% · 30yr · 1.5% tax · 5.0% vac · 8.0% maint · 8.0% mgmt
Financing live
Cash to close
- Down payment
- $47,475
- Closing costs
- $5,697
- Reserves months
- —
- Total cash needed
- —
Loan-product check · same deal, 3 products live
Conventional
25% down · 7.5% · 30yr
- Down + closing
- —
- Monthly P&I
- —
- Monthly cashflow
- —
- DSCR
- —
- Eligible?
- —
Personal DTI + credit; lowest rate.
DSCR
20% down · 8.5% · 30yr
- Down + closing
- —
- Monthly P&I
- —
- Monthly cashflow
- —
- DSCR
- —
- Eligible?
- —
No personal income docs; deal must DSCR.
Hard money
10% down · 12.0% · 12mo
- Down + closing
- —
- Monthly P&I
- —
- Monthly cashflow
- —
- DSCR
- —
- Eligible?
- —
Short-term bridge; refi at stabilization.
Rent comps 2 comps
| Address | Beds | Baths | Sqft | Rent | $/sqft | DOM | Units | Dist |
|---|---|---|---|---|---|---|---|---|
| 11 Fremont St Gloversville, NY | 2.0–3.0 | 1.5–2.0 | 1612 | $1,425 | $0.88 | 43d | 3 | 0.88mi |
| 130 Spring St Gloversville, NY | 1.0 | 1.0 | 950 | $995 | $1.05 | 43d | 1 | 1.18mi |
Listing history 5 events
-
2026-05-08$189,900 Active 508-char remark
-
2025-09-06historical Contingent
-
2025-09-06historical
-
2025-08-29$179,900 Active
-
2001-07-02soldstatus $56,700
ⓘ Source: listings_history table (triggers on properties + properties_extension) + one-shot
backfill from property_details.listing_events for pre-trigger history.
Tax reassessment forecast NY · Partial reset (capped growth)
- Current annual tax
- $1,002 · $83/mo
- Projected year-2 tax
- $2,106 · $175/mo
- Expected delta
- +$1,104/yr (+$92/mo · 110.1%)
ⓘ Screening estimate from a state-policy table — verify with the county assessor before closing.
Climate risk First Street
- Flood 1/10 Low FEMA zone X · 0% chance over 30 yrs
- Wildfire 3/10 Moderate
- Heat 2/10 Low 7 d/yr ≥93°F today · 16 d/yr by 30 yrs out
- Wind 2/10 Low 3% chance of damaging wind over 30 yrs
- Air quality 1/10 Low 0 unhealthy d/yr today · 0 by 30 yrs out
Nearby sold comps map
Loading sold comps map…
Walkable amenities ~0.75 mi
Loading nearby amenities…
Taxation est. · year 1
- Rental income
- $15,056
- − Mortgage interest
- −$10,637
- − Property taxes
- −$1,002
- − Insurance
- −$950
- − Repairs & maintenance
- −$1,204
- − Management
- −$1,204
- − Depreciation
- −$5,524
- Taxable loss
- −$5,466
- Est. tax savings @ 24.0%
- +$1,312
- After-tax cash flow
- $-696/yr
For passive investors: Depreciation is non-cash, so a rental often shows a tax loss while cash-flowing — sheltering income. Rental losses are passive: they offset passive income freely, and up to $25,000/yr can offset ordinary (W-2) income if you actively participate and your MAGI is under $100k (phasing out to $0 by $150k); unused losses carry forward. On sale, claimed depreciation is recaptured at up to 25%, and gains may owe capital-gains tax (a 1031 exchange can defer both). Figures are a year-1 estimate at your 24.0% rate — not tax advice; consult a CPA.
Schools (NCES district)
- District
- Gloversville City School District
- NCES district ID
- 3612270
- Math proficiency
- 26% ▼ -6.00%
- Reading proficiency
- 42% ▲ 7.00%
- Median HH income
- $36,775
- Composite
- 28.2/100
- National rank
- #6806
- State rank
- #565 of 590 in NY
Livability — Gloversville
- Score
- 82/100
- State rank
- #70
- US rank
- #1048
Category grades
Schools grade is shown separately in the Schools card above.
Census & demographics
- Census place
- Gloversville, NY
- Population (ZIP)
- 23,087
Population outlook (Fulton County) Hauer SSP2
- Today (2025)
- 51,132 people
- By 2030
- 49,114 · -3.9%
- By 2040
- 44,373 · -13.2%
- By 2050
- 39,321 · -23.1%
- By 2075
- 28,503 · -44.3%
- By 2100
- 19,268 · -62.3%
Race, ethnicity, and origin ACS 2023
- Neighborhood character
- Predominantly White (86%)
- Race & ethnicity
- White 86% Two or more races 8% Hispanic / Latino 5% Black 2% Asian 1%
- Hispanic origin (detail)
- Puerto Rican 3%
- Common ancestry
- Lithuanian 5% Romanian 4% Iranian 4%
- Foreign-born
- 2% · Canada, China
- Languages at home
- 97% English-only · Spanish 2%
Political lean MEDSL · Fulton
- 2024 margin
- Solid R (+35.9) · D 32.1% · R 67.9%
- 2008→2024 swing
- -26.6pp toward R · 2008: -9.2pp · 2024: -35.9pp
- All cycles
- 2024: R+35.9 2020: R+31.4 2016: R+35.5 2012: R+10.5 2008: R+9.2
Not yet ingested
- Civics
- —
Market trends
- HPI YoY
- ▲ 34.22%
- Current HPI
- 315.1368
- Rent YoY
- —
- Metro
- —
- State GDP YoY
- ▲ 2.60%
- F500 in state
- 92
Industry mix (Fortune 500 HQ in NY)
| Industry | F500 HQs | Revenue |
|---|---|---|
| Financial Services | 10 | $950B |
|
||
| Consumer Goods | 9 | $162B |
|
||
| Insurance | 4 | $225B |
|
||
| Telecommunications | 2 | $144B |
|
||
| Pharmaceuticals | 2 | $112B |
|
||
| Media / Entertainment | 2 | $69B |
|
||
Price history
+234.9% since first listed6 events — show timeline
- 2026-05-19 Pending — Global MLS
- 2026-05-08 Listed $189,900 Global MLS
- 2025-09-06 Contingent — Global MLS
- 2025-09-06 Listing Removed — Global MLS
- 2025-08-29 Listed $179,900 Global MLS
- 2001-07-02 Sold (Public Records) $56,700 Public Records
Property tax history
-3.5%/yrLatest (2025): $1,002 · +14.0% YoY. Source: county tax records.
Cash-flow waterfall
monthlySold comps — $/sqft
last 12 mo · ≤1 miLoading sold comps…