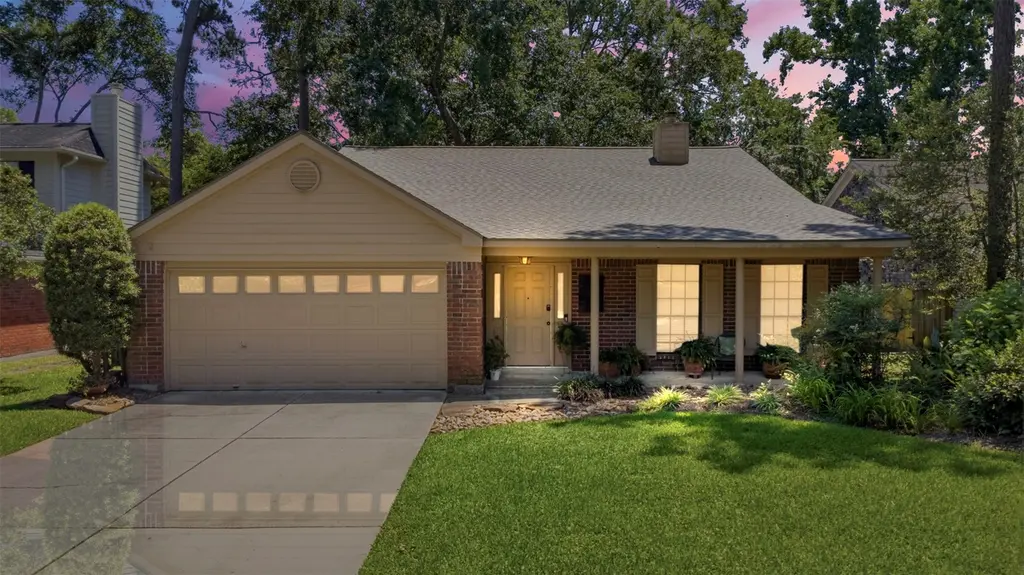
3418 Creek Manor Dr · Houston, TX
Flood risk 4/10 · Minor
- FEMA flood zone
- X (unshaded)
- Chance of flooding over 30 yrs
- 0.22%
- Est. flood insurance / yr
- $507 – $1,088
Fire risk 2/10 · Minimal
- Est. fire insurance / yr
- $1,222 – $2,270
Heat risk 9/10 · Severe
- Hot days now (above 111°F)
- 7 days/yr
- Hot days in 30 yrs
- 24 days/yr
Wind risk 8/10 · Major
- Chance of severe wind over 30 yrs
- 99.0%
Air-quality risk 3/10 · Minor
- Unhealthy air days now
- 2 days/yr
- Unhealthy air days in 30 yrs
- 3 days/yr
Risk factors via First Street. Map © Google.
Why this score? — see what drove the D grade
The composite is a weighted blend of 9 inputs, each scored 0–100. Each bar is that input's sub-score; the figure is the points it added to the 100-point composite (weight × sub-score).
- ARV discount +13.0/15.0
- Cash flow +6.6/30.0
- Appreciation +5.2/10.0
- Schools +3.9/10.0
- Livability +3.7/5.0
- 1% rule +2.9/10.0
- Condition / age +2.5/5.0
- Rent growth +2.4/5.0
- DSCR +0.9/10.0
$235,000
🖨 Deal sheet 📄 Offer letter ✓ Due diligence
Listing remarks
Welcome home to 3418 Creek Manor Drive in the highly sought-after community of Elm Grove. This charming 3-bedroom, 2-bath home features an open-concept kitchen/ breakfast area, living, and dining area with a patio just off the kitchen, creating a seamless flow for everyday living and entertaining. A cozy fireplace beautifully separates the living and dining spaces while maintaining the open feel of the home. Generously sized secondary bedrooms with spacious closets, perfect for guests, office, or hobbies. The spacious primary suite includes an en-suite bath with double sinks, garden tub, and separate shower. Step outside into your own backyard oasis filled with lush landscaping and serene s
Key facts
- 7,801 sq ft lot
- 2 garage spots
- Community pool
Property features AI
Finance
- HOA & community: Community managed by Sterling ASI; Annual association fee; On-site amenities include pool, tennis courts, pickleball, playground, and park
Exterior
- Parking: Attached 2-car garage
- Utilities: Public water; Public sewer
- Home design: Residential property; Faces north
- Construction: Built in 1987; Brick and wood siding exterior; Composition roof; Slab foundation
- Exterior features: Subdivision lot; Association pool
Interior
- Kitchen: Dishwasher; Disposal; Gas oven; Gas range; Microwave
- Bedrooms: Primary bedroom on the first floor (15 x 13); Bedroom on the first floor (12 x 10); Bedroom on the first floor (11 x 10)
- Flooring: Carpet; Tile
- Bathrooms: 2 full bathrooms
- Heating & cooling: Central heating (gas); Central electric air conditioning
- Interior features: Gas log and wood-burning fireplace; Double vanity; Soaking tub; Separate shower; 7 total rooms
Neighborhood map
What this means for you Summary
Snapshot
- This is a 3-bed/2.0-bath single-family listed at $235k.
Deal economics
- At list price, monthly cash flow is $-383 ($-5k/yr) — negative.
- To cash-flow at today's rent, offer at most $167k (28.8% below list).
- To meet the 1% rule (rent ≥ 1% of price), the offer needs to be $186k (20.8% below list).
- Recommended offer: $167k (28.8% below list) — sets the bar for cash-flow.
- Cap rate 4.3% vs local median 3.2% in Houston — top-decile yield for the area; either an underpriced asset or a hidden risk that comps aren't pricing in. Stress-test before assuming the spread holds.
Location & tenants
- Location reads 74/100 on livability (#184 in TX, #4,771 nationally) — a middle-class / working-renter tenant base. Strengths: amenities A+, cost of living A+, housing A+; Watch: crime F.
- Humble ISD (urban): math 38% / reading 44% proficiency, ranked #262 of 826 in TX (top 32%) — families likely to look elsewhere, expect single-tenant / working-renter base with shorter leases.
- Zoned schools: Kingwood Middle (math 39% / reading 44%, grade F, #595 of 1,662 statewide, top 37%, 1,002 students, 48% FRL); Kingwood Park H S (math 48% / reading 56%, grade D+, #447 of 1,632 statewide, top 29%, 1,950 students, 32% FRL).
- Market conditions: Rents soft (-0.6%/yr); 311 active listings in the ZIP; 21 comparable units currently listed for rent nearby; rentals at typical pace (median 25d on market — plan ~3-4 weeks tenant-placement turnaround); 43% of comp listings sitting > 30 days — soft ceiling on asking rent; solid renter incomes; 29,883 units permitted in Harris County in 2024 (8,621 in 5+ unit buildings).
Forward outlook
- In year one you build about $3k of equity ($2k loan paydown + $1k appreciation (0.5% local appreciation)).
- Harris County population projected at +47% by 2050 — long-run rental-demand tailwind backs the buy-and-hold thesis.
- By year 10, paydown + projected appreciation supports a ~$32k cash-out refi (75% LTV) — recoverable capital for the next deal without selling this one.
Negotiation context
- Only 12 days on market — expect competitive offers; lowballing is unlikely to land.
- Current owner paid $81k; list at $235k implies a 190% gain — meaningful room to come down on a strong offer.
Risks & watch-outs
- Watch-outs: property tax is 2.5% of price.
- Climate carrying-cost: severe wind risk, 99% chance of damaging wind over 30y; extreme-heat days projected 7→24/yr by 2055 (HVAC capex compounding) — expect insurance premiums to compound above CPI over the hold.
Questions for the listing agent
- What do current leases actually rent for vs. the listed asking? Can we see a recent rent roll and the last 12 months of T-12 income?
- Property tax is high relative to price — has the assessment been appealed recently, and will the sale trigger a re-assessment?
- What does the HOA fee cover, when was the last increase, and are there any pending special assessments or reserve-fund shortfalls?
- Is there a deadline driving the sale (1031 exchange, divorce, estate, relocation)? That informs how much negotiation room exists.
- Schools are D-rated, which usually means shorter tenancies and higher turnover. Who's the typical renter profile here, and what's been the actual vacancy rate?
- Crime grade is F in this area — have there been break-ins, vandalism, or insurance claims at this property in the last 3 years? What carrier currently insures it and at what premium?
- The area grade is low — what's the realistic commute time and amenity access for the typical tenant pool here? Any planned neighborhood developments (good or bad) we should know about?
- What's the average days-on-market for RENTAL listings here right now (not sales)? A rising rental-DOM trend means longer vacancies and softer asking-rent achievability than the comps imply.
- What's the recent tenant-quality profile in this submarket — average credit score on applications, eviction rate, late-payment / NSF rate, and stable-employment percentage? A property-management company in the area should have these aggregated.
- How much new for-sale + rental construction is in the pipeline within 1–3 miles? Heavy new supply typically softens prices + rents 12–24 months out; constrained supply supports both.
Investment metrics
- 1% rule
- 0.79% ✗
- Cap rate
- 4.34%
- Cash-on-cash
- -6.99%
- DSCR
- 0.69
- GRM
- 10.5
CMA / ARV
- ARV (median comp)
- $267,882
- List price
- $235,000
- Delta
- -12.27%
- Verdict
- UNDERPRICED
- Comps
- 20 within 1.0 mi
Show comp detail 12 sales within ~0.75 mi
| Address | Dist | Beds/Ba | Sqft | Sold | Price | $/sf | Match |
|---|---|---|---|---|---|---|---|
| 3418 Creek Manor Dr | 0.00mi | 3/2.0 | 1,734 (0%) | 0mo | $235,000 | $136 | 100 |
| 5434 Garden Village Dr | 0.16mi | 3/2.0 | 1,736 (+0%) | 1mo | $232,500 | $134 | 91 |
| 5423 Glade Estates Dr | 0.07mi | 3/2.0 | 1,846 (+6%) | 1mo | $278,900 | $151 | 85 |
| 3303 Creek Shadows Dr | 0.28mi | 3/2.0 | 1,719 (-1%) | 3mo | $250,000 | $145 | 83 |
| 3322 Sycamore Springs Dr | 0.50mi | 3/2.0 | 1,651 (-5%) | 1mo | $199,000 | $121 | 68 |
| 3331 Kings Mountain Dr | 0.41mi | 3/2.0 | 1,885 (+9%) | 2mo | $279,000 | $148 | 65 |
| 3319 Sycamore Springs Dr | 0.47mi | 4/2.0 (+1) | 1,860 (+7%) | 3mo | $219,900 | $118 | 59 |
| 3322 Brookdale Dr | 0.67mi | 3/2.5 | 1,645 (-5%) | 0mo | $219,000 | $133 | 58 |
| 3543 Pickwick Park Dr | 0.26mi | 4/2.0 (+1) | 1,991 (+15%) | 3mo | $259,000 | $130 | 56 |
| 3131 Beaver Glen Dr | 0.41mi | 4/2.5 (+1) | 1,968 (+14%) | 1mo | $299,900 | $152 | 50 |
| 3306 Brookdale Dr | 0.67mi | 3/2.0 | 1,559 (-10%) | 3mo | $209,990 | $135 | 49 |
| 5307 Jasper Grove Ct | 0.72mi | 4/2.0 (+1) | 1,943 (+12%) | 3mo | $299,000 | $154 | 39 |
Match score weights: distance 35% · size 25% · config 20% · recency 20%. Top-matched comps best support the ARV.
Projected returns pro-forma
0.48% appreciation · 0.0% rent growth · sell at horizon
- IRR
- -10.0%
- Equity multiple
- 0.53×
- Total profit
- $-31,245
- Equity at exit
- $73,895
- IRR
- -6.0%
- Equity multiple
- 0.36×
- Total profit
- $-42,065
- Equity at exit
- $93,477
Cash invested: $65,800 (down + closing). Projections, not guarantees.
Landlord ↔ Tenant lean methodology
- Overall (STATE)
- 87 Strongly Landlord-Friendly
- State Texas
- 87 Strongly Landlord-Friendly · R+5
- County
- — inherits STATE
- City
- — inherits STATE
ZIP-level market 77339
- Home prices YoY
- 0.2%
- Rents YoY
- -0.6%
- Active inventory
- 311
- Price-to-rent
- 10.5×
Monthly cashflow live
- Estimated rent
- $1,862 high interval (Pro) →
- Mortgage (P&I)
- −$1,232
- Tax from tax record
- −$490 /mo · $5,876/yr
- Insurance
- −$98
- HOA
- −$34
- Vacancy / Maint / Mgmt
- −$391
- Net cashflow
- $-383
Break-even live
UW: 25.0% down · 7.5% · 30yr · 1.5% tax · 5.0% vac · 8.0% maint · 8.0% mgmt
Financing live
Cash to close
- Down payment
- $58,750
- Closing costs
- $7,050
- Reserves months
- —
- Total cash needed
- —
Loan-product check · same deal, 3 products live
Conventional
25% down · 7.5% · 30yr
- Down + closing
- —
- Monthly P&I
- —
- Monthly cashflow
- —
- DSCR
- —
- Eligible?
- —
Personal DTI + credit; lowest rate.
DSCR
20% down · 8.5% · 30yr
- Down + closing
- —
- Monthly P&I
- —
- Monthly cashflow
- —
- DSCR
- —
- Eligible?
- —
No personal income docs; deal must DSCR.
Hard money
10% down · 12.0% · 12mo
- Down + closing
- —
- Monthly P&I
- —
- Monthly cashflow
- —
- DSCR
- —
- Eligible?
- —
Short-term bridge; refi at stabilization.
Rent comps 21 comps
| Address | Beds | Baths | Sqft | Rent | $/sqft | DOM | Units | Dist |
|---|---|---|---|---|---|---|---|---|
| 5714 Straight Way Kingwood, TX | 3.0 | 2.0 | 1788 | $1,830 | $1.02 | 19d | 1 | 0.19mi |
| 5110 Shady Gardens Dr Kingwood, TX | 3.0 | 3.0 | 1548 | $1,800 | $1.16 | 5d | 1 | 0.40mi |
| 3303 Sycamore Springs Dr Kingwood, TX | 4.0 | 2.5 | 2010 | $2,006 | $1.00 | 5d | 1 | 0.49mi |
| 3327 Sycamore Springs Dr Kingwood, TX | 3.0 | 2.0 | 1619 | $1,575 | $0.97 | 18d | 1 | 0.50mi |
| 3327 Sycamore Springs Dr Kingwood, TX | 3.0 | 2.0 | 1619 | $1,683 | $1.04 | 22d | 1 | 0.50mi |
| 3122 Birch Creek Dr Kingwood, TX | 3.0 | 2.0 | 1446 | $1,624 | $1.12 | 24d | 1 | 0.64mi |
| 2921 Sycamore Springs Dr Unit 2954 Kingwood, TX | 3.0 | 2.0 | 1245 | $1,624 | $1.30 | 10d | 1 | 0.69mi |
| 2921 Sycamore Springs Dr Unit 3112 Kingwood, TX | 3.0 | 2.0 | 1245 | $1,592 | $1.28 | 3d | 1 | 0.69mi |
| 3007 Birch Creek Dr Humble, TX | 3.0 | 2.0 | 1603 | $1,795 | $1.12 | 24d | 1 | 0.69mi |
| 2927 Sycamore Springs Dr Kingwood, TX | 3.0 | 2.0 | 1245 | $1,548 | $1.24 | 43d | 1 | 0.71mi |
| 4031 Sherwood St W Kingwood, TX | 3.0 | 2.0 | 1541 | $1,850 | $1.20 | 43d | 1 | 0.75mi |
| 4535 Echo Falls Dr Kingwood, TX | 4.0 | 2.5 | 2184 | $2,145 | $0.98 | 2d | 1 | 0.75mi |
| 3206 Abbey Field Ln Porter, TX | 3.0 | 2.0 | 1510 | $1,623 | $1.07 | 43d | 1 | 0.85mi |
| 9323 Darby Knoll Way Porter, TX | 4.0 | 2.5 | 2182 | $2,595 | $1.19 | 43d | 1 | 0.95mi |
| 2315 Shadbury Ct Kingwood, TX | 3.0 | 2.0 | 1487 | $1,725 | $1.16 | 43d | 1 | 1.11mi |
| 4432 Bethel Colony Trl Porter, TX | 3.0 | 2.0 | 1173 | $1,635 | $1.39 | 20d | 1 | 1.17mi |
| 6313 Barrington Cliff Trl Porter, TX | 3.0 | 2.0 | 1800 | $2,134 | $1.19 | 43d | 1 | 1.18mi |
| 6313 Barrington Cliff Trl Porter, TX | 3.0 | 2.0 | 1800 | $1,999 | $1.11 | 1d | 1 | 1.18mi |
| 4620 Peralta Heights Way Porter, TX | 3.0 | 2.0 | 1250 | $1,500 | $1.20 | 43d | 1 | 1.31mi |
| 23227 Albert Dr Porter, TX | 4.0 | 2.0 | 1800 | $2,300 | $1.28 | 43d | 1 | 1.37mi |
| 3714 Windy Haven Dr Kingwood, TX | 3.0 | 2.0 | 1454 | $1,799 | $1.24 | 43d | 1 | 1.45mi |
HOA detail
- Monthly dues
- $34 · $408/yr
- Likely covers
- landscaping
Listing history 6 events
-
2026-05-15$235,000 Active 987-char remark
-
2026-05-14historical $235,000 987-char remark
-
2002-04-02soldstatus
-
1998-09-18soldstatus
-
1998-09-01soldstatus $81,000
-
1997-02-24soldstatus
ⓘ Source: listings_history table (triggers on properties + properties_extension) + one-shot
backfill from property_details.listing_events for pre-trigger history.
Tax reassessment forecast TX · Resets to sale price
- Current annual tax
- $5,876 · $490/mo
- Projected year-2 tax
- $5,876 · $490/mo
- Expected delta
- $0/yr ($0/mo · 0.0%)
ⓘ Screening estimate from a state-policy table — verify with the county assessor before closing.
Climate risk First Street
- Flood 4/10 Moderate FEMA zone X (unshaded) · 22% chance over 30 yrs
- Wildfire 2/10 Low
- Heat 9/10 Extreme 7 d/yr ≥111°F today · 24 d/yr by 30 yrs out
- Wind 8/10 Severe 99% chance of damaging wind over 30 yrs
- Air quality 3/10 Moderate 2 unhealthy d/yr today · 3 by 30 yrs out
Nearby sold comps map
Loading sold comps map…
Walkable amenities ~0.75 mi
Loading nearby amenities…
Taxation est. · year 1
- Rental income
- $22,341
- − Mortgage interest
- −$13,164
- − Property taxes
- −$5,876
- − Insurance
- −$1,175
- − Repairs & maintenance
- −$1,787
- − Management
- −$1,787
- − HOA
- −$408
- − Depreciation
- −$6,836
- Taxable loss
- −$8,692
- Est. tax savings @ 24.0%
- +$2,086
- After-tax cash flow
- $-2,512/yr
For passive investors: Depreciation is non-cash, so a rental often shows a tax loss while cash-flowing — sheltering income. Rental losses are passive: they offset passive income freely, and up to $25,000/yr can offset ordinary (W-2) income if you actively participate and your MAGI is under $100k (phasing out to $0 by $150k); unused losses carry forward. On sale, claimed depreciation is recaptured at up to 25%, and gains may owe capital-gains tax (a 1031 exchange can defer both). Figures are a year-1 estimate at your 24.0% rate — not tax advice; consult a CPA.
Schools (NCES district)
- District
- Humble ISD
- NCES district ID
- 4823910
- Math proficiency
- 38% ▼ -11.00%
- Reading proficiency
- 44% ▼ -7.00%
- Median HH income
- $83,946
- Composite
- 38.55/100
- National rank
- #4171
- State rank
- #262 of 826 in TX
Livability — Houston
- Score
- 74/100
- State rank
- #184
- US rank
- #4771
Category grades
Schools grade is shown separately in the Schools card above.
Census & demographics
- Census place
- Houston, TX
- County
- Harris County · 4,702,590 people
- City population
- 3,226,434
- Metro
- Houston-The Woodlands-Sugar Land, TX
- Population (ZIP)
- 44,538
- Household income
- $84,102
- Rent vs Own
- Severe rent burden
- 2198.0
Population outlook (Harris County) Hauer SSP2
- Today (2025)
- 5,571,493 people
- By 2030
- 6,089,821 · +9.3%
- By 2040
- 7,142,806 · +28.2%
- By 2050
- 8,185,864 · +46.9%
- By 2075
- 10,574,329 · +89.8%
- By 2100
- 12,109,958 · +117.4%
Race, ethnicity, and origin ACS 2023
- Neighborhood character
- Diverse neighborhood (Simpson 0.58)
- Race & ethnicity
- White 59% Hispanic / Latino 24% Two or more races 13% Black 5% Asian 5%
- Hispanic origin (detail)
- Mexican 17%
- Common ancestry
- Lithuanian 3% Slovak 2% Portuguese 2%
- Foreign-born
- 12% · Canada, China, Jamaica
- Languages at home
- 77% English-only · Spanish 17% Other Indo-European 2% Vietnamese 1%
Political lean MEDSL · Harris
- 2024 margin
- Lean D (+5.5) · D 52.0% · R 46.4% · Other 1.6%
- 2008→2024 swing
- +3.9pp toward D · 2008: 1.6pp · 2024: 5.5pp
- All cycles
- 2024: D+5.5 2020: D+13.3 2016: D+12.4 2012: D+0.1 2008: D+1.6
Not yet ingested
- Civics
- —
Market trends
- HPI YoY
- ▲ 0.48%
- Current HPI
- 233.4147
- Rent YoY
- ▼ -0.59%
- Metro
- Houston-The Woodlands-Sugar Land, TX
- State GDP YoY
- ▲ 3.95%
- F500 in state
- 110
Industry mix (Fortune 500 HQ in TX)
| Industry | F500 HQs | Revenue |
|---|---|---|
| Energy | 16 | $1,198B |
|
||
| Technology | 5 | $198B |
|
||
| Engineering / Construction | 4 | $72B |
|
||
| Energy Services | 3 | $60B |
|
||
| Utilities | 3 | $41B |
|
||
| Healthcare | 2 | $330B |
|
||
Price history
+190.1% since first listed10 events — show timeline
- 2026-06-09 Sold (Public Records) — Public Records
- 2026-06-08 Sold (MLS) — HARMLS
- 2026-05-27 Pending — HARMLS
- 2026-05-22 Pending — HARMLS
- 2026-05-15 Listed $235,000 HARMLS
- 2026-05-14 Coming Soon $235,000 HARMLS
- 2002-04-02 Sold (Public Records) — Public Records
- 1998-09-18 Sold (Public Records) — Public Records
- 1998-09-01 Sold (Public Records) $81,000 Public Records
- 1997-02-24 Sold (Public Records) — Public Records
Property tax history
+6.8%/yrLatest (2025): $5,876 · +6.3% YoY. Source: county tax records.
Cash-flow waterfall
monthlySold comps — $/sqft
last 12 mo · ≤1 miLoading sold comps…