 🔨 Auction
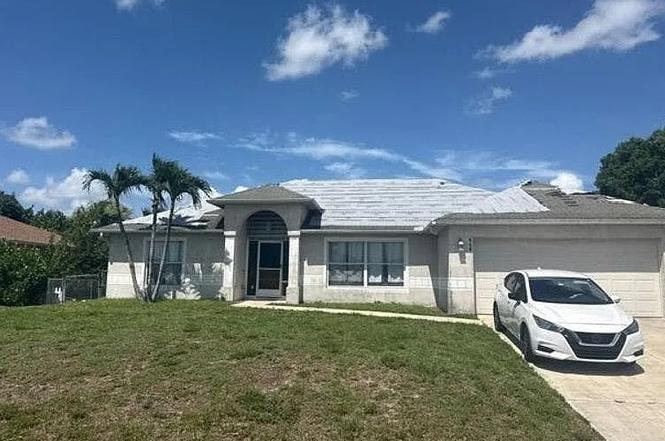
464 NW 1st Pl · Cape Coral, FL
Flood risk 3/10 · Minor
- FEMA flood zone
- X (unshaded)
- Chance of flooding over 30 yrs
- 0.12%
- Est. flood insurance / yr
- $507 – $1,088
Fire risk 1/10 · Minimal
- Est. fire insurance / yr
- $947 – $1,759
Heat risk 10/10 · Severe
- Hot days now (above 107°F)
- 7 days/yr
- Hot days in 30 yrs
- 29 days/yr
Wind risk 10/10 · Severe
- Chance of severe wind over 30 yrs
- 99.0%
Air-quality risk 2/10 · Minimal
- Unhealthy air days now
- 1 days/yr
- Unhealthy air days in 30 yrs
- 1 days/yr
Risk factors via First Street. Map © Google.
Why this score? — see what drove the F grade
The composite is a weighted blend of 9 inputs, each scored 0–100. Each bar is that input's sub-score; the figure is the points it added to the 100-point composite (weight × sub-score).
- ARV discount +7.5/15.0
- Cash flow +6.2/30.0
- Schools +4.1/10.0
- Livability +3.9/5.0
- Condition / age +2.5/5.0
- 1% rule +1.5/10.0
- Rent growth +1.1/5.0
- DSCR +0.5/10.0
- Appreciation +0.0/10.0
$5,000
🖨 Deal sheet 📄 Offer letter ✓ Due diligence
Listing remarks
Foreclosure Auction Ends June 25, 2026 at 9:00 AM EST. Explore this charming 3-bedroom, 2-bath residence set in a peaceful and well-located Cape Coral community. The list price is the opening bid for the online auction. Sold As-is. Explore more details and submit your bid through Federa.
Key facts
- 2 garage spots
Property features AI
Finance
- Other: Directions: From Pine Island Rd, turn north onto Del Prado Blvd N, then onto NE 1st Pl and continue to the property.
Exterior
- Parking: 2-car garage
- Home design: Residential property
- Construction: 1 story
- Exterior features: Lot zoned R1
Interior
- Bathrooms: 2 full bathrooms
- Interior features: Single-story layout
Neighborhood map
What this means for you Summary
Snapshot
- This is a 3-bed/2.0-bath single-family listed at $5k.
Deal economics
- At list price, monthly cash flow is $-666 ($-8k/yr) — negative.
- The deal already cash-flows at list — no discount required.
- Meets the 1% rule at list price ($2k rent vs $5k).
- Cap rate 4.1% vs local median 3.1% in Cape Coral — top-decile yield for the area; either an underpriced asset or a hidden risk that comps aren't pricing in. Stress-test before assuming the spread holds.
Location & tenants
- Location reads 77/100 on livability (#208 in FL, #3,098 nationally) — a middle-class / working-renter tenant base. Strengths: housing A+, health & safety A+, amenities B+; Watch: commute F.
- Lee (suburban): math 47% / reading 50% proficiency, ranked #42 of 73 in FL (top 58%) — families likely to look elsewhere, expect single-tenant / working-renter base with shorter leases.
- Market conditions: Rents falling (-5.6%/yr); 1597 active listings in the ZIP; 40 comparable units currently listed for rent nearby; rentals at typical pace (median 19d on market — plan ~3-4 weeks tenant-placement turnaround); 15,411 units permitted in Lee County in 2024 (4,686 in 5+ unit buildings).
- This rent runs 39% of the median local income ($73k/yr) — at the standard rent-burdened threshold; future hikes will face affordability resistance.
Forward outlook
- Local home prices are declining (-3.0%/yr); year-one equity from $3k of loan paydown is wiped out by about $11k of value loss. Plan a longer hold.
- Lee County population projected at +44% by 2050 — long-run rental-demand tailwind backs the buy-and-hold thesis.
Negotiation context
- Only 1 days on market — expect competitive offers; lowballing is unlikely to land.
Risks & watch-outs
- Watch-outs: property tax is 110.3% of price.
- Climate carrying-cost: severe wind risk, 99% chance of damaging wind over 30y; extreme-heat days projected 7→29/yr by 2055 (HVAC capex compounding) — expect insurance premiums to compound above CPI over the hold.
Questions for the listing agent
- What do current leases actually rent for vs. the listed asking? Can we see a recent rent roll and the last 12 months of T-12 income?
- Property tax is high relative to price — has the assessment been appealed recently, and will the sale trigger a re-assessment?
- Is there a deadline driving the sale (1031 exchange, divorce, estate, relocation)? That informs how much negotiation room exists.
- Schools are B-rated — typically a magnet for longer-tenancy family renters. What's the average tenant stay here, and is there a school-zone premium baked into asking?
- The area grade is low — what's the realistic commute time and amenity access for the typical tenant pool here? Any planned neighborhood developments (good or bad) we should know about?
- What's the average days-on-market for RENTAL listings here right now (not sales)? A rising rental-DOM trend means longer vacancies and softer asking-rent achievability than the comps imply.
- What's the recent tenant-quality profile in this submarket — average credit score on applications, eviction rate, late-payment / NSF rate, and stable-employment percentage? A property-management company in the area should have these aggregated.
- How much new for-sale + rental construction is in the pipeline within 1–3 miles? Heavy new supply typically softens prices + rents 12–24 months out; constrained supply supports both.
Investment metrics
- 1% rule
- 0.65% ✗
- Cap rate
- 4.12%
- Cash-on-cash
- -7.77%
- DSCR
- 0.65
- GRM
- 12.9
CMA / ARV
- ARV (on-the-fly)
- $367,686
- Comps found
- 12
Show comp detail 12 sales within ~0.75 mi
| Address | Dist | Beds/Ba | Sqft | Sold | Price | $/sf | Match |
|---|---|---|---|---|---|---|---|
| 204 NW 6th St | 0.51mi | 3/3.0 | 1,850 (-0%) | 0mo | $469,000 | $254 | 71 |
| 420 NW 1st Pl | 0.43mi | 3/3.0 | 1,868 (+1%) | 9mo | $480,000 | $257 | 68 |
| 525 NE 6th Ave | 0.65mi | 3/2.0 | 1,746 (-6%) | 0mo | $309,000 | $177 | 59 |
| 522 NE 5th Pl | 0.55mi | 4/2.0 (+1) | 1,800 (-3%) | 7mo | $517,000 | $287 | 58 |
| 212 NW 6th Ter | 0.55mi | 3/2.0 | 1,672 (-10%) | 1mo | $270,000 | $161 | 57 |
| 302 NW 2nd Ave | 0.53mi | 4/2.0 (+1) | 1,712 (-8%) | 4mo | $299,900 | $175 | 54 |
| 206 NW 3rd Ave | 0.67mi | 3/3.0 | 1,909 (+3%) | 8mo | $580,000 | $304 | 53 |
| 526 NE 5th Pl | 0.56mi | 4/3.0 (+1) | 1,931 (+4%) | 6mo | $302,500 | $157 | 53 |
| 211 NW 4th St | 0.52mi | 3/2.0 | 2,067 (+11%) | 9mo | $360,000 | $174 | 49 |
| 208 NW 6th Ter | 0.53mi | 4/3.0 (+1) | 2,020 (+9%) | 8mo | $400,000 | $198 | 45 |
| 621 NW 3rd Ave | 0.62mi | 4/3.0 (+1) | 2,020 (+9%) | 7mo | $399,000 | $198 | 41 |
| 922 Santa Barbara Blvd N | 0.69mi | 4/2.0 (+1) | 1,600 (-14%) | 1mo | $399,900 | $250 | 39 |
Match score weights: distance 35% · size 25% · config 20% · recency 20%. Top-matched comps best support the ARV.
Projected returns pro-forma
-3.0% appreciation · 0.0% rent growth · sell at horizon
- IRR
- -33.2%
- Equity multiple
- -0.06×
- Total profit
- $-108,937
- Equity at exit
- $54,823
- IRR
- -62.5%
- Equity multiple
- -0.71×
- Total profit
- $-176,235
- Equity at exit
- $31,791
Cash invested: $102,952 (down + closing). Projections, not guarantees.
Landlord ↔ Tenant lean methodology
- Overall (STATE)
- 87 Strongly Landlord-Friendly
- State Florida
- 87 Strongly Landlord-Friendly · R+3
- County
- — inherits STATE
- City
- — inherits STATE
ZIP-level market 33909
- Home prices YoY
- -23.1%
- Rents YoY
- -5.6%
- Active inventory
- 1597
- Price-to-rent
- 0.2×
Monthly cashflow live
- Estimated rent
- $2,373 high interval (Pro) →
- Mortgage (P&I)
- −$1,928
- Tax est. 1.5%
- −$460 /mo · $5,515/yr
- Insurance
- −$153
- HOA
- −$0
- Vacancy / Maint / Mgmt
- −$498
- Net cashflow
- $-666
Break-even live
UW: 25.0% down · 7.5% · 30yr · 1.5% tax · 5.0% vac · 8.0% maint · 8.0% mgmt
Financing live
Cash to close
- Down payment
- $91,922
- Closing costs
- $11,031
- Reserves months
- —
- Total cash needed
- —
Loan-product check · same deal, 3 products live
Conventional
25% down · 7.5% · 30yr
- Down + closing
- —
- Monthly P&I
- —
- Monthly cashflow
- —
- DSCR
- —
- Eligible?
- —
Personal DTI + credit; lowest rate.
DSCR
20% down · 8.5% · 30yr
- Down + closing
- —
- Monthly P&I
- —
- Monthly cashflow
- —
- DSCR
- —
- Eligible?
- —
No personal income docs; deal must DSCR.
Hard money
10% down · 12.0% · 12mo
- Down + closing
- —
- Monthly P&I
- —
- Monthly cashflow
- —
- DSCR
- —
- Eligible?
- —
Short-term bridge; refi at stabilization.
Rent comps 40 comps
| Address | Beds | Baths | Sqft | Rent | $/sqft | DOM | Units | Dist |
|---|---|---|---|---|---|---|---|---|
| 507 NW 1st Ave Cape Coral, FL | 4.0 | 2.0 | 1695 | $2,395 | $1.41 | 23d | 1 | 0.35mi |
| 213 NW 5th St Cape Coral, FL | 4.0 | 2.0 | 1809 | $2,195 | $1.21 | 3d | 1 | 0.52mi |
| 1 NW 8th Ter Cape Coral, FL | 3.0 | 3.0 | 1909 | $5,800 | $3.04 | 19d | 1 | 0.54mi |
| 409 Tropicana Pkwy E Cape Coral, FL | 4.0 | 2.0 | 1695 | $2,349 | $1.39 | 23d | 1 | 0.54mi |
| 118 NW 2nd Ave Cape Coral, FL | 3.0 | 3.0 | 1932 | $3,600 | $1.86 | 16d | 1 | 0.56mi |
| 222 NW 4th Ter Cape Coral, FL | 4.0 | 2.0 | 1695 | $2,450 | $1.45 | 23d | 1 | 0.57mi |
| 30 SE 1st Pl Unit 3013 Cape Coral, FL | 4.0 | 3.0 | 2020 | $2,300 | $1.14 | 23d | 1 | 0.57mi |
| 204 NW 1st St Cape Coral, FL | 4.0 | 3.0 | 1826 | $2,300 | $1.26 | 3d | 1 | 0.58mi |
| 224 NW 2nd Pl Cape Coral, FL | 3.0 | 2.0 | 1733 | $2,750 | $1.59 | 23d | 1 | 0.60mi |
| 212 NW 1st St Cape Coral, FL | 3.0 | 2.0 | 1246 | $1,775 | $1.42 | 3d | 1 | 0.61mi |
| 227 NW 3rd Ter Cape Coral, FL | 3.0 | 2.0 | 1975 | $2,300 | $1.16 | 21d | 1 | 0.61mi |
| 221 NW 3rd Pl Cape Coral, FL | 4.0 | 2.0 | 2204 | $2,600 | $1.18 | 16d | 1 | 0.68mi |
| 227 Tropicana Pkwy W Cape Coral, FL | 4.0 | 2.0 | 1833 | $1,995 | $1.09 | 2d | 1 | 0.70mi |
| 217 NW 9th St Cape Coral, FL | 3.0 | 2.0 | 1756 | $2,271 | $1.29 | 3d | 1 | 0.77mi |
| 134 SE 1st Ave Cape Coral, FL | 3.0 | 2.0 | 1680 | $2,331 | $1.39 | 3d | 1 | 0.78mi |
| 142 SE 1st Ave Cape Coral, FL | 3.0 | 2.0 | 1554 | $1,900 | $1.22 | 14d | 1 | 0.81mi |
| 159 SE Santa Barbara Pl Cape Coral, FL | 3.0 | 2.0 | 1412 | $2,250 | $1.59 | 23d | 1 | 0.84mi |
| 149 Santa Barbara Blvd S Cape Coral, FL | 3.0 | 2.0 | 1250 | $1,520 | $1.22 | 23d | 1 | 0.84mi |
| 1109 NE 2nd Pl Cape Coral, FL | 3.0 | 2.0 | 1272 | $1,900 | $1.49 | 23d | 1 | 0.85mi |
| 318 NW 8th Ter Cape Coral, FL | 3.0 | 2.0 | 1500 | $1,900 | $1.27 | 3d | 1 | 0.85mi |
| 1114 NE 3rd Ave Cape Coral, FL | 3.0 | 2.0 | 1558 | $2,750 | $1.77 | 23d | 1 | 0.87mi |
| 410 SE 1st Ter Cape Coral, FL | 4.0 | 2.0 | 2330 | $2,800 | $1.20 | 23d | 1 | 0.89mi |
| 410 SE 1st Ter Cape Coral, FL | 4.0 | 2.0 | 2330 | $2,600 | $1.12 | 16d | 1 | 0.89mi |
| 1113 NW 1st Ave Cape Coral, FL | 3.0 | 2.0 | 1286 | $1,626 | $1.26 | 3d | 1 | 0.91mi |
| 106 NE 8th Pl Cape Coral, FL | 4.0 | 3.0 | 2108 | $3,995 | $1.90 | 23d | 1 | 0.93mi |
| 1001 NE 6th Ave Cape Coral, FL | 3.0 | 2.0 | 1416 | $4,410 | $3.11 | 23d | 1 | 0.94mi |
| 203 NE 9th Ave Cape Coral, FL | 3.0 | 2.0 | 1756 | $1,715 | $0.98 | 16d | 1 | 0.94mi |
| 1123 NW 2nd Ave Cape Coral, FL | 4.0 | 3.0 | 2020 | $4,700 | $2.33 | 23d | 1 | 0.97mi |
| 237 SE 3rd St Cape Coral, FL | 4.0 | 2.0 | 1828 | $2,326 | $1.27 | 3d | 1 | 0.99mi |
| 852 NE 7th Pl Cape Coral, FL | 3.0 | 2.0 | 1610 | $6,800 | $4.22 | 3d | 1 | 0.99mi |
| 1140 NW 1st Ave Cape Coral, FL | 3.0 | 2.0 | 1452 | $1,850 | $1.27 | 23d | 1 | 1.02mi |
| 1140 NW 1st Ave Cape Coral, FL | 3.0 | 2.0 | 1452 | $1,850 | $1.27 | 14d | 1 | 1.02mi |
| 302 SE 3rd St Cape Coral, FL | 3.0 | 2.0 | 1404 | $2,055 | $1.46 | 2d | 1 | 1.03mi |
| 302 SE 3rd St Cape Coral, FL | 3.0 | 2.0 | 1404 | $2,240 | $1.60 | 21d | 1 | 1.03mi |
| 1105 NE 6th Pl Cape Coral, FL | 3.0 | 2.0 | 1505 | $1,999 | $1.33 | 23d | 1 | 1.06mi |
| 1217 Santa Barbara Blvd N Cape Coral, FL | 3.0 | 2.0 | 1790 | $2,300 | $1.28 | 23d | 1 | 1.07mi |
| 526 NW 1st Ln Cape Coral, FL | 4.0 | 2.0 | 1793 | $2,000 | $1.12 | 23d | 1 | 1.08mi |
| 526 NW 9th St Cape Coral, FL | 4.0 | 2.0 | 1800 | $2,100 | $1.17 | 3d | 1 | 1.10mi |
| 613 SE 2nd Ter Cape Coral, FL | 3.0 | 2.0 | 1577 | $4,100 | $2.60 | 3d | 1 | 1.11mi |
| 1221 NE 4th Ave Cape Coral, FL | 3.0 | 2.0 | 1614 | $1,995 | $1.24 | 14d | 1 | 1.11mi |
Listing history 2 events
-
2026-06-17remarks 288-char remark
-
2026-06-17$5,000 Active 1 DOM
ⓘ Source: listings_history table (triggers on properties + properties_extension) + one-shot
backfill from property_details.listing_events for pre-trigger history.
Climate risk First Street
- Flood 3/10 Moderate FEMA zone X (unshaded) · 12% chance over 30 yrs
- Wildfire 1/10 Low
- Heat 10/10 Extreme 7 d/yr ≥107°F today · 29 d/yr by 30 yrs out
- Wind 10/10 Extreme 99% chance of damaging wind over 30 yrs
- Air quality 2/10 Low 1 unhealthy d/yr today · 1 by 30 yrs out
Nearby sold comps map
Loading sold comps map…
Walkable amenities ~0.75 mi
Loading nearby amenities…
Taxation est. · year 1
- Rental income
- $28,476
- − Mortgage interest
- −$20,596
- − Property taxes
- −$5,515
- − Insurance
- −$1,838
- − Repairs & maintenance
- −$2,278
- − Management
- −$2,278
- − Depreciation
- −$10,696
- Taxable loss
- −$14,726
- Est. tax savings @ 24.0%
- +$3,534
- After-tax cash flow
- $-4,461/yr
For passive investors: Depreciation is non-cash, so a rental often shows a tax loss while cash-flowing — sheltering income. Rental losses are passive: they offset passive income freely, and up to $25,000/yr can offset ordinary (W-2) income if you actively participate and your MAGI is under $100k (phasing out to $0 by $150k); unused losses carry forward. On sale, claimed depreciation is recaptured at up to 25%, and gains may owe capital-gains tax (a 1031 exchange can defer both). Figures are a year-1 estimate at your 24.0% rate — not tax advice; consult a CPA.
Schools (NCES district)
- District
- Lee
- NCES district ID
- 1201080
- Math proficiency
- 47% ▼ -11.00%
- Reading proficiency
- 50% ▼ -4.00%
- Median HH income
- $49,518
- Composite
- 41.49/100
- National rank
- #3458
- State rank
- #42 of 73 in FL
Livability — Cape Coral
- Score
- 77/100
- State rank
- #208
- US rank
- #3098
Category grades
Schools grade is shown separately in the Schools card above.
Census & demographics
- Census place
- Cape Coral, FL
- County
- Lee County · 788,662 people
- City population
- 217,388
- Metro
- Cape Coral-Fort Myers, FL
- Population (ZIP)
- 40,231
- Household income
- $73,053
- Rent vs Own
- Severe rent burden
- 1657.0
Population outlook (Lee County) Hauer SSP2
- Today (2025)
- 871,946 people
- By 2030
- 955,468 · +9.6%
- By 2040
- 1,113,587 · +27.7%
- By 2050
- 1,256,891 · +44.1%
- By 2075
- 1,560,270 · +78.9%
- By 2100
- 1,726,848 · +98.0%
Race, ethnicity, and origin ACS 2023
- Neighborhood character
- Diverse neighborhood (Simpson 0.55)
- Race & ethnicity
- White 56% Hispanic / Latino 36% Two or more races 24% Black 3% Asian 1%
- Hispanic origin (detail)
- Puerto Rican 7% Cuban 14% Dominican 4%
- Common ancestry
- Romanian 2% Lithuanian 2% Serbian 1%
- Foreign-born
- 20% · Canada, Jamaica
- Languages at home
- 69% English-only · Spanish 27% Other Indo-European 1% German/W. Germanic 1%
Political lean MEDSL · Lee
- 2024 margin
- Strong R (+28.4) · D 35.5% · R 63.9%
- 2008→2024 swing
- -18.0pp toward R · 2008: -10.4pp · 2024: -28.4pp
- All cycles
- 2024: R+28.4 2020: R+19.2 2016: R+20.4 2012: R+16.6 2008: R+10.4
Not yet ingested
- Civics
- —
Market trends
- HPI YoY
- ▼ -94.24%
- Current HPI
- 313.8761
- Rent YoY
- ▼ -5.60%
- Metro
- Cape Coral-Fort Myers, FL
- State GDP YoY
- ▲ 3.28%
- F500 in state
- 36
Industry mix (Fortune 500 HQ in FL)
| Industry | F500 HQs | Revenue |
|---|---|---|
| Industrial Technology | 2 | $29B |
|
||
| Insurance | 2 | $17B |
|
||
| Retail | 1 | $60B |
|
||
| Technology Distribution | 1 | $58B |
|
||
| Homebuilding | 1 | $35B |
|
||
| Technology Manufacturing | 1 | $35B |
|
||
Price history
1 event — show timeline
- 2026-06-17 Listed $5,000 NFMLS
Cash-flow waterfall
monthlySold comps — $/sqft
last 12 mo · ≤1 miLoading sold comps…