None · Toledo, OH
Flood risk No data
- FEMA flood zone
- —
- Chance of flooding over 30 yrs
- —
- Est. flood insurance / yr
- —
Fire risk No data
- Est. fire insurance / yr
- —
Heat risk No data
- Hot days now (above threshold)
- —
- Hot days in 30 yrs
- —
Wind risk No data
- Chance of severe wind over 30 yrs
- —
Air-quality risk No data
- Unhealthy air days now
- —
- Unhealthy air days in 30 yrs
- —
Risk factors via First Street. Map © Google.
Why this score? — see what drove the B- grade
The composite is a weighted blend of 9 inputs, each scored 0–100. Each bar is that input's sub-score; the figure is the points it added to the 100-point composite (weight × sub-score).
- Cash flow +24.9/30.0
- ARV discount +15.0/15.0
- DSCR +8.1/10.0
- 1% rule +6.5/10.0
- Rent growth +4.0/5.0
- Schools +3.5/10.0
- Livability +3.3/5.0
- Condition / age +2.5/5.0
- Appreciation +0.0/10.0
$105,000
🖨 Deal sheet 📄 Offer letter ✓ Due diligence
Listing remarks
NOTICE: We are not considering seller financing or creative financing offers that do not consist of us in recorded first lien position with a minimum of 30% down. Thank you for understanding! This property is being sold as part of an 46-unit portfolio or a 5-unit sub-portfolio. In place cap is ~8.5%, pro forma cap is ~11.0%, and occupancy is 100%. Asking price for the 46-unit portfolio is $3.57M and asking price for the 11-unit sub-portfolio is $1,045,000. The sub-portfolio includes 549 Spencer, 560 Williamsville, 26 Magyar, 3256 Jeannette, 1413 Colburn, 1912 Greenwood, 2074 Price, 4321 Burnham, 4345 Burnham, 615 Cuthbert Rd, and 4228 N Lockwood. The entire 46-unit list can be found in the
Key facts
- 5,201 sq ft lot
- Garage
- Built 1925
Neighborhood map
What this means for you Summary
Snapshot
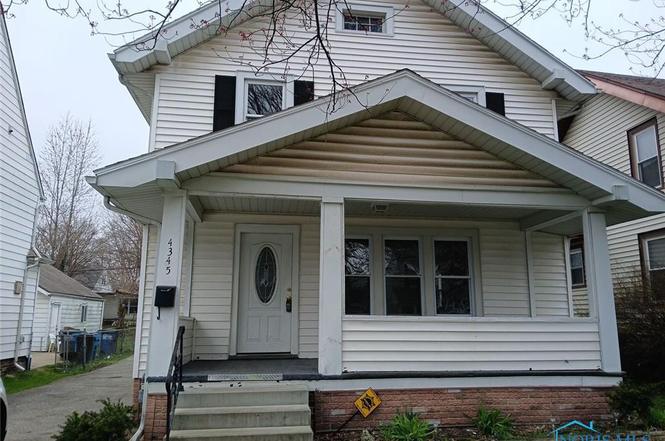
- This is a 3-bed/1.0-bath single-family listed at $105k.
Deal economics
- At list price, monthly cash flow is $227 ($3k/yr) — positive.
- The deal already cash-flows at list — no discount required.
- Meets the 1% rule at list price ($1k rent vs $105k).
- Recommended offer: $92k (12.0% below list) — sets the bar for market timing.
Location & tenants
- Location reads 66/100 on livability (#645 in OH) — a middle-class / working-renter tenant base. Strengths: cost of living A+, housing A+, health & safety A+; Watch: amenities C-, schools D-, crime F.
- Washington Local (urban): math 37% / reading 47% proficiency, ranked #528 of 656 in OH (top 80%) — families likely to look elsewhere, expect single-tenant / working-renter base with shorter leases.
- Market conditions: Rents rising fast (+6.0%/yr); 92 active listings in the ZIP; 11 comparable units currently listed for rent nearby; rentals at typical pace (median 24d on market — plan ~3-4 weeks tenant-placement turnaround); 415 units permitted in Lucas County in 2024 (122 in 5+ unit buildings).
Forward outlook
- Local home prices are declining (-3.0%/yr); year-one equity from $726 of loan paydown is wiped out by about $3k of value loss. Plan a longer hold.
- Lucas County population projected at -16% by 2050 — secular population decline; favor cash flow + early exit over multi-decade hold.
- At projected returns (-3.0% appreciation + 6.0% rent growth), your $29k cash investment doubles in ~9 years — after that, you're playing with house money.
Negotiation context
- It's been on market 155 days — a 12% lower offer ($92k) is reasonable based on typical stale-listing flexibility.
- 2 sale attempts; this cycle's ask has dropped $12k (10%) from the opening price — seller is motivated, your offer sets the floor, not the list.
Risks & watch-outs
- Watch-outs: built in 1925 — expect roof / HVAC / electrical / plumbing capex.
Questions for the listing agent
- It's been on market 155 days. Have you received any prior offers? Is the seller open to a 12% concession, seller financing, or rate buy-down credit?
- Built in 1925 — when were the roof, HVAC, electrical panel, plumbing, and water heater last replaced?
- Why hasn't it sold? Are there any deal-killer items the seller is aware of (foundation, flood, title, zoning, code violations)?
- Is there a deadline driving the sale (1031 exchange, divorce, estate, relocation)? That informs how much negotiation room exists.
- Schools are D-rated, which usually means shorter tenancies and higher turnover. Who's the typical renter profile here, and what's been the actual vacancy rate?
- Crime grade is F in this area — have there been break-ins, vandalism, or insurance claims at this property in the last 3 years? What carrier currently insures it and at what premium?
- What's the average days-on-market for RENTAL listings here right now (not sales)? A rising rental-DOM trend means longer vacancies and softer asking-rent achievability than the comps imply.
- What's the recent tenant-quality profile in this submarket — average credit score on applications, eviction rate, late-payment / NSF rate, and stable-employment percentage? A property-management company in the area should have these aggregated.
- How much new for-sale + rental construction is in the pipeline within 1–3 miles? Heavy new supply typically softens prices + rents 12–24 months out; constrained supply supports both.
Investment metrics
- 1% rule
- 1.15% ✓
- Cap rate
- 8.89%
- Cash-on-cash
- 9.26%
- DSCR
- 1.41
- GRM
- 7.3
CMA / ARV
- ARV (on-the-fly)
- $134,160
- Comps found
- 12
Show comp detail 12 sales within ~0.75 mi
| Address | Dist | Beds/Ba | Sqft | Sold | Price | $/sf | Match |
|---|---|---|---|---|---|---|---|
| — | 0.00mi | 3/1.0 | 1,290 (0%) | 0mo | $85,000 | $66 | 100 |
| 47 W Crawford Ave | 0.52mi | 3/1.0 | 1,280 (-1%) | 3mo | $122,000 | $95 | 72 |
| 31 W Capistrano Ave | 0.51mi | 3/1.5 | 1,252 (-3%) | 1mo | $140,000 | $112 | 68 |
| 306 Warrington Rd | 0.36mi | 3/1.0 | 1,176 (-9%) | 10mo | $137,000 | $116 | 60 |
| 238 E Northgate Pkwy | 0.47mi | 2/1.5 (-1) | 1,336 (+4%) | 7mo | $119,666 | $90 | 59 |
| 301 E Northgate Pkwy | 0.50mi | 3/1.0 | 1,192 (-8%) | 9mo | $115,000 | $96 | 56 |
| 118 W Poinsetta Ave | 0.61mi | 3/1.0 | 1,252 (-3%) | 13mo | $129,900 | $104 | 56 |
| 110 Pasadena Blvd | 0.68mi | 3/1.5 | 1,333 (+3%) | 7mo | $88,000 | $66 | 55 |
| 303 W Crawford Ave | 0.72mi | 3/1.0 | 1,197 (-7%) | 4mo | $129,000 | $108 | 50 |
| 23 W Capistrano Ave | 0.49mi | 3/2.0 | 1,156 (-10%) | 7mo | $92,000 | $80 | 50 |
| 42 California Blvd | 0.58mi | 3/1.0 | 1,102 (-15%) | 11mo | $125,000 | $113 | 39 |
| 232 W Capistrano Ave | 0.69mi | 3/1.0 | 1,118 (-13%) | 13mo | $146,000 | $131 | 35 |
Match score weights: distance 35% · size 25% · config 20% · recency 20%. Top-matched comps best support the ARV.
Projected returns pro-forma
-3.0% appreciation · 6.01% rent growth · sell at horizon
- IRR
- 1.0%
- Equity multiple
- 1.04×
- Total profit
- $1,215
- Equity at exit
- $15,656
- IRR
- 13.5%
- Equity multiple
- 2.23×
- Total profit
- $36,159
- Equity at exit
- $9,078
Cash invested: $29,400 (down + closing). Projections, not guarantees.
Landlord ↔ Tenant lean methodology
- Overall (STATE)
- 73 Landlord-Friendly
- State Ohio
- 73 Landlord-Friendly · R+6
- County
- — inherits STATE
- City
- — inherits STATE
ZIP-level market 43612
- Home prices YoY
- -17.5%
- Rents YoY
- 6.0%
- Active inventory
- 92
- Price-to-rent
- 7.3×
Monthly cashflow live
- Estimated rent
- $1,206 high interval (Pro) →
- Mortgage (P&I)
- −$551
- Tax est. 1.5%
- −$131 /mo · $1,575/yr
- Insurance
- −$44
- HOA
- −$0
- Vacancy / Maint / Mgmt
- −$253
- Net cashflow
- $227
Break-even live
UW: 25.0% down · 7.5% · 30yr · 1.5% tax · 5.0% vac · 8.0% maint · 8.0% mgmt
Financing live
Cash to close
- Down payment
- $26,250
- Closing costs
- $3,150
- Reserves months
- —
- Total cash needed
- —
Loan-product check · same deal, 3 products live
Conventional
25% down · 7.5% · 30yr
- Down + closing
- —
- Monthly P&I
- —
- Monthly cashflow
- —
- DSCR
- —
- Eligible?
- —
Personal DTI + credit; lowest rate.
DSCR
20% down · 8.5% · 30yr
- Down + closing
- —
- Monthly P&I
- —
- Monthly cashflow
- —
- DSCR
- —
- Eligible?
- —
No personal income docs; deal must DSCR.
Hard money
10% down · 12.0% · 12mo
- Down + closing
- —
- Monthly P&I
- —
- Monthly cashflow
- —
- DSCR
- —
- Eligible?
- —
Short-term bridge; refi at stabilization.
Rent comps 11 comps
| Address | Beds | Baths | Sqft | Rent | $/sqft | DOM | Units | Dist |
|---|---|---|---|---|---|---|---|---|
| 5207 Bennett Rd Toledo, OH | 2.0 | 2.0 | 1109 | $1,200 | $1.08 | 14d | 1 | 0.95mi |
| 4220 Caroline Ave Toledo, OH | 3.0 | 1.0 | 944 | $1,095 | $1.16 | 44d | 1 | 1.27mi |
| 4140 Caroline Ave Toledo, OH | 3.0 | 1.5 | 1378 | $1,650 | $1.20 | 23d | 1 | 1.31mi |
| 4406 Asbury Dr Toledo, OH | 4.0 | 2.0 | 1089 | $1,550 | $1.42 | 14d | 1 | 1.33mi |
| 927 W Northgate Pkwy Toledo, OH | 2.0 | 1.0 | 896 | $1,100 | $1.23 | 14d | 1 | 1.42mi |
| 4124 Vermaas Ave Toledo, OH | 2.0 | 1.0 | 1245 | $997 | $0.80 | 44d | 1 | 1.42mi |
| 4129 Vermaas Ave Toledo, OH | 3.0 | 1.5 | 1385 | $1,250 | $0.90 | 44d | 1 | 1.44mi |
| 3905 Peru St Toledo, OH | 4.0 | 3.0 | 1548 | $1,300 | $0.84 | 21d | 1 | 1.46mi |
| 4039 Vermaas Ave Toledo, OH | 2.0 | 1.0 | 900 | $900 | $1.00 | 23d | 1 | 1.48mi |
| 3950 Woodhaven Dr Toledo, OH | 2.0 | 1.0 | 1072 | $745 | $0.69 | 23d | 1 | 1.49mi |
| 405 E Manhattan Blvd Toledo, OH | 2.0 | 1.0 | 1000 | $900 | $0.90 | 14d | 1 | 1.49mi |
Listing history 6 events
-
2026-03-16status Pending
-
2026-01-14price $105,000
-
2025-12-24status Active
-
2025-12-12status Pending
-
2025-11-10price $113,440
-
2025-09-29$116,500 Active
ⓘ Source: listings_history table (triggers on properties + properties_extension) + one-shot
backfill from property_details.listing_events for pre-trigger history.
Nearby sold comps map
Loading sold comps map…
Walkable amenities ~0.75 mi
Loading nearby amenities…
Taxation est. · year 1
- Rental income
- $14,469
- − Mortgage interest
- −$5,882
- − Property taxes
- −$1,575
- − Insurance
- −$525
- − Repairs & maintenance
- −$1,157
- − Management
- −$1,157
- − Depreciation
- −$3,055
- Taxable income
- $1,117
- Est. tax owed @ 24.0%
- −$268
- After-tax cash flow
- $2,454/yr
For passive investors: Depreciation is non-cash, so a rental often shows a tax loss while cash-flowing — sheltering income. Rental losses are passive: they offset passive income freely, and up to $25,000/yr can offset ordinary (W-2) income if you actively participate and your MAGI is under $100k (phasing out to $0 by $150k); unused losses carry forward. On sale, claimed depreciation is recaptured at up to 25%, and gains may owe capital-gains tax (a 1031 exchange can defer both). Figures are a year-1 estimate at your 24.0% rate — not tax advice; consult a CPA.
Schools (NCES district)
- District
- Washington Local
- NCES district ID
- 3904823
- Math proficiency
- 37% ▼ -20.00%
- Reading proficiency
- 47% ▼ -11.00%
- Median HH income
- $42,105
- Composite
- 35.36/100
- National rank
- #4957
- State rank
- #528 of 656 in OH
Livability — Toledo
- Score
- 66/100
- State rank
- #645
- US rank
- #11442
Category grades
Schools grade is shown separately in the Schools card above.
Census & demographics
- Census place
- Toledo, OH
- County
- Lucas County · 380,724 people
- City population
- 280,811
- Metro
- Toledo, OH
- Population (ZIP)
- 28,480
- Household income
- $50,728
- Rent vs Own
- Severe rent burden
- 1203.0
Population outlook (Lucas County) Hauer SSP2
- Today (2025)
- 420,751 people
- By 2030
- 410,187 · -2.5%
- By 2040
- 384,019 · -8.7%
- By 2050
- 355,125 · -15.6%
- By 2075
- 291,683 · -30.7%
- By 2100
- 233,670 · -44.5%
Race, ethnicity, and origin ACS 2023
- Neighborhood character
- Majority White (63%)
- Race & ethnicity
- White 63% Black 23% Two or more races 10% Hispanic / Latino 9%
- Hispanic origin (detail)
- Mexican 6% Puerto Rican 2%
- Common ancestry
- Romanian 9% Lithuanian 3% Italian 1%
- Foreign-born
- 2% · Canada
- Languages at home
- 96% English-only · Spanish 2% French/Haitian/Cajun 1%
Political lean MEDSL · Lucas
- 2024 margin
- D (+12.6) · D 55.8% · R 43.2%
- 2008→2024 swing
- -18.9pp toward R · 2008: 31.4pp · 2024: 12.6pp
- All cycles
- 2024: D+12.6 2020: D+16.8 2016: D+17.4 2012: D+30.4 2008: D+31.4
Not yet ingested
- Civics
- —
Market trends
- HPI YoY
- ▼ -50.05%
- Current HPI
- 235.5389
- Rent YoY
- ▲ 6.01%
- Metro
- Toledo, OH
- State GDP YoY
- ▲ 1.98%
- F500 in state
- 48
Industry mix (Fortune 500 HQ in OH)
| Industry | F500 HQs | Revenue |
|---|---|---|
| Insurance | 3 | $145B |
|
||
| Industrial Machinery | 3 | $49B |
|
||
| Financial Services | 3 | $24B |
|
||
| Consumer Goods | 2 | $93B |
|
||
| Aerospace / Defense | 2 | $47B |
|
||
| Utilities | 2 | $33B |
|
||
Price history
-9.9% since first listed6 events — show timeline
- 2026-03-16 Pending — NORIS
- 2026-01-14 Price Changed $105,000 NORIS
- 2025-12-24 Relisted — NORIS
- 2025-12-12 Pending — NORIS
- 2025-11-10 Price Changed $113,440 NORIS
- 2025-09-29 Listed $116,500 NORIS
Cash-flow waterfall
monthlySold comps — $/sqft
last 12 mo · ≤1 miLoading sold comps…