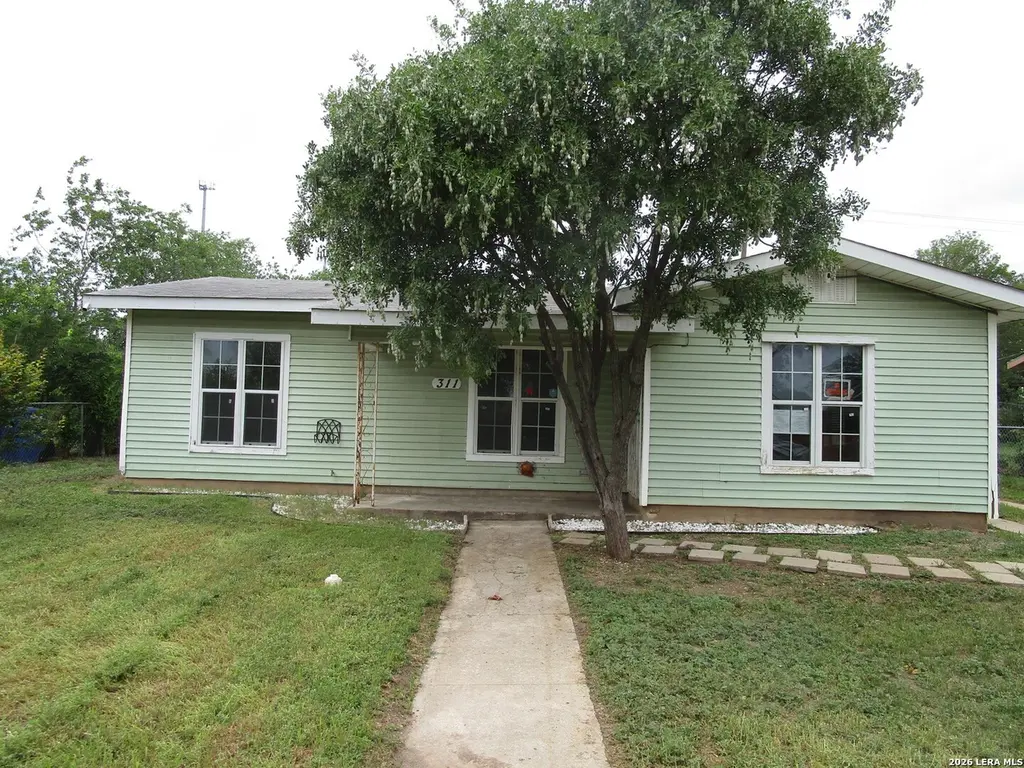
311 Bushick · San Antonio, TX
Flood risk 1/10 · Minimal
- FEMA flood zone
- X (unshaded)
- Chance of flooding over 30 yrs
- 0.0%
- Est. flood insurance / yr
- $507 – $1,088
Fire risk 3/10 · Minor
- Est. fire insurance / yr
- $1,222 – $2,270
Heat risk 8/10 · Major
- Hot days now (above 108°F)
- 7 days/yr
- Hot days in 30 yrs
- 22 days/yr
Wind risk 8/10 · Major
- Chance of severe wind over 30 yrs
- 80.0%
Air-quality risk 2/10 · Minimal
- Unhealthy air days now
- 0 days/yr
- Unhealthy air days in 30 yrs
- 2 days/yr
Risk factors via First Street. Map © Google.
Why this score? — see what drove the B- grade
The composite is a weighted blend of 9 inputs, each scored 0–100. Each bar is that input's sub-score; the figure is the points it added to the 100-point composite (weight × sub-score).
- Cash flow +30.0/30.0
- 1% rule +10.0/10.0
- DSCR +10.0/10.0
- ARV discount +7.5/15.0
- Livability +4.0/5.0
- Condition / age +2.5/5.0
- Rent growth +1.7/5.0
- Schools +1.4/10.0
- Appreciation +0.0/10.0
$70,000
🖨 Deal sheet 📄 Offer letter ✓ Due diligence
Listing remarks MLS
This house has a ton of charm and would make an awesome starter home for a young family. Solid home in quiet neighborhood. Come see it today. MULTIPLE OFFERS RECIEVED, HIGHEST AND BEST DUE BY 10/3/22
Key facts
- 7,187 sq ft lot
- Built 1953
- Listed 10 days
Property features AI
Finance
- Other: Possession at closing/funding; Listing handled by TruStar Real Estate
- Financial info: Down payment resource not available
- HOA & community: Subdivision: Pecan Valley
Exterior
- Utilities: Water system available; Sewer system available
- Home design: Pre-owned property; Approximate age: 73 years
- Construction: Slab foundation; Composition roof
- Exterior features: Siding exterior
Interior
- Kitchen: Kitchen (approximately 8 x 9)
- Bedrooms: Primary bedroom on lower level (approximately 11 x 11); Bedroom 2 (approximately 11 x 9); Bedroom 3 (approximately 11 x 9)
- Flooring: Laminate flooring
- Bathrooms: 1 full bathroom
- Heating & cooling: Other heating (see remarks); Other heating fuel (see remarks); Other air conditioning (see remarks)
- Interior features: Ceiling fans; Living and dining area combined; All window coverings remain
Neighborhood map
What this means for you Summary
Snapshot
- This is a 3-bed/1.0-bath single-family listed at $70k.
Deal economics
- At list price, monthly cash flow is $614 ($7k/yr) — positive.
- The deal already cash-flows at list — no discount required.
- Meets the 1% rule at list price ($1k rent vs $70k).
- Cap rate 16.8% vs local median 3.8% in San Antonio — top-decile yield for the area; either an underpriced asset or a hidden risk that comps aren't pricing in. Stress-test before assuming the spread holds.
Location & tenants
- Location reads 80/100 on livability (#31 in TX, #1,616 nationally) — a professional / high-income tenant draw. Strengths: amenities A+, commute A+, cost of living A+; Watch: crime F.
- San Antonio ISD (urban): math 12% / reading 22% proficiency, ranked #805 of 826 in TX (top 98%) — low school quality limits family demand, transient renter base, plan for 1-2y turnover; 80% free/reduced lunch — lower-income household profile, screen leases tightly.
- Zoned schools: Highland Hills El (math 10% / reading 23%, grade F, #3,946 of 4,322 statewide, top 92%, 618 students, 94% FRL); Highlands H S (math 18% / reading 27%, grade F, #1,354 of 1,632 statewide, top 83%, 1,651 students, 92% FRL).
- Market conditions: Rents falling (-3.4%/yr); 325 active listings in the ZIP; 27 comparable units currently listed for rent nearby; rentals at typical pace (median 15d on market — plan ~3-4 weeks tenant-placement turnaround); 8,308 units permitted in Bexar County in 2024 (2,506 in 5+ unit buildings).
- This rent runs 32% of the median local income ($52k/yr) — at the standard rent-burdened threshold; future hikes will face affordability resistance.
Forward outlook
- Local home prices are declining (-3.0%/yr); year-one equity from $484 of loan paydown is wiped out by about $2k of value loss. Plan a longer hold.
- Bexar County population projected at +50% by 2050 — long-run rental-demand tailwind backs the buy-and-hold thesis.
- At projected returns (-3.0% appreciation + 0.0% rent growth), your $20k cash investment doubles in ~4 years — after that, you're playing with house money.
Negotiation context
- Only 10 days on market — expect competitive offers; lowballing is unlikely to land.
- 3 sale attempts since 15y ago with the ask held roughly flat each time — persistent listings suggest the price (not the market) is what's stuck; bring a comps-based counter.
Risks & watch-outs
- Watch-outs: built in 1953 — expect roof / HVAC / electrical / plumbing capex.
- Climate carrying-cost: severe wind risk, 80% chance of damaging wind over 30y; extreme-heat days projected 7→22/yr by 2055 (HVAC capex compounding) — expect insurance premiums to compound above CPI over the hold.
Questions for the listing agent
- Built in 1953 — when were the roof, HVAC, electrical panel, plumbing, and water heater last replaced?
- Is there a deadline driving the sale (1031 exchange, divorce, estate, relocation)? That informs how much negotiation room exists.
- Crime grade is F in this area — have there been break-ins, vandalism, or insurance claims at this property in the last 3 years? What carrier currently insures it and at what premium?
- What's the average days-on-market for RENTAL listings here right now (not sales)? A rising rental-DOM trend means longer vacancies and softer asking-rent achievability than the comps imply.
- What's the recent tenant-quality profile in this submarket — average credit score on applications, eviction rate, late-payment / NSF rate, and stable-employment percentage? A property-management company in the area should have these aggregated.
- How much new for-sale + rental construction is in the pipeline within 1–3 miles? Heavy new supply typically softens prices + rents 12–24 months out; constrained supply supports both.
Investment metrics
- 1% rule
- 1.98% ✓
- Cap rate
- 16.81%
- Cash-on-cash
- 37.56%
- DSCR
- 2.67
- GRM
- 4.2
CMA / ARV
- ARV (on-the-fly)
- $150,224
- Comps found
- 12
Show comp detail 12 sales within ~0.75 mi
| Address | Dist | Beds/Ba | Sqft | Sold | Price | $/sf | Match |
|---|---|---|---|---|---|---|---|
| 106 Sublett | 0.09mi | 3/1.0 | 920 (+0%) | 2mo | $175,000 | $190 | 94 |
| 207 Michael | 0.27mi | 3/1.0 | 963 (+5%) | 1mo | $155,000 | $161 | 78 |
| 239 Coral Ave | 0.27mi | 3/1.0 | 974 (+6%) | 2mo | $159,900 | $164 | 75 |
| 343 W Palfrey | 0.41mi | 3/1.0 | 963 (+5%) | 1mo | $165,000 | $171 | 71 |
| 230 Metz | 0.43mi | 2/1.0 (-1) | 912 (-0%) | 8mo | $189,999 | $208 | 68 |
| 3318 Colglazier | 0.54mi | 3/1.0 | 860 (-6%) | 6mo | $159,900 | $186 | 60 |
| 138 Cornish Ave | 0.60mi | 3/1.0 | 946 (+3%) | 8mo | $199,999 | $211 | 60 |
| 315 Colglazier Ave | 0.42mi | 3/1.0 | 1,000 (+9%) | 14mo | $163,000 | $163 | 54 |
| 227 Anton Dr | 0.60mi | 3/1.0 | 1,000 (+9%) | 7mo | $143,250 | $143 | 51 |
| 115 Tipperary | 0.67mi | 3/1.0 | 988 (+8%) | 12mo | $159,900 | $162 | 46 |
| 407 Pickwell | 0.56mi | 3/2.0 | 1,044 (+14%) | 2mo | $119,000 | $114 | 45 |
| 814 Pennystone Ave | 0.73mi | 3/1.0 | 1,026 (+12%) | 13mo | $149,900 | $146 | 35 |
Match score weights: distance 35% · size 25% · config 20% · recency 20%. Top-matched comps best support the ARV.
Projected returns pro-forma
-3.0% appreciation · 0.0% rent growth · sell at horizon
- IRR
- 30.1%
- Equity multiple
- 2.21×
- Total profit
- $23,685
- Equity at exit
- $10,437
- IRR
- 35.6%
- Equity multiple
- 3.82×
- Total profit
- $55,296
- Equity at exit
- $6,052
Cash invested: $19,600 (down + closing). Projections, not guarantees.
Landlord ↔ Tenant lean methodology
- Overall (STATE)
- 87 Strongly Landlord-Friendly
- State Texas
- 87 Strongly Landlord-Friendly · R+5
- County
- — inherits STATE
- City
- — inherits STATE
ZIP-level market 78223
- Home prices YoY
- -16.4%
- Rents YoY
- -3.4%
- Active inventory
- 325
- Price-to-rent
- 4.2×
Monthly cashflow live
- Estimated rent
- $1,389 high interval (Pro) →
- Mortgage (P&I)
- −$367
- Tax est. 1.5%
- −$88 /mo · $1,050/yr
- Insurance
- −$29
- HOA
- −$0
- Vacancy / Maint / Mgmt
- −$292
- Net cashflow
- $614
Break-even live
UW: 25.0% down · 7.5% · 30yr · 1.5% tax · 5.0% vac · 8.0% maint · 8.0% mgmt
Financing live
Cash to close
- Down payment
- $17,500
- Closing costs
- $2,100
- Reserves months
- —
- Total cash needed
- —
Loan-product check · same deal, 3 products live
Conventional
25% down · 7.5% · 30yr
- Down + closing
- —
- Monthly P&I
- —
- Monthly cashflow
- —
- DSCR
- —
- Eligible?
- —
Personal DTI + credit; lowest rate.
DSCR
20% down · 8.5% · 30yr
- Down + closing
- —
- Monthly P&I
- —
- Monthly cashflow
- —
- DSCR
- —
- Eligible?
- —
No personal income docs; deal must DSCR.
Hard money
10% down · 12.0% · 12mo
- Down + closing
- —
- Monthly P&I
- —
- Monthly cashflow
- —
- DSCR
- —
- Eligible?
- —
Short-term bridge; refi at stabilization.
Rent comps 27 comps
| Address | Beds | Baths | Sqft | Rent | $/sqft | DOM | Units | Dist |
|---|---|---|---|---|---|---|---|---|
| 2011 Dollarhide Ave San Antonio, TX | 1.0–2.0 | 1.0 | 730 | $1,150 | $1.58 | 21d | 5 | 0.26mi |
| 4622 Clark Ave San Antonio, TX | 1.0–4.0 | 1.0–2.0 | 859 | $1,380 | $1.61 | 43d | 1 | 0.32mi |
| 326 Sublett Dr San Antonio, TX | 2.0 | 1.0 | 912 | $1,350 | $1.48 | 23d | 1 | 0.34mi |
| 2303 Goliad Rd San Antonio, TX | 1.0–2.0 | 1.0 | 660 | $998 | $1.51 | 1d | 6 | 0.43mi |
| 768 Avondale Ave Unit 202 San Antonio, TX | 3.0 | 1.5 | 1050 | $1,195 | $1.14 | 2d | 1 | 0.64mi |
| 114 Killarney Dr San Antonio, TX | 3.0 | 2.0 | 988 | $1,500 | $1.52 | 14d | 1 | 0.68mi |
| 6410 S New Braunfels Ave San Antonio, TX | 1.0–3.0 | 1.0–2.0 | 1017 | $1,555 | $1.53 | 3d | 21 | 0.69mi |
| 115 Harcourt Ave San Antonio, TX | 3.0 | 1.0 | 912 | $1,500 | $1.64 | 21d | 1 | 0.70mi |
| 462 Utopia Ln Unit W248 San Antonio, TX | 2.0 | 1.0 | 837 | $1,239 | $1.48 | 17d | 1 | 0.70mi |
| 462 Utopia Ln San Antonio, TX | 2.0 | 1.0 | 837 | $1,215 | $1.45 | 43d | 1 | 0.73mi |
| 4700 Stringfellow Dr San Antonio, TX | 2.0 | 1.0–2.0 | 904 | $922 | $1.02 | 1d | 3 | 0.85mi |
| 6222 S New Braunfels Ave San Antonio, TX | 1.0–4.0 | 1.0–2.0 | 1258 | $1,359 | $1.08 | 10d | 12 | 0.97mi |
| 311 Glamis Ave Unit 2 San Antonio, TX | 3.0 | 1.0 | 900 | $1,395 | $1.55 | 43d | 1 | 0.98mi |
| 311 Glamis Ave San Antonio, TX | 3.0 | 1.0 | 1100 | $1,295 | $1.18 | 4d | 1 | 0.98mi |
| 7310 S New Braunfels Ave Unit 710 San Antonio, TX | 2.0 | 2.0 | 871 | $1,132 | $1.30 | 2d | 1 | 1.01mi |
| 611 Kashmuir Pl San Antonio, TX | 3.0 | 1.0 | 1008 | $1,800 | $1.79 | 43d | 1 | 1.01mi |
| 2566 Goliad Rd San Antonio, TX | 1.0–2.0 | 1.0 | 600 | $1,300 | $2.17 | 23d | 23 | 1.02mi |
| 2566 Goliad Rd San Antonio, TX | 2.0 | 1.0 | 600 | $1,350 | $2.25 | 4d | 20 | 1.02mi |
| 3435 E Southcross Blvd San Antonio, TX | 1.0–2.0 | 1.0–2.0 | 867 | $1,254 | $1.45 | 43d | 1 | 1.02mi |
| 317 Kashmuir Pl Unit 3 San Antonio, TX | 2.0 | 1.0 | 732 | $1,197 | $1.64 | 16d | 1 | 1.04mi |
| 3007 SE Military Dr Unit 710 San Antonio, TX | 2.0 | 2.0 | 1010 | $855 | $0.85 | 2d | 1 | 1.08mi |
| 7035 Pickwell Dr San Antonio, TX | 1.0–3.0 | 1.0–2.0 | 953 | $1,769 | $1.86 | 2d | 32 | 1.26mi |
| 3602 Bremen St San Antonio, TX | 4.0 | 2.0 | 1092 | $1,595 | $1.46 | 23d | 1 | 1.31mi |
| 7910 S New Braunfels Ave San Antonio, TX | 1.0–3.0 | 1.0–2.0 | 1187 | $2,640 | $2.22 | 1d | 48 | 1.47mi |
| 204 E Dullnig Ct Unit 20 San Antonio, TX | 2.0 | 1.0 | 750 | $950 | $1.27 | 21d | 1 | 1.47mi |
| 7803 S New Braunfels Ave Unit 710 Brooks City Base, TX | 2.0 | 2.0 | 821 | $1,227 | $1.49 | 2d | 1 | 1.47mi |
| 7714 Kennedy Hl San Antonio, TX | 1.0–2.0 | 1.0–2.0 | 1047 | $1,956 | $1.87 | 1d | 27 | 1.49mi |
Listing history 7 events
-
2026-06-13statusdays on market $70,000 Pending 10 DOM
-
2026-06-09days on market $70,000 New 7 DOM
-
2026-06-08days on market $70,000 New 6 DOM
-
2026-06-07days on market $70,000 New 5 DOM
-
2026-06-04days on market $70,000 New 2 DOM
-
2026-06-03remarks 122-char remark
-
2026-06-03$70,000 New 1 DOM
ⓘ Source: listings_history table (triggers on properties + properties_extension) + one-shot
backfill from property_details.listing_events for pre-trigger history.
Climate risk First Street
- Flood 1/10 Low FEMA zone X (unshaded) · 0% chance over 30 yrs
- Wildfire 3/10 Moderate
- Heat 8/10 Severe 7 d/yr ≥108°F today · 22 d/yr by 30 yrs out
- Wind 8/10 Severe 80% chance of damaging wind over 30 yrs
- Air quality 2/10 Low 0 unhealthy d/yr today · 2 by 30 yrs out
Nearby sold comps map
Loading sold comps map…
Walkable amenities ~0.75 mi
Loading nearby amenities…
Taxation est. · year 1
- Rental income
- $16,668
- − Mortgage interest
- −$3,921
- − Property taxes
- −$1,050
- − Insurance
- −$350
- − Repairs & maintenance
- −$1,333
- − Management
- −$1,333
- − Depreciation
- −$2,036
- Taxable income
- $6,644
- Est. tax owed @ 24.0%
- −$1,594
- After-tax cash flow
- $5,768/yr
For passive investors: Depreciation is non-cash, so a rental often shows a tax loss while cash-flowing — sheltering income. Rental losses are passive: they offset passive income freely, and up to $25,000/yr can offset ordinary (W-2) income if you actively participate and your MAGI is under $100k (phasing out to $0 by $150k); unused losses carry forward. On sale, claimed depreciation is recaptured at up to 25%, and gains may owe capital-gains tax (a 1031 exchange can defer both). Figures are a year-1 estimate at your 24.0% rate — not tax advice; consult a CPA.
Schools (NCES district)
- District
- San Antonio ISD
- NCES district ID
- 4838730
- Math proficiency
- 12% ▼ -21.00%
- Reading proficiency
- 22% ▼ -7.00%
- Median HH income
- $30,952
- Composite
- 13.57/100
- National rank
- #9512
- State rank
- #805 of 826 in TX
Livability — San Antonio
- Score
- 80/100
- State rank
- #31
- US rank
- #1616
Category grades
Schools grade is shown separately in the Schools card above.
Census & demographics
- Census place
- San Antonio, TX
- County
- Bexar County · 1,990,555 people
- City population
- 1,806,925
- Metro
- San Antonio-New Braunfels, TX
- Population (ZIP)
- 58,983
- Household income
- $52,088
- Rent vs Own
- Severe rent burden
- 2809.0
Population outlook (Bexar County) Hauer SSP2
- Today (2025)
- 2,336,851 people
- By 2030
- 2,560,728 · +9.6%
- By 2040
- 3,020,569 · +29.3%
- By 2050
- 3,493,522 · +49.5%
- By 2075
- 4,668,459 · +99.8%
- By 2100
- 5,533,242 · +136.8%
Race, ethnicity, and origin ACS 2023
- Neighborhood character
- Predominantly Hispanic (76%)
- Race & ethnicity
- Hispanic / Latino 76% Two or more races 28% White 16% Black 5% Asian 2% Native American 1%
- Hispanic origin (detail)
- Mexican 67%
- Common ancestry
- Lithuanian 2% Romanian 1% Slovak 1%
- Foreign-born
- 10% · Canada, Vietnam
- Languages at home
- 63% English-only · Spanish 36%
Political lean MEDSL · Bexar
- 2024 margin
- Lean D (+9.8) · D 54.3% · R 44.6% · Other 1.1%
- 2008→2024 swing
- +4.2pp toward D · 2008: 5.6pp · 2024: 9.8pp
- All cycles
- 2024: D+9.8 2020: D+18.2 2016: D+13.5 2012: D+4.6 2008: D+5.6
Not yet ingested
- Civics
- —
Market trends
- HPI YoY
- ▼ -52.06%
- Current HPI
- 265.2235
- Rent YoY
- ▼ -3.36%
- Metro
- San Antonio-New Braunfels, TX
- State GDP YoY
- ▲ 3.95%
- F500 in state
- 110
Industry mix (Fortune 500 HQ in TX)
| Industry | F500 HQs | Revenue |
|---|---|---|
| Energy | 16 | $1,198B |
|
||
| Technology | 5 | $198B |
|
||
| Engineering / Construction | 4 | $72B |
|
||
| Energy Services | 3 | $60B |
|
||
| Utilities | 3 | $41B |
|
||
| Healthcare | 2 | $330B |
|
||
Price history
+12.9% since first listed12 events — show timeline
- 2026-06-02 Listed $70,000 LERA
- 2022-11-15 Listing Removed — LERA
- 2022-11-13 Pending — LERA
- 2022-11-10 Sold (Public Records) — Public Records
- 2022-11-09 Sold (MLS) — LERA
- 2022-10-07 Contingent — LERA
- 2022-09-25 Listed $135,000 LERA
- 2011-08-26 Sold (MLS) — LERA
- 2011-08-25 Sold (Public Records) — Public Records
- 2011-07-14 Listing Removed — LERA
- 2011-05-10 Listed $62,000 LERA
- 2002-12-09 Sold (Public Records) — Public Records
Property tax history
+7.6%/yrLatest (2025): $3,506 · -2.0% YoY. Source: county tax records.
Cash-flow waterfall
monthlySold comps — $/sqft
last 12 mo · ≤1 miLoading sold comps…