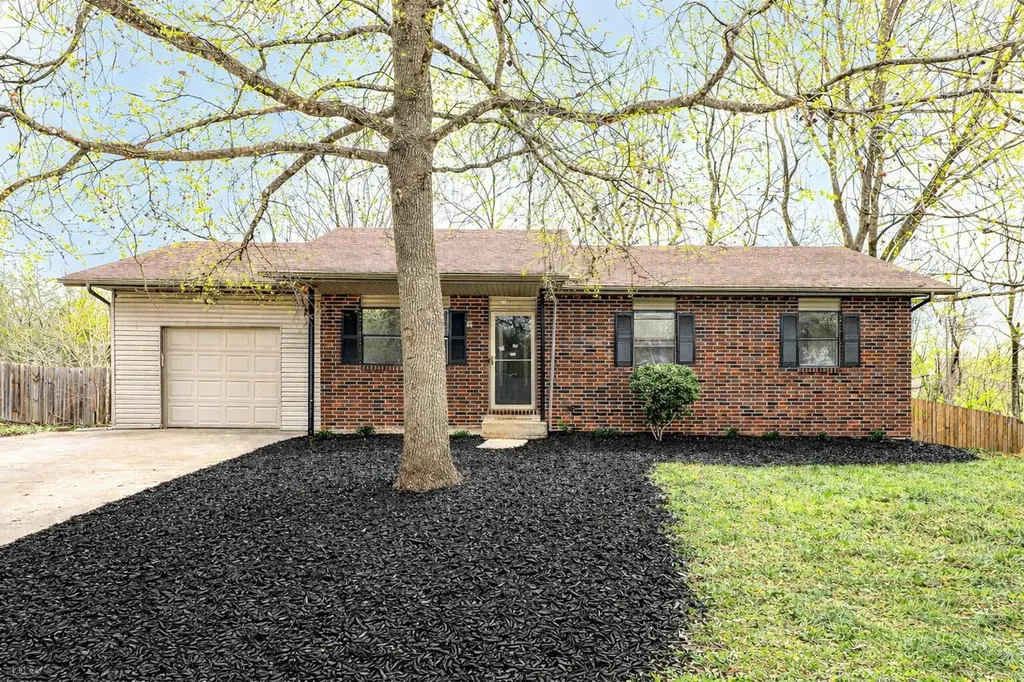
110 S Basswood Ave · Republic, MO
Flood risk 4/10 · Minor
- FEMA flood zone
- X (unshaded)
- Chance of flooding over 30 yrs
- 0.22%
- Est. flood insurance / yr
- $473 – $860
Fire risk 4/10 · Minor
- Est. fire insurance / yr
- $1,054 – $1,958
Heat risk 5/10 · Moderate
- Hot days now (above 105°F)
- 7 days/yr
- Hot days in 30 yrs
- 19 days/yr
Wind risk 2/10 · Minimal
- Chance of severe wind over 30 yrs
- 0.0%
Air-quality risk 1/10 · Minimal
- Unhealthy air days now
- 0 days/yr
- Unhealthy air days in 30 yrs
- 0 days/yr
Risk factors via First Street. Map © Google.
Why this score? — see what drove the C- grade
The composite is a weighted blend of 9 inputs, each scored 0–100. Each bar is that input's sub-score; the figure is the points it added to the 100-point composite (weight × sub-score).
- Cash flow +16.0/30.0
- ARV discount +15.0/15.0
- DSCR +4.9/10.0
- Schools +4.8/10.0
- Livability +3.6/5.0
- 1% rule +3.5/10.0
- Rent growth +3.4/5.0
- Condition / age +2.5/5.0
- Appreciation +0.0/10.0
$235,000
🖨 Deal sheet 📄 Offer letter ✓ Due diligence
Listing remarks
BRAND NEW ROOF COMING - STILL TIME TO CHOOSE SHINGLE COLOR! Fully remodeled walkout basement home offering stylish updates and flexible living space with HUGE oversized lot! This charming property features fresh interior finishes throughout, including modern flooring, updated lighting, and a sleek kitchen with black cabinetry, subway tile backsplash, and warm wood countertops. The spacious walkout basement provides additional living or entertaining space, complete with a beautifully updated bathroom--perfect for guests, a second living area, or home office setup. Enjoy great curb appeal with classic brick, mature trees, and fresh landscaping. The large backyard offers privacy and room to re
Key facts
- Walkout basement
- Black cabinetry
- Oversized lot
Tags
Property features AI
Exterior
- Parking: Detached garage facing front with 1 garage space
- Utilities: Public water; Public sewer
- Home design: Single-family residence; One story
- Construction: Vinyl siding; Brick/mortar foundation; Built with composition roof
- Exterior features: Partial privacy fencing; Composition roof; Public-maintained asphalt road frontage on a city street; Has a view
Interior
- Kitchen: Electric oven; Free-standing electric oven; Dishwasher; Disposal
- Bedrooms: Main level laundry (bedroom levels not specified)
- Flooring: Vinyl flooring
- Bathrooms: 2 full bathrooms
- Heating & cooling: Central heating (electric); Central air conditioning
- Interior features: Electric oven; Free-standing electric oven; Dishwasher; Disposal; Finished full basement with walk-out access
- Laundry & utility: Laundry on main level
Neighborhood map
What this means for you Summary
Snapshot
- This is a 3-bed/1.0-bath single-family listed at $235k.
Deal economics
- At list price, monthly cash flow is $114 ($1k/yr) — positive.
- The deal already cash-flows at list — no discount required.
- To meet the 1% rule (rent ≥ 1% of price), the offer needs to be $200k (15.0% below list).
- Recommended offer: $200k (15.0% below list) — sets the bar for 1% rule.
- Cap rate 6.9% vs local median 4.0% in Republic — top-decile yield for the area; either an underpriced asset or a hidden risk that comps aren't pricing in. Stress-test before assuming the spread holds.
Location & tenants
- Location reads 72/100 on livability (#92 in MO) — a middle-class / working-renter tenant base. Strengths: cost of living A+, housing A+, crime A; Watch: amenities F, commute F, health & safety F.
- Republic R-III (suburban): math 56% / reading 57% proficiency, ranked #19 of 324 in MO (top 6%) — acceptable for families but not a draw, mixed tenant base, ~2y average lease.
- Zoned schools: Republic Middle (math 50% / reading 53%, grade C, #57 of 391 statewide, top 15%, 1,146 students, 39% FRL); Republic High (math 56% / reading 60%, grade C, #48 of 521 statewide, top 9%, 1,542 students, 31% FRL) — zoned schools at 35% FRL track the district average.
- Market conditions: Rents rising (+3.6%/yr); 478 active listings in the ZIP; 13 comparable units currently listed for rent nearby; rentals lingering (median 44d on market — plan ~5-8 weeks vacancy on turnover, expect pricing pressure); 69% of comp listings sitting > 30 days — soft ceiling on asking rent; 1,302 units permitted in Greene County in 2024 (250 in 5+ unit buildings).
- This rent runs 35% of the median local income ($68k/yr) — at the standard rent-burdened threshold; future hikes will face affordability resistance.
Forward outlook
- Local home prices are declining (-3.0%/yr); year-one equity from $2k of loan paydown is wiped out by about $7k of value loss. Plan a longer hold.
- Greene County population projected at +25% by 2050 — long-run rental-demand tailwind backs the buy-and-hold thesis.
Negotiation context
- Only 4 days on market — expect competitive offers; lowballing is unlikely to land.
- 3 sale attempts since 18y ago with the ask held roughly flat each time — persistent listings suggest the price (not the market) is what's stuck; bring a comps-based counter.
Risks & watch-outs
- Climate carrying-cost: extreme-heat days projected 7→19/yr by 2055 (HVAC capex compounding) — expect insurance premiums to compound above CPI over the hold.
Questions for the listing agent
- Is there a deadline driving the sale (1031 exchange, divorce, estate, relocation)? That informs how much negotiation room exists.
- Schools are B-rated — typically a magnet for longer-tenancy family renters. What's the average tenant stay here, and is there a school-zone premium baked into asking?
- What's the average days-on-market for RENTAL listings here right now (not sales)? A rising rental-DOM trend means longer vacancies and softer asking-rent achievability than the comps imply.
- What's the recent tenant-quality profile in this submarket — average credit score on applications, eviction rate, late-payment / NSF rate, and stable-employment percentage? A property-management company in the area should have these aggregated.
- How much new for-sale + rental construction is in the pipeline within 1–3 miles? Heavy new supply typically softens prices + rents 12–24 months out; constrained supply supports both.
Investment metrics
- 1% rule
- 0.85% ✗
- Cap rate
- 6.88%
- Cash-on-cash
- 2.08%
- DSCR
- 1.09
- GRM
- 9.8
CMA / ARV
- ARV (median comp)
- $333,165
- List price
- $235,000
- Delta
- -29.46%
- Verdict
- UNDERPRICED
- Comps
- 20 within 1.0 mi
Show comp detail 12 sales within ~0.75 mi
| Address | Dist | Beds/Ba | Sqft | Sold | Price | $/sf | Match |
|---|---|---|---|---|---|---|---|
| 110 S Basswood Ave | 0.00mi | 4/2.0 (+1) | 2,080 (+11%) | 0mo | $235,000 | $113 | 72 |
| 2433 E Virginia St | 0.23mi | 3/2.0 | 2,021 (+8%) | 3mo | $335,000 | $166 | 69 |
| 406 S Chestnut Hills Dr | 0.43mi | 4/2.0 (+1) | 1,836 (-2%) | 2mo | $327,500 | $178 | 66 |
| 2236 E Lee St | 0.35mi | 3/2.5 | 1,716 (-8%) | 2mo | $270,000 | $157 | 62 |
| 1731 E Timber Ln | 0.45mi | 3/2.0 | 1,696 (-9%) | 1mo | $319,900 | $189 | 59 |
| 2201 E Kathryn Dr | 0.12mi | 3/2.0 | 1,599 (-15%) | 10mo | $270,000 | $169 | 58 |
| 1746 E Timber Ln | 0.45mi | 3/2.0 | 1,660 (-11%) | 4mo | $300,000 | $181 | 52 |
| 603 S Foxridge Ave | 0.47mi | 4/2.0 (+1) | 2,100 (+12%) | 2mo | $455,000 | $217 | 47 |
| 2187 E Will St | 0.45mi | 4/2.0 (+1) | 2,100 (+12%) | 6mo | $445,000 | $212 | 45 |
| 538 N Basswood Ave | 0.53mi | 3/2.0 | 1,619 (-14%) | 6mo | $254,900 | $157 | 43 |
| 1448 E Lee St | 0.62mi | 3/2.0 | 1,611 (-14%) | 5mo | $262,000 | $163 | 40 |
| 1228 E Ritter St | 0.71mi | 3/2.0 | 1,631 (-13%) | 5mo | $329,900 | $202 | 37 |
Match score weights: distance 35% · size 25% · config 20% · recency 20%. Top-matched comps best support the ARV.
Projected returns pro-forma
-3.0% appreciation · 3.61% rent growth · sell at horizon
- IRR
- -12.4%
- Equity multiple
- 0.55×
- Total profit
- $-29,639
- Equity at exit
- $35,039
- IRR
- -2.6%
- Equity multiple
- 0.82×
- Total profit
- $-11,592
- Equity at exit
- $20,319
Cash invested: $65,800 (down + closing). Projections, not guarantees.
Landlord ↔ Tenant lean methodology
- Overall (STATE)
- 81 Strongly Landlord-Friendly
- State Missouri
- 81 Strongly Landlord-Friendly · R+10
- County
- — inherits STATE
- City
- — inherits STATE
ZIP-level market 65738
- Home prices YoY
- -32.2%
- Rents YoY
- 3.6%
- Active inventory
- 478
- Price-to-rent
- 9.8×
Monthly cashflow live
- Estimated rent
- $1,998 high interval (Pro) →
- Mortgage (P&I)
- −$1,232
- Tax from tax record
- −$134 /mo · $1,607/yr
- Insurance
- −$98
- HOA
- −$0
- Vacancy / Maint / Mgmt
- −$420
- Net cashflow
- $114
Break-even live
UW: 25.0% down · 7.5% · 30yr · 1.5% tax · 5.0% vac · 8.0% maint · 8.0% mgmt
Financing live
Cash to close
- Down payment
- $58,750
- Closing costs
- $7,050
- Reserves months
- —
- Total cash needed
- —
Loan-product check · same deal, 3 products live
Conventional
25% down · 7.5% · 30yr
- Down + closing
- —
- Monthly P&I
- —
- Monthly cashflow
- —
- DSCR
- —
- Eligible?
- —
Personal DTI + credit; lowest rate.
DSCR
20% down · 8.5% · 30yr
- Down + closing
- —
- Monthly P&I
- —
- Monthly cashflow
- —
- DSCR
- —
- Eligible?
- —
No personal income docs; deal must DSCR.
Hard money
10% down · 12.0% · 12mo
- Down + closing
- —
- Monthly P&I
- —
- Monthly cashflow
- —
- DSCR
- —
- Eligible?
- —
Short-term bridge; refi at stabilization.
Rent comps 13 comps
| Address | Beds | Baths | Sqft | Rent | $/sqft | DOM | Units | Dist |
|---|---|---|---|---|---|---|---|---|
| 625 Turner Ave Republic, MO | 2.0–3.0 | 2.5 | 1609 | $1,895 | $1.18 | 13d | 6 | 0.64mi |
| 644 N Cox Ave Republic, MO | 3.0 | 2.0 | 1375 | $1,595 | $1.16 | 43d | 1 | 0.64mi |
| 1740 E Hamilton St Republic, MO | 1.0–3.0 | 1.0–2.0 | 1110 | $1,395 | $1.26 | 43d | 7 | 0.82mi |
| 810 N Oakwood Ave Republic, MO | 2.0–3.0 | 2.0 | 1239 | $924 | $0.75 | 13d | 4 | 0.83mi |
| 923 N Blake AVE Republic, MO | 2.0 | 2.0 | 1400 | $2,300 | $1.64 | 43d | 1 | 0.88mi |
| 922 N Blake Ave Republic, MO | 2.0 | 2.0 | 1400 | $2,300 | $1.64 | 43d | 1 | 0.89mi |
| 929 N Blake Ave Republic, MO | 2.0 | 2.0 | 1400 | $2,300 | $1.64 | 43d | 1 | 0.90mi |
| 928 N Blake Ave Republic, MO | 2.0 | 2.0 | 1400 | $2,300 | $1.64 | 43d | 1 | 0.90mi |
| 937 N Blake Ave Republic, MO | 2.0 | 2.0 | 1400 | $2,300 | $1.64 | 43d | 1 | 0.90mi |
| 2488 Timber Oak St Republic, MO | 4.0 | 2.0 | 1550 | $1,895 | $1.22 | 43d | 1 | 0.94mi |
| 1031 N Blake Ave Republic, MO | 2.0 | 2.0 | 1400 | $2,300 | $1.64 | 43d | 1 | 1.00mi |
| 1090 N Northwood Ave Republic, MO | 3.0 | 2.0 | 1321 | $1,200 | $0.91 | 13d | 1 | 1.11mi |
| 1450 S Olde Savannah Ave Republic, MO | 4.0 | 2.0 | 1539 | $2,400 | $1.56 | 13d | 1 | 1.27mi |
Listing history 9 events
-
2026-05-03status Pending 827-char remark
-
2026-04-29$235,000 Active 827-char remark
-
2026-04-16status Pending
-
2026-04-02$235,000 Active
-
2026-01-13soldstatus
-
2008-09-02soldstatus
-
2008-04-28$114,900
-
2006-01-31soldstatus
-
2003-09-15soldstatus
ⓘ Source: listings_history table (triggers on properties + properties_extension) + one-shot
backfill from property_details.listing_events for pre-trigger history.
Tax reassessment forecast MO · Resets to sale price
- Current annual tax
- $1,607 · $134/mo
- Projected year-2 tax
- $2,280 · $190/mo
- Expected delta
- +$673/yr (+$56/mo · 41.9%)
ⓘ Screening estimate from a state-policy table — verify with the county assessor before closing.
Climate risk First Street
- Flood 4/10 Moderate FEMA zone X (unshaded) · 22% chance over 30 yrs
- Wildfire 4/10 Moderate
- Heat 5/10 Major 7 d/yr ≥105°F today · 19 d/yr by 30 yrs out
- Wind 2/10 Low 0% chance of damaging wind over 30 yrs
- Air quality 1/10 Low 0 unhealthy d/yr today · 0 by 30 yrs out
Nearby sold comps map
Loading sold comps map…
Walkable amenities ~0.75 mi
Loading nearby amenities…
Taxation est. · year 1
- Rental income
- $23,976
- − Mortgage interest
- −$13,164
- − Property taxes
- −$1,607
- − Insurance
- −$1,175
- − Repairs & maintenance
- −$1,918
- − Management
- −$1,918
- − Depreciation
- −$6,836
- Taxable loss
- −$2,642
- Est. tax savings @ 24.0%
- +$634
- After-tax cash flow
- $2,005/yr
For passive investors: Depreciation is non-cash, so a rental often shows a tax loss while cash-flowing — sheltering income. Rental losses are passive: they offset passive income freely, and up to $25,000/yr can offset ordinary (W-2) income if you actively participate and your MAGI is under $100k (phasing out to $0 by $150k); unused losses carry forward. On sale, claimed depreciation is recaptured at up to 25%, and gains may owe capital-gains tax (a 1031 exchange can defer both). Figures are a year-1 estimate at your 24.0% rate — not tax advice; consult a CPA.
Schools (NCES district)
- District
- Republic R-III
- NCES district ID
- 2926220
- Math proficiency
- 56% ▲ 2.00%
- Reading proficiency
- 57% ▼ -1.00%
- Median HH income
- $51,329
- Composite
- 48.3/100
- National rank
- #2152
- State rank
- #19 of 324 in MO
Livability — Republic
- Score
- 72/100
- State rank
- #92
- US rank
- #6228
Category grades
Schools grade is shown separately in the Schools card above.
Census & demographics
- Census place
- Republic, MO
- County
- Greene County · 244,327 people
- City population
- 21,283
- Metro
- Springfield, MO
- Population (ZIP)
- 21,283
- Household income
- $67,841
- Rent vs Own
- Severe rent burden
- 461.0
Population outlook (Greene County) Hauer SSP2
- Today (2025)
- 319,054 people
- By 2030
- 335,135 · +5.0%
- By 2040
- 366,186 · +14.8%
- By 2050
- 397,431 · +24.6%
- By 2075
- 477,035 · +49.5%
- By 2100
- 520,828 · +63.2%
Race, ethnicity, and origin ACS 2023
- Neighborhood character
- Predominantly White (91%)
- Race & ethnicity
- White 91% Two or more races 4% Hispanic / Latino 3% Black 1%
- Common ancestry
- Italian 2% Lithuanian 2% Portuguese 2%
- Foreign-born
- 1% · Canada, China
- Languages at home
- 98% English-only · Spanish 1%
Political lean MEDSL · Greene
- 2024 margin
- Strong R (+20.8) · D 38.9% · R 59.7% · Other 1.4%
- 2008→2024 swing
- -5.0pp toward R · 2008: -15.8pp · 2024: -20.8pp
- All cycles
- 2024: R+20.8 2020: R+20.1 2016: R+27.4 2012: R+24.4 2008: R+15.8
Not yet ingested
- Civics
- —
Market trends
- HPI YoY
- ▼ -102.93%
- Current HPI
- 217.1512
- Rent YoY
- ▲ 3.61%
- Metro
- Springfield, MO
- State GDP YoY
- ▲ 1.84%
- F500 in state
- 20
Industry mix (Fortune 500 HQ in MO)
| Industry | F500 HQs | Revenue |
|---|---|---|
| Healthcare | 1 | $163B |
|
||
| Insurance | 1 | $21B |
|
||
| Industrial Technology | 1 | $17B |
|
||
| Retail | 1 | $16B |
|
||
| Industrial Distribution | 1 | $10B |
|
||
| Utilities | 1 | $9B |
|
||
Price history
+104.5% since first listed11 events — show timeline
- 2026-06-05 Sold (Public Records) — Public Records
- 2026-06-04 Sold (MLS) — SOMO
- 2026-05-03 Pending — SOMO
- 2026-04-29 Listed $235,000 SOMO
- 2026-04-16 Pending — SOMO
- 2026-04-02 Listed $235,000 SOMO
- 2026-01-13 Sold (Public Records) — Public Records
- 2008-09-02 Sold (Public Records) — Public Records
- 2008-04-28 Listed $114,900 SOMO
- 2006-01-31 Sold (Public Records) — Public Records
- 2003-09-15 Sold (Public Records) — Public Records
Property tax history
+6.4%/yrLatest (2025): $1,607 · +6.7% YoY. Source: county tax records.
Cash-flow waterfall
monthlySold comps — $/sqft
last 12 mo · ≤1 miLoading sold comps…