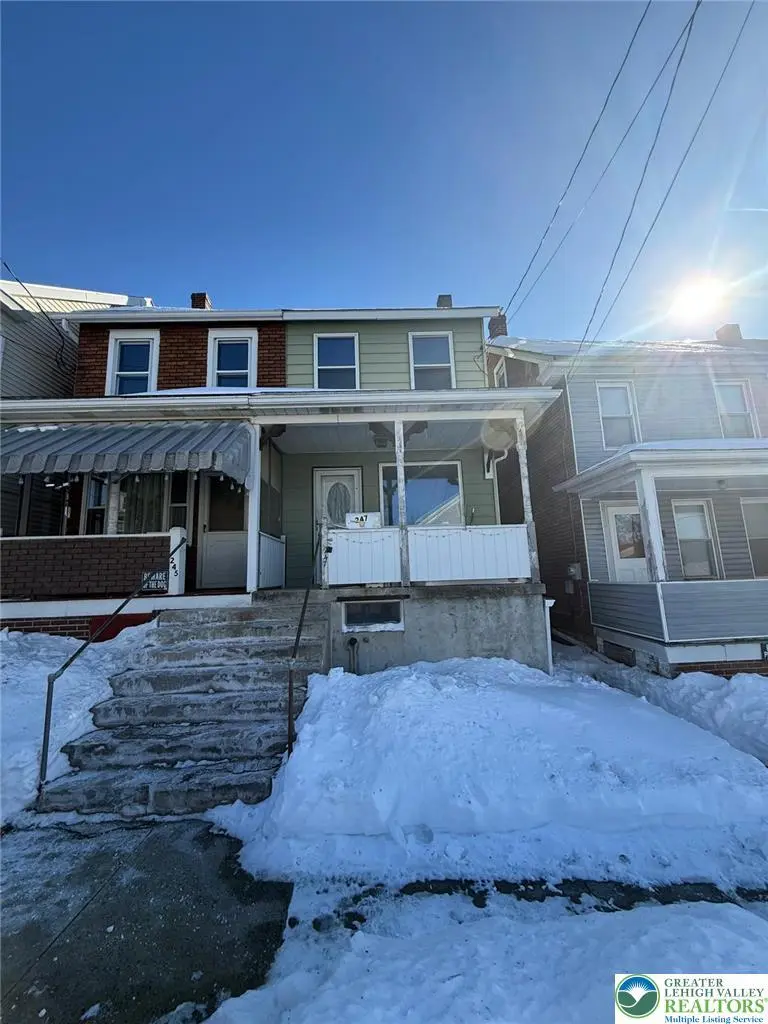
247 W Hazard St · Summit Hill, PA
Flood risk 1/10 · Minimal
- FEMA flood zone
- X (unshaded)
- Chance of flooding over 30 yrs
- 0.0%
- Est. flood insurance / yr
- $507 – $1,088
Fire risk 4/10 · Minor
- Est. fire insurance / yr
- $511 – $949
Heat risk 3/10 · Minor
- Hot days now (above 94°F)
- 7 days/yr
- Hot days in 30 yrs
- 15 days/yr
Wind risk 4/10 · Minor
- Chance of severe wind over 30 yrs
- 8.0%
Air-quality risk 2/10 · Minimal
- Unhealthy air days now
- 1 days/yr
- Unhealthy air days in 30 yrs
- 3 days/yr
Risk factors via First Street. Map © Google.
Why this score? — see what drove the B grade
The composite is a weighted blend of 9 inputs, each scored 0–100. Each bar is that input's sub-score; the figure is the points it added to the 100-point composite (weight × sub-score).
- Cash flow +28.6/30.0
- ARV discount +13.5/15.0
- DSCR +10.0/10.0
- 1% rule +8.9/10.0
- Livability +3.4/5.0
- Rent growth +2.5/5.0
- Condition / age +2.5/5.0
- Schools +2.0/10.0
- Appreciation +0.0/10.0
$79,900
🖨 Deal sheet 📄 Offer letter ✓ Due diligence
Listing remarks MLS
Located in the borough of Summit Hill, this 2-bedroom, 1½-bath home offers a great opportunity for buyers looking to add their personal touch. The property has been cleaned and is livable, while still offering room for updates and improvements. As you enter the home, you’ll find a spacious living room that leads into the main living areas, providing a functional layout for everyday living. The kitchen offers practical space with potential for future upgrades. Upstairs, the two bedrooms provide comfortable living space with natural light. There is also an attic that offers additional space and potential for a variety of uses, such as storage, a home office, or possibly an additional bedroom. A basement provides extra storage and utility space. Conveniently located near local shops, schools, and major routes, this property presents a great opportunity for homeowners or investors looking for a property with potential in a convenient location.
Key facts
- Built 1906
- Listed 95 days
Neighborhood map
What this means for you Summary
Snapshot
- This is a 3-bed/1.5-bath townhouse listed at $80k.
Deal economics
- At list price, monthly cash flow is $263 ($3k/yr) — positive.
- The deal already cash-flows at list — no discount required.
- Meets the 1% rule at list price ($1k rent vs $80k).
- Recommended offer: $73k (9.0% below list) — sets the bar for market timing.
Location & tenants
- Location reads 67/100 on livability (#953 in PA) — a middle-class / working-renter tenant base. Strengths: crime A+, cost of living A+; Watch: employment C-, schools D, amenities F.
- Panther Valley SD (rural): math 14% / reading 35% proficiency, ranked #477 of 539 in PA (top 88%) — low school quality limits family demand, transient renter base, plan for 1-2y turnover.
- Market conditions: 12 active listings in the ZIP; 13 comparable units currently listed for rent nearby; rentals at typical pace (median 14d on market — plan ~3-4 weeks tenant-placement turnaround); 180 units permitted in Carbon County in 2024 (10 in 5+ unit buildings).
Forward outlook
- Local home prices are declining (-3.0%/yr); year-one equity from $552 of loan paydown is wiped out by about $2k of value loss. Plan a longer hold.
- Carbon County population projected at -18% by 2050 — secular population decline; favor cash flow + early exit over multi-decade hold.
- At projected returns (-3.0% appreciation + 3.0% rent growth), your $22k cash investment doubles in ~9 years — after that, you're playing with house money.
Negotiation context
- It's been on market 95 days — a 9% lower offer ($73k) is reasonable based on typical stale-listing flexibility.
Risks & watch-outs
- Watch-outs: built in 1906 — expect roof / HVAC / electrical / plumbing capex.
Questions for the listing agent
- It's been on market 95 days. Have you received any prior offers? Is the seller open to a 9% concession, seller financing, or rate buy-down credit?
- Built in 1906 — when were the roof, HVAC, electrical panel, plumbing, and water heater last replaced?
- Why hasn't it sold? Are there any deal-killer items the seller is aware of (foundation, flood, title, zoning, code violations)?
- Is there a deadline driving the sale (1031 exchange, divorce, estate, relocation)? That informs how much negotiation room exists.
- Schools are D-rated, which usually means shorter tenancies and higher turnover. Who's the typical renter profile here, and what's been the actual vacancy rate?
- What's the average days-on-market for RENTAL listings here right now (not sales)? A rising rental-DOM trend means longer vacancies and softer asking-rent achievability than the comps imply.
- What's the recent tenant-quality profile in this submarket — average credit score on applications, eviction rate, late-payment / NSF rate, and stable-employment percentage? A property-management company in the area should have these aggregated.
- How much new for-sale + rental construction is in the pipeline within 1–3 miles? Heavy new supply typically softens prices + rents 12–24 months out; constrained supply supports both.
Investment metrics
- 1% rule
- 1.39% ✓
- Cap rate
- 10.24%
- Cash-on-cash
- 14.09%
- DSCR
- 1.63
- GRM
- 6.0
CMA / ARV
- ARV (median comp)
- $92,190
- List price
- $79,900
- Delta
- -13.33%
- Verdict
- UNDERPRICED
- Comps
- 20 within 1.0 mi
Show comp detail 9 sales within ~0.75 mi
| Address | Dist | Beds/Ba | Sqft | Sold | Price | $/sf | Match |
|---|---|---|---|---|---|---|---|
| 448 E Kline Ave | 0.47mi | 2/1.0 (-1) | 862 (-4%) | 9mo | $57,000 | $66 | 57 |
| 312 E Abbott St | 0.39mi | 3/1.0 | 1,020 (+13%) | 5mo | $72,500 | $71 | 54 |
| 16 E Kline Ave | 0.48mi | 2/2.0 (-1) | 941 (+5%) | 12mo | $80,000 | $85 | 53 |
| 26 E Abbott St | 0.44mi | 3/1.0 | 985 (+9%) | 14mo | $62,000 | $63 | 50 |
| 14 Bertsch St W | 0.54mi | 4/1.0 (+1) | 912 (+1%) | 22mo | $95,700 | $105 | 47 |
| 226 E Snyder Ave | 0.57mi | 2/1.0 (-1) | 836 (-7%) | 10mo | $56,000 | $67 | 46 |
| 19 Walnut St | 0.58mi | 2/1.0 (-1) | 1,000 (+11%) | 8mo | $52,600 | $53 | 41 |
| 12 Bertsch St W | 0.54mi | 3/1.0 | 1,003 (+11%) | 20mo | $60,000 | $60 | 37 |
| 11 E Bertsch St | 0.56mi | 3/1.0 | 986 (+10%) | 24mo | $51,500 | $52 | 36 |
Match score weights: distance 35% · size 25% · config 20% · recency 20%. Top-matched comps best support the ARV.
Projected returns pro-forma
-3.0% appreciation · 3.0% rent growth · sell at horizon
- IRR
- 4.4%
- Equity multiple
- 1.17×
- Total profit
- $3,840
- Equity at exit
- $11,913
- IRR
- 14.0%
- Equity multiple
- 2.12×
- Total profit
- $25,118
- Equity at exit
- $6,908
Cash invested: $22,372 (down + closing). Projections, not guarantees.
Landlord ↔ Tenant lean methodology
- Overall (STATE)
- 62 Landlord-Friendly
- State Pennsylvania
- 62 Landlord-Friendly · EVEN
- County
- — inherits STATE
- City
- — inherits STATE
ZIP-level market 18250
- Home prices YoY
- -7.1%
- Active inventory
- 12
- Price-to-rent
- 6.0×
Monthly cashflow live
- Estimated rent
- $1,114 high interval (Pro) →
- Mortgage (P&I)
- −$419
- Tax from tax record
- −$165 /mo · $1,980/yr
- Insurance
- −$33
- HOA
- −$0
- Vacancy / Maint / Mgmt
- −$234
- Net cashflow
- $263
Break-even live
UW: 25.0% down · 7.5% · 30yr · 1.5% tax · 5.0% vac · 8.0% maint · 8.0% mgmt
Financing live
Cash to close
- Down payment
- $19,975
- Closing costs
- $2,397
- Reserves months
- —
- Total cash needed
- —
Loan-product check · same deal, 3 products live
Conventional
25% down · 7.5% · 30yr
- Down + closing
- —
- Monthly P&I
- —
- Monthly cashflow
- —
- DSCR
- —
- Eligible?
- —
Personal DTI + credit; lowest rate.
DSCR
20% down · 8.5% · 30yr
- Down + closing
- —
- Monthly P&I
- —
- Monthly cashflow
- —
- DSCR
- —
- Eligible?
- —
No personal income docs; deal must DSCR.
Hard money
10% down · 12.0% · 12mo
- Down + closing
- —
- Monthly P&I
- —
- Monthly cashflow
- —
- DSCR
- —
- Eligible?
- —
Short-term bridge; refi at stabilization.
Rent comps 13 comps
| Address | Beds | Baths | Sqft | Rent | $/sqft | DOM | Units | Dist |
|---|---|---|---|---|---|---|---|---|
| 214 N Oak St Unit 2 Summit Hill, PA | 3.0 | 1.0 | 940 | $1,250 | $1.33 | 43d | 1 | 0.36mi |
| 214 N Oak St Unit 2 Summit Hill, PA | 3.0 | 1.0 | 940 | $1,250 | $1.33 | 19d | 1 | 0.36mi |
| 214 N Oak St Summit Hill, PA | 3.0 | 1.0 | 940 | $1,250 | $1.33 | 2d | 1 | 0.36mi |
| 214 N Oak St Unit 2 Summit Hill, PA | 3.0 | 1.0 | 940 | $1,200 | $1.28 | 2d | 1 | 0.36mi |
| 201 E Kline Ave Apt 3 Lansford, PA | 2.0 | 1.0 | 850 | $800 | $0.94 | 2d | 1 | 0.42mi |
| 546 E Kline Ave Lansford, PA | 3.0 | 1.0 | 1000 | $900 | $0.90 | 2d | 1 | 0.51mi |
| 4 Spring Garden St Apt 2 Lansford, PA | 2.0 | 1.0 | 850 | $875 | $1.03 | 14d | 1 | 0.52mi |
| 233 E Ridge St Lansford, PA | 2.0 | 1.0 | 850 | $900 | $1.06 | 14d | 1 | 0.53mi |
| 242 E Holland St Summit Hill, PA | 2.0 | 1.0 | 806 | $1,100 | $1.36 | 2d | 1 | 0.54mi |
| 149 W Ridge St Unit 2b Lansford, PA | 2.0 | 1.0 | 875 | $1,325 | $1.51 | 23d | 1 | 0.69mi |
| 149 W Ridge St Unit 1A Lansford, PA | 2.0 | 1.0 | 930 | $1,350 | $1.45 | 23d | 1 | 0.69mi |
| 215 E High St Coaldale, PA | 3.0 | 1.0 | 1000 | $1,000 | $1.00 | 21d | 1 | 1.35mi |
| 126 E High St Coaldale, PA | 4.0 | 1.5 | 1000 | $1,200 | $1.20 | 14d | 1 | 1.41mi |
Listing history 17 events
-
2026-06-18days on market $79,900 Active 95 DOM
-
2026-06-17days on market $79,900 Active 94 DOM
-
2026-06-16days on market $79,900 Active 93 DOM
-
2026-06-15days on market $79,900 Active 92 DOM
-
2026-06-14days on market $79,900 Active 90 DOM
-
2026-06-13days on market $79,900 Active 89 DOM
-
2026-06-10days on market $79,900 Active 87 DOM
-
2026-06-09days on market $79,900 Active 86 DOM
-
2026-06-08days on market $79,900 Active 85 DOM
-
2026-06-07days on market $79,900 Active 84 DOM
-
2026-06-05days on market $79,900 Active 81 DOM
-
2026-06-03days on market $79,900 Active 80 DOM
-
2026-06-02days on market $79,900 Active 79 DOM
-
2026-06-01days on market $79,900 Active 78 DOM
-
2026-05-31days on market $79,900 Active 77 DOM
-
2026-05-31days on market $79,900 Active 76 DOM
-
2026-03-15$79,900 Active 966-char remark
Show marketing remark (966 chars)
Located in the borough of Summit Hill, this 2-bedroom, 1½-bath home offers a great opportunity for buyers looking to add their personal touch. The property has been cleaned and is livable, while still offering room for updates and improvements. As you enter the home, you’ll find a spacious living room that leads into the main living areas, providing a functional layout for everyday living. The kitchen offers practical space with potential for future upgrades. Upstairs, the two bedrooms provide comfortable living space with natural light. There is also an attic that offers additional space and potential for a variety of uses, such as storage, a home office, or possibly an additional bedroom. A basement provides extra storage and utility space. Conveniently located near local shops, schools, and major routes, this property presents a great opportunity for homeowners or investors looking for a property with potential in a convenient location.
ⓘ Source: listings_history table (triggers on properties + properties_extension) + one-shot
backfill from property_details.listing_events for pre-trigger history.
Tax reassessment forecast PA · Partial reset (capped growth)
- Current annual tax
- $1,980 · $165/mo
- Projected year-2 tax
- $1,980 · $165/mo
- Expected delta
- $0/yr ($0/mo · 0.0%)
ⓘ Screening estimate from a state-policy table — verify with the county assessor before closing.
Climate risk First Street
- Flood 1/10 Low FEMA zone X (unshaded) · 0% chance over 30 yrs
- Wildfire 4/10 Moderate
- Heat 3/10 Moderate 7 d/yr ≥94°F today · 15 d/yr by 30 yrs out
- Wind 4/10 Moderate 8% chance of damaging wind over 30 yrs
- Air quality 2/10 Low 1 unhealthy d/yr today · 3 by 30 yrs out
Nearby sold comps map
Loading sold comps map…
Walkable amenities ~0.75 mi
Loading nearby amenities…
Taxation est. · year 1
- Rental income
- $13,367
- − Mortgage interest
- −$4,476
- − Property taxes
- −$1,980
- − Insurance
- −$400
- − Repairs & maintenance
- −$1,069
- − Management
- −$1,069
- − Depreciation
- −$2,324
- Taxable income
- $2,049
- Est. tax owed @ 24.0%
- −$492
- After-tax cash flow
- $2,661/yr
For passive investors: Depreciation is non-cash, so a rental often shows a tax loss while cash-flowing — sheltering income. Rental losses are passive: they offset passive income freely, and up to $25,000/yr can offset ordinary (W-2) income if you actively participate and your MAGI is under $100k (phasing out to $0 by $150k); unused losses carry forward. On sale, claimed depreciation is recaptured at up to 25%, and gains may owe capital-gains tax (a 1031 exchange can defer both). Figures are a year-1 estimate at your 24.0% rate — not tax advice; consult a CPA.
Schools (NCES district)
- District
- Panther Valley SD
- NCES district ID
- 4218450
- Math proficiency
- 14% ▼ -7.00%
- Reading proficiency
- 35% ▼ -14.00%
- Median HH income
- $36,914
- Composite
- 20.31/100
- National rank
- #8613
- State rank
- #477 of 539 in PA
Livability — Summit Hill
- Score
- 67/100
- State rank
- #953
- US rank
- #10454
Category grades
Schools grade is shown separately in the Schools card above.
Census & demographics
- Census place
- Summit Hill, PA
- City population
- 3,128
- Population (ZIP)
- 3,128
Population outlook (Carbon County) Hauer SSP2
- Today (2025)
- 61,643 people
- By 2030
- 59,840 · -2.9%
- By 2040
- 55,413 · -10.1%
- By 2050
- 50,843 · -17.5%
- By 2075
- 43,326 · -29.7%
- By 2100
- 37,126 · -39.8%
Race, ethnicity, and origin ACS 2023
- Neighborhood character
- Predominantly White (86%)
- Race & ethnicity
- White 86% Two or more races 12% Hispanic / Latino 9%
- Hispanic origin (detail)
- Puerto Rican 6%
- Common ancestry
- Romanian 5% Iranian 3% Scotch-Irish 3%
- Foreign-born
- 0%
- Languages at home
- 96% English-only · German/W. Germanic 2% Spanish 1% Russian/Polish/Slavic 1%
Political lean MEDSL · Carbon
- 2024 margin
- Solid R (+34.8) · D 32.2% · R 67.0%
- 2008→2024 swing
- -36.7pp toward R · 2008: 1.9pp · 2024: -34.8pp
- All cycles
- 2024: R+34.8 2020: R+32.0 2016: R+34.1 2012: R+6.9 2008: D+1.9
Not yet ingested
- Civics
- —
Market trends
- HPI YoY
- ▼ -14.90%
- Current HPI
- 193.8372
- Rent YoY
- —
- Metro
- —
- State GDP YoY
- ▲ 1.68%
- F500 in state
- 34
Industry mix (Fortune 500 HQ in PA)
| Industry | F500 HQs | Revenue |
|---|---|---|
| Healthcare | 2 | $309B |
|
||
| Insurance | 2 | $27B |
|
||
| Telecommunications / Media | 1 | $124B |
|
||
| Industrial Distribution | 1 | $22B |
|
||
| Financial Services | 1 | $20B |
|
||
| Chemicals / Materials | 1 | $18B |
|
||
Price history
1 event — show timeline
- 2026-03-15 Listed $79,900 GLVRMLS
Property tax history
+2.2%/yrLatest (2026): $1,980 · +3.7% YoY. Source: county tax records.
Cash-flow waterfall
monthlySold comps — $/sqft
last 12 mo · ≤1 miLoading sold comps…