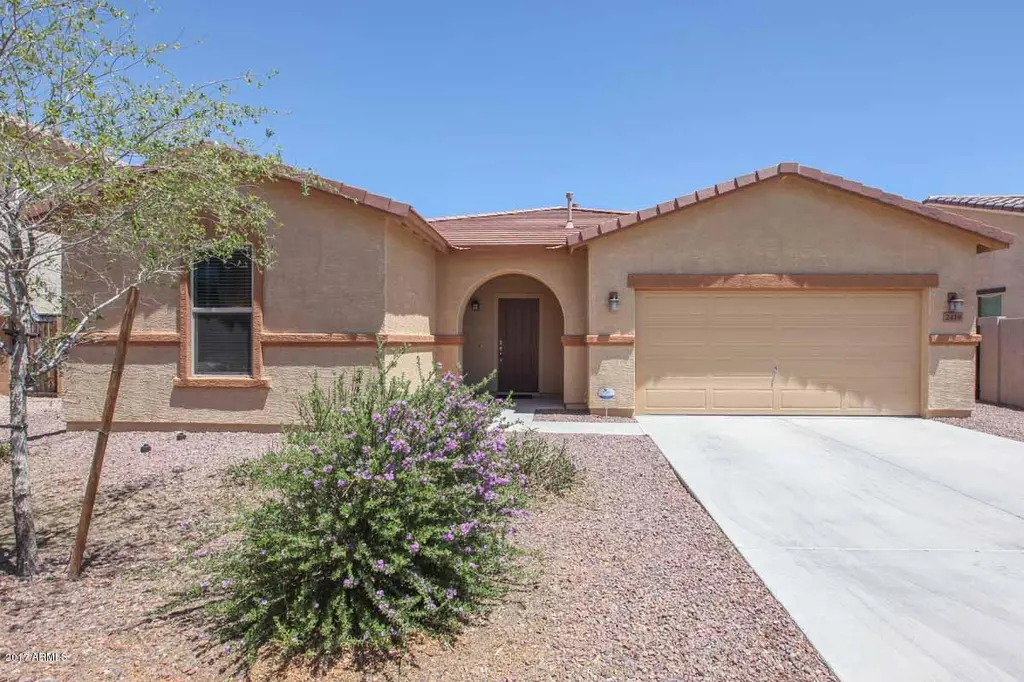
2418 W Angel Way · San Tan Valley, AZ
Flood risk 1/10 · Minimal
- FEMA flood zone
- X (unshaded)
- Chance of flooding over 30 yrs
- 0.0%
- Est. flood insurance / yr
- $507 – $1,088
Fire risk 5/10 · Moderate
- Est. fire insurance / yr
- $610 – $1,132
Heat risk 9/10 · Severe
- Hot days now (above 111°F)
- 7 days/yr
- Hot days in 30 yrs
- 19 days/yr
Wind risk 1/10 · Minimal
- Chance of severe wind over 30 yrs
- —
Air-quality risk 2/10 · Minimal
- Unhealthy air days now
- 1 days/yr
- Unhealthy air days in 30 yrs
- 1 days/yr
Risk factors via First Street. Map © Google.
Why this score? — see what drove the D- grade
The composite is a weighted blend of 9 inputs, each scored 0–100. Each bar is that input's sub-score; the figure is the points it added to the 100-point composite (weight × sub-score).
- ARV discount +13.5/15.0
- Appreciation +10.0/10.0
- Cash flow +5.5/30.0
- Livability +2.7/5.0
- Rent growth +2.5/5.0
- Condition / age +2.5/5.0
- Schools +1.8/10.0
- 1% rule +0.1/10.0
- DSCR +0.0/10.0
$375,000
🖨 Deal sheet 📄 Offer letter ✓ Due diligence
Listing remarks
Move-in ready 3 bed, 2 bath home in desirable San Tan Heights with a spacious open floor plan and 3-car tandem garage. The beautifully updated kitchen features a large island remodeled in 2022 with granite countertops, undermount stainless sink, soft-close cabinets, roll-out shelves, quartz counters, natural stone backsplash, and stainless steel appliances including a GE gas range and high-end range hood. Split primary suite, tile flooring in all the right places, and a private backyard ready for your personal touch. Enjoy community pools, parks, fitness center, and walking paths close to schools and shopping.
Key facts
- Soft-close cabinets
- Private backyard
- Large island
Tags
Neighborhood map
What this means for you Summary
Snapshot
- This is a 3-bed/2.0-bath single-family listed at $375k.
Deal economics
- At list price, monthly cash flow is $-804 ($-10k/yr) — negative.
- To cash-flow at today's rent, offer at most $233k (37.9% below list).
- To meet the 1% rule (rent ≥ 1% of price), the offer needs to be $192k (48.7% below list).
- Recommended offer: $192k (48.7% below list) — sets the bar for 1% rule.
Location & tenants
- Location reads 54/100 on livability (#282 in AZ) — a working-class tenant base; expect higher turnover. Strengths: housing A+, employment B+; Watch: crime D+, schools D, amenities F.
- Florence Unified School District (4437) (rural): math 16% / reading 24% proficiency, ranked #178 of 249 in AZ (top 72%) — low school quality limits family demand, transient renter base, plan for 1-2y turnover.
- Market conditions: 475 active listings in the ZIP; 40 comparable units currently listed for rent nearby; rentals at typical pace (median 15d on market — plan ~3-4 weeks tenant-placement turnaround); 9,504 units permitted in Pinal County in 2024 (776 in 5+ unit buildings).
Forward outlook
- In year one you build about $40k of equity ($3k loan paydown + $38k appreciation (10.0% local appreciation)).
- By year 2, paydown + projected appreciation supports a ~$64k cash-out refi (75% LTV) — recoverable capital for the next deal without selling this one.
Negotiation context
- Only 4 days on market — expect competitive offers; lowballing is unlikely to land.
- 3 sale attempts since 9y ago; this cycle's ask has dropped $54k (13%) from the opening price — seller is motivated, your offer sets the floor, not the list.
- Current owner paid $215k; list at $375k implies a 74% gain — meaningful room to come down on a strong offer.
Risks & watch-outs
- Climate carrying-cost: moderate wildfire risk; extreme-heat days projected 7→19/yr by 2055 (HVAC capex compounding) — expect insurance premiums to compound above CPI over the hold.
Questions for the listing agent
- What do current leases actually rent for vs. the listed asking? Can we see a recent rent roll and the last 12 months of T-12 income?
- What does the HOA fee cover, when was the last increase, and are there any pending special assessments or reserve-fund shortfalls?
- Is there a deadline driving the sale (1031 exchange, divorce, estate, relocation)? That informs how much negotiation room exists.
- Schools are D-rated, which usually means shorter tenancies and higher turnover. Who's the typical renter profile here, and what's been the actual vacancy rate?
- Crime grade is D in this area — have there been break-ins, vandalism, or insurance claims at this property in the last 3 years? What carrier currently insures it and at what premium?
- The area grade is low — what's the realistic commute time and amenity access for the typical tenant pool here? Any planned neighborhood developments (good or bad) we should know about?
- What's the average days-on-market for RENTAL listings here right now (not sales)? A rising rental-DOM trend means longer vacancies and softer asking-rent achievability than the comps imply.
- What's the recent tenant-quality profile in this submarket — average credit score on applications, eviction rate, late-payment / NSF rate, and stable-employment percentage? A property-management company in the area should have these aggregated.
- How much new for-sale + rental construction is in the pipeline within 1–3 miles? Heavy new supply typically softens prices + rents 12–24 months out; constrained supply supports both.
Investment metrics
- 1% rule
- 0.51% ✗
- Cap rate
- 3.72%
- Cash-on-cash
- -9.19%
- DSCR
- 0.59
- GRM
- 16.2
CMA / ARV
- ARV (median comp)
- $432,978
- List price
- $375,000
- Delta
- -7.64%
- Verdict
- FAIR
- Comps
- 20 within 1.0 mi
Show comp detail 12 sales within ~0.75 mi
| Address | Dist | Beds/Ba | Sqft | Sold | Price | $/sf | Match |
|---|---|---|---|---|---|---|---|
| 32245 N Cat Hills Ave | 0.11mi | 3/2.0 | 1,957 (+0%) | 2mo | $431,000 | $220 | 94 |
| 2388 W Peggy Dr | 0.06mi | 4/2.0 (+1) | 2,039 (+4%) | 4mo | $425,000 | $208 | 82 |
| 32310 N Cherry Creek Rd | 0.39mi | 3/2.5 | 2,095 (+7%) | 2mo | $429,000 | $205 | 66 |
| 2803 W Angel Way | 0.24mi | 4/2.5 (+1) | 2,139 (+9%) | 1mo | $425,000 | $199 | 66 |
| 2391 W Allens Peak Dr | 0.66mi | 4/2.5 (+1) | 2,010 (+3%) | 2mo | $355,000 | $177 | 56 |
| 32209 N Daylight Dr | 0.36mi | 4/2.5 (+1) | 2,167 (+11%) | 3mo | $450,000 | $208 | 56 |
| 2810 W Jasper Butte Dr | 0.45mi | 4/2.0 (+1) | 1,731 (-12%) | 0mo | $386,900 | $224 | 55 |
| 2408 W Allens Peak Dr | 0.69mi | 4/2.5 (+1) | 2,011 (+3%) | 2mo | $380,000 | $189 | 54 |
| 2330 W Hayden Peak Dr | 0.74mi | 4/2.5 (+1) | 2,011 (+3%) | 0mo | $338,000 | $168 | 54 |
| 32396 N Daylight Dr | 0.46mi | 4/2.5 (+1) | 2,167 (+11%) | 2mo | $465,000 | $215 | 52 |
| 1189 W Cutleaf Cir | 0.73mi | 2/2.0 (-1) | 1,897 (-3%) | 4mo | $450,000 | $237 | 52 |
| 33153 N Cat Hills Ave | 0.70mi | 3/2.0 | 1,666 (-15%) | 6mo | $337,500 | $203 | 38 |
Match score weights: distance 35% · size 25% · config 20% · recency 20%. Top-matched comps best support the ARV.
Projected returns pro-forma
10.0% appreciation · 3.0% rent growth · sell at horizon
- IRR
- 17.8%
- Equity multiple
- 2.46×
- Total profit
- $152,879
- Equity at exit
- $337,830
- IRR
- 16.7%
- Equity multiple
- 5.67×
- Total profit
- $490,213
- Equity at exit
- $728,543
Cash invested: $105,000 (down + closing). Projections, not guarantees.
Landlord ↔ Tenant lean methodology
- Overall (STATE)
- 87 Strongly Landlord-Friendly
- State Arizona
- 87 Strongly Landlord-Friendly · R+3
- County
- — inherits STATE
- City
- — inherits STATE
ZIP-level market 85144
- Home prices YoY
- 7.2%
- Active inventory
- 475
- Price-to-rent
- 16.2×
Monthly cashflow live
- Estimated rent
- $1,924 high interval (Pro) →
- Mortgage (P&I)
- −$1,967
- Tax from tax record
- −$107 /mo · $1,287/yr
- Insurance
- −$156
- HOA
- −$94
- Vacancy / Maint / Mgmt
- −$404
- Net cashflow
- $-804
Break-even live
UW: 25.0% down · 7.5% · 30yr · 1.5% tax · 5.0% vac · 8.0% maint · 8.0% mgmt
Financing live
Cash to close
- Down payment
- $93,750
- Closing costs
- $11,250
- Reserves months
- —
- Total cash needed
- —
Loan-product check · same deal, 3 products live
Conventional
25% down · 7.5% · 30yr
- Down + closing
- —
- Monthly P&I
- —
- Monthly cashflow
- —
- DSCR
- —
- Eligible?
- —
Personal DTI + credit; lowest rate.
DSCR
20% down · 8.5% · 30yr
- Down + closing
- —
- Monthly P&I
- —
- Monthly cashflow
- —
- DSCR
- —
- Eligible?
- —
No personal income docs; deal must DSCR.
Hard money
10% down · 12.0% · 12mo
- Down + closing
- —
- Monthly P&I
- —
- Monthly cashflow
- —
- DSCR
- —
- Eligible?
- —
Short-term bridge; refi at stabilization.
Rent comps 40 comps
| Address | Beds | Baths | Sqft | Rent | $/sqft | DOM | Units | Dist |
|---|---|---|---|---|---|---|---|---|
| 2306 W Kristina Ave San Tan Valley, AZ | 4.0 | 2.0 | 1464 | $1,650 | $1.13 | 24d | 1 | 0.16mi |
| 2683 W Kristina Ave San Tan Valley, AZ | 3.0 | 2.0 | 1410 | $1,850 | $1.31 | 43d | 1 | 0.27mi |
| 2906 W Angel Way San Tan Valley, AZ | 4.0 | 2.0 | 2604 | $1,580 | $0.61 | 15d | 1 | 0.31mi |
| 2125 W Goldmine Mountain Dr Unit 1546392P San Tan Valley, AZ | 3.0 | 2.0 | 1593 | $3,899 | $2.45 | 12d | 1 | 0.32mi |
| 32209 N Daylight Dr San Tan Valley, AZ | 4.0 | 3.0 | 2167 | $2,200 | $1.02 | 43d | 1 | 0.35mi |
| 2060 W Goldmine Mountain Dr San Tan Valley, AZ | 4.0 | 2.0 | 1869 | $2,181 | $1.17 | 24d | 1 | 0.37mi |
| 1533 W Sabel Ct San Tan Valley, AZ | 4.0 | 2.0 | 1870 | $2,145 | $1.15 | 5d | 1 | 0.50mi |
| 32449 N Gary Rd San Tan Valley, AZ | 1.0–3.0 | 1.0–2.0 | 1072 | $2,465 | $2.30 | 1d | 72 | 0.57mi |
| 2899 W White Canyon Rd San Tan Valley, AZ | 3.0 | 2.0 | 1981 | $1,950 | $0.98 | 2d | 1 | 0.58mi |
| 33053 N North Butte Dr San Tan Valley, AZ | 4.0 | 2.0 | 1520 | $1,985 | $1.31 | 3d | 1 | 0.59mi |
| 33082 N Cat Hills Ave San Tan Valley, AZ | 3.0 | 2.0 | 1704 | $1,795 | $1.05 | 18d | 1 | 0.61mi |
| 33082 N Cat Hills Ave San Tan Valley, AZ | 3.0 | 2.0 | 1703 | $1,695 | $1.00 | 5d | 1 | 0.61mi |
| 2029 W Allens Peak Dr San Tan Valley, AZ | 4.0 | 2.0 | 1685 | $1,980 | $1.18 | 2d | 1 | 0.61mi |
| 2460 W Tanner Ranch Rd San Tan Valley, AZ | 4.0 | 2.0 | 1520 | $1,980 | $1.30 | 2d | 1 | 0.62mi |
| 2053 W Hayden Peak Dr San Tan Valley, AZ | 4.0 | 3.0 | 1914 | $2,045 | $1.07 | 2d | 1 | 0.65mi |
| 1817 W Desert Seasons Dr San Tan Valley, AZ | 4.0 | 2.5 | 2470 | $1,207 | $0.49 | 20d | 1 | 0.78mi |
| 1847 W Desert Seasons Dr San Tan Valley, AZ | 4.0 | 2.0 | 1679 | $1,695 | $1.01 | 22d | 1 | 0.79mi |
| 1818 W Desert Seasons Dr San Tan Valley, AZ | 4.0 | 2.5 | 2321 | $2,090 | $0.90 | 15d | 1 | 0.81mi |
| 1868 W Desert Seasons Dr San Tan Valley, AZ | 4.0 | 2.0 | 1678 | $1,950 | $1.16 | 20d | 1 | 0.83mi |
| 3162 W Sunshine Butte Dr San Tan Valley, AZ | 4.0 | 2.0 | 1600 | $1,850 | $1.16 | 22d | 1 | 0.83mi |
| 2924 W Allens Peak Dr San Tan Valley, AZ | 3.0 | 2.0 | 1765 | $1,880 | $1.07 | 2d | 1 | 0.84mi |
| 2924 W Allens Peak Dr San Tan Valley, AZ | 3.0 | 2.0 | 1765 | $1,955 | $1.11 | 11d | 1 | 0.84mi |
| 33024 N Madison Way Dr San Tan Valley, AZ | 3.0 | 2.0 | 1500 | $1,700 | $1.13 | 15d | 1 | 0.86mi |
| 1814 W Desert Hills Dr San Tan Valley, AZ | 4.0 | 2.0 | 1541 | $1,895 | $1.23 | 43d | 1 | 0.86mi |
| 2699 W Camp River Rd San Tan Valley, AZ | 3.0 | 2.0 | 1766 | $1,975 | $1.12 | 43d | 1 | 0.88mi |
| 3560 W Mesquite Ave San Tan Valley, AZ | 3.0 | 2.0 | 1453 | $1,750 | $1.20 | 11d | 1 | 0.95mi |
| 3849 W South Butte Rd San Tan Valley, AZ | 4.0 | 2.0 | 1884 | $1,846 | $0.98 | 43d | 1 | 1.02mi |
| 900 W Desert Canyon Dr San Tan Valley, AZ | 4.0 | 2.0 | 1614 | $1,955 | $1.21 | 24d | 1 | 1.09mi |
| 3194 W Yellow Peak Dr San Tan Valley, AZ | 4.0 | 2.0 | 1925 | $1,908 | $0.99 | 43d | 1 | 1.11mi |
| 33856 N Cherry Creek Rd San Tan Valley, AZ | 3.0 | 2.0 | 1928 | $1,850 | $0.96 | 43d | 1 | 1.11mi |
| 33023 N Quarry Hills Dr San Tan Valley, AZ | 3.0 | 2.0 | 1806 | $1,999 | $1.11 | 11d | 1 | 1.11mi |
| 1469 W Virgil Dr San Tan Valley, AZ | 3.0 | 2.0 | 1360 | $2,145 | $1.58 | 20d | 1 | 1.12mi |
| 1469 W Virgil Dr San Tan Valley, AZ | 3.0 | 2.0 | 1360 | $2,145 | $1.58 | 1d | 1 | 1.12mi |
| 3369 W Yellow Peak Dr San Tan Valley, AZ | 4.0 | 2.5 | 2617 | $2,795 | $1.07 | 4d | 1 | 1.14mi |
| 1154 W Oak Tree Ln San Tan Valley, AZ | 4.0 | 2.0 | 1650 | $1,895 | $1.15 | 43d | 1 | 1.14mi |
| 33897 N Wash View Rd San Tan Valley, AZ | 3.0 | 2.0 | 1721 | $1,980 | $1.15 | 2d | 1 | 1.20mi |
| 654 W Desert Mountain Dr San Tan Valley, AZ | 4.0 | 2.0 | 2315 | $2,095 | $0.90 | 5d | 1 | 1.20mi |
| 654 W Desert Mountain Dr San Tan Valley, AZ | 4.0 | 2.0 | 2315 | $2,195 | $0.95 | 24d | 1 | 1.20mi |
| 2993 W Dancer Ln San Tan Valley, AZ | 3.0 | 2.0 | 1290 | $1,700 | $1.32 | 43d | 1 | 1.23mi |
| 3102 W Belle Ave San Tan Valley, AZ | 4.0 | 2.0 | 1909 | $1,900 | $1.00 | 12d | 1 | 1.23mi |
HOA detail
- Monthly dues
- $94 · $1,128/yr
- Likely covers
- gaspoolgym
Listing history 14 events
-
2026-05-10historical
-
2026-03-30price $399,900
-
2026-03-13price $419,900
-
2026-03-02$429,000 Active
-
2026-01-12historical
-
2025-11-20$429,000 Active
-
2017-11-14soldstatus $215,000 Closed
-
2017-11-14soldstatus $215,000
-
2017-10-19status Pending
-
2017-09-26price $229,900
-
2017-06-14$235,900 Active
-
2010-11-03soldstatus $702,000
-
2010-01-04soldstatus $228,368
-
2004-09-17soldstatus $5,440,500
ⓘ Source: listings_history table (triggers on properties + properties_extension) + one-shot
backfill from property_details.listing_events for pre-trigger history.
Tax reassessment forecast AZ · Resets to sale price
- Current annual tax
- $1,287 · $107/mo
- Projected year-2 tax
- $2,475 · $206/mo
- Expected delta
- +$1,188/yr (+$99/mo · 92.3%)
ⓘ Screening estimate from a state-policy table — verify with the county assessor before closing.
Climate risk First Street
- Flood 1/10 Low FEMA zone X (unshaded) · 0% chance over 30 yrs
- Wildfire 5/10 Major
- Heat 9/10 Extreme 7 d/yr ≥111°F today · 19 d/yr by 30 yrs out
- Wind 1/10 Low
- Air quality 2/10 Low 1 unhealthy d/yr today · 1 by 30 yrs out
Nearby sold comps map
Loading sold comps map…
Walkable amenities ~0.75 mi
Loading nearby amenities…
Taxation est. · year 1
- Rental income
- $23,086
- − Mortgage interest
- −$21,006
- − Property taxes
- −$1,287
- − Insurance
- −$1,875
- − Repairs & maintenance
- −$1,847
- − Management
- −$1,847
- − HOA
- −$1,128
- − Depreciation
- −$10,909
- Taxable loss
- −$16,813
- Est. tax savings @ 24.0%
- +$4,035
- After-tax cash flow
- $-5,616/yr
For passive investors: Depreciation is non-cash, so a rental often shows a tax loss while cash-flowing — sheltering income. Rental losses are passive: they offset passive income freely, and up to $25,000/yr can offset ordinary (W-2) income if you actively participate and your MAGI is under $100k (phasing out to $0 by $150k); unused losses carry forward. On sale, claimed depreciation is recaptured at up to 25%, and gains may owe capital-gains tax (a 1031 exchange can defer both). Figures are a year-1 estimate at your 24.0% rate — not tax advice; consult a CPA.
Schools (NCES district)
- District
- Florence Unified School District (4437)
- NCES district ID
- 0402920
- Math proficiency
- 16% ▼ -11.00%
- Reading proficiency
- 24% ▼ -7.00%
- Median HH income
- $54,426
- Composite
- 18.31/100
- National rank
- #8950
- State rank
- #178 of 249 in AZ
Livability — San Tan Valley
- Score
- 54/100
- State rank
- #282
- US rank
- #24192
Category grades
Schools grade is shown separately in the Schools card above.
Census & demographics
- Census place
- San Tan Valley, AZ
Population outlook (Pinal County) Hauer SSP2
- Today (2025)
- 437,574 people
- By 2030
- 446,903 · +2.1%
- By 2040
- 452,589 · +3.4%
- By 2050
- 444,126 · +1.5%
- By 2075
- 430,300 · -1.7%
- By 2100
- 393,536 · -10.1%
Not yet ingested
- Political lean
- —
- Race & ethnicity
- —
- Common origin
- —
- Civics
- —
Market trends
- HPI YoY
- ▲ 24.94%
- Current HPI
- 372.52
- Rent YoY
- —
- Metro
- —
- State GDP YoY
- ▲ 4.54%
- F500 in state
- 20
Industry mix (Fortune 500 HQ in AZ)
| Industry | F500 HQs | Revenue |
|---|---|---|
| Technology | 2 | $13B |
|
||
| Mining / Metals | 1 | $23B |
|
||
| Environmental Services | 1 | $16B |
|
||
| Metals / Steel | 1 | $14B |
|
||
| Technology Distribution | 1 | $9B |
|
||
| Homebuilding | 1 | $8B |
|
||
Price history
-92.6% since first listed14 events — show timeline
- 2026-05-10 Listing Removed — ARMLS
- 2026-03-30 Price Changed $399,900 ARMLS
- 2026-03-13 Price Changed $419,900 ARMLS
- 2026-03-02 Listed $429,000 ARMLS
- 2026-01-12 Listing Removed — ARMLS
- 2025-11-20 Listed $429,000 ARMLS
- 2017-11-14 Sold (Public Records) $215,000 Public Records
- 2017-11-14 Sold (MLS) $215,000 ARMLS
- 2017-10-19 Pending — ARMLS
- 2017-09-26 Price Changed $229,900 ARMLS
- 2017-06-14 Listed $235,900 ARMLS
- 2010-11-03 Sold (Public Records) $702,000 Public Records
- 2010-01-04 Sold (Public Records) $228,368 Public Records
- 2004-09-17 Sold (Public Records) $5,440,500 Public Records
Property tax history
+8.0%/yrLatest (2025): $1,287 · +2.0% YoY. Source: county tax records.
Cash-flow waterfall
monthlySold comps — $/sqft
last 12 mo · ≤1 miLoading sold comps…