7400 46th Ave N · West Lealman, FL
Flood risk 1/10 · Minimal
- FEMA flood zone
- X (unshaded)
- Chance of flooding over 30 yrs
- 0.0%
- Est. flood insurance / yr
- $507 – $1,088
Fire risk 1/10 · Minimal
- Est. fire insurance / yr
- $947 – $1,759
Heat risk 10/10 · Severe
- Hot days now (above 107°F)
- 6 days/yr
- Hot days in 30 yrs
- 19 days/yr
Wind risk 10/10 · Severe
- Chance of severe wind over 30 yrs
- 99.0%
Air-quality risk 4/10 · Minor
- Unhealthy air days now
- 4 days/yr
- Unhealthy air days in 30 yrs
- 4 days/yr
Risk factors via First Street. Map © Google.
Why this score? — see what drove the D+ grade
The composite is a weighted blend of 9 inputs, each scored 0–100. Each bar is that input's sub-score; the figure is the points it added to the 100-point composite (weight × sub-score).
- Cash flow +15.0/30.0
- ARV discount +7.5/15.0
- 1% rule +5.0/10.0
- DSCR +5.0/10.0
- Schools +4.3/10.0
- Livability +4.0/5.0
- Rent growth +2.7/5.0
- Condition / age +2.5/5.0
- Appreciation +0.0/10.0
$14,500
🖨 Deal sheet 📄 Offer letter ✓ Due diligence
Listing remarks
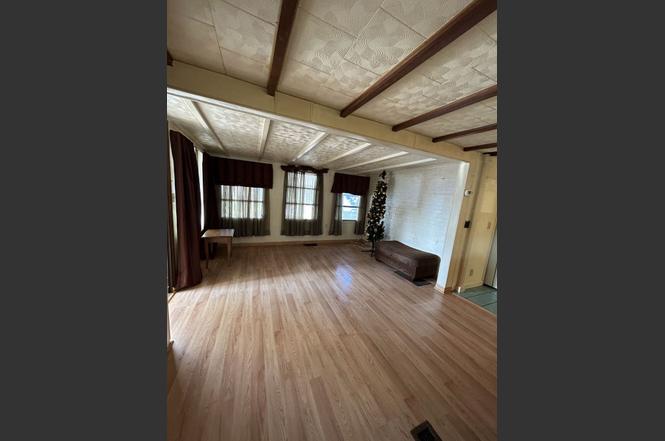
This double wide, move-in ready 3/1.5 mobile home with great open floor plan and lots of windows sitting in Isle of Palms 55+ community is a must see. Has some blemishes, was remodeled in 2012, but washer, dryer, stove and refrigerator are less than 4 years old. It has a 2 car carport, and a large Storage shed. The community has a lot of community functions and it is near public transportation and the mall.
Key facts
- Open floor plan
- Near the mall
- Remodeled in 2012
Tags
Property features AI
Exterior
- Home design: House; 940 total living area (units not specified)
- Exterior features: Lot approximately 1,000 (units not specified)
Neighborhood map
What this means for you Summary
Snapshot
- This is a 3-bed/1.5-bath land listed at $14k.
Deal economics
- At list price, monthly cash flow is $2k ($28k/yr) — positive.
- The deal already cash-flows at list — no discount required.
- Meets the 1% rule at list price ($3k rent vs $14k).
- Recommended offer: $13k (12.0% below list) — sets the bar for market timing.
- Cap rate 201.5% vs local median 1.8% in West Lealman — top-decile yield for the area; either an underpriced asset or a hidden risk that comps aren't pricing in. Stress-test before assuming the spread holds.
Location & tenants
- Location reads 81/100 on livability (#84 in FL, #1,396 nationally) — a professional / high-income tenant draw. Strengths: commute A+, cost of living A+, housing A+; Watch: schools C-, employment D+, amenities F.
- Pinellas (suburban): math 51% / reading 51% proficiency, ranked #31 of 73 in FL (top 42%) — acceptable for families but not a draw, mixed tenant base, ~2y average lease.
- Market conditions: Rents flat; 309 active listings in the ZIP; 8 comparable units currently listed for rent nearby; rentals at typical pace (median 18d on market — plan ~3-4 weeks tenant-placement turnaround); 2,676 units permitted in Pinellas County in 2024 (1,422 in 5+ unit buildings).
- At $3,112/mo this rent would consume 70% of the median local household income ($54k/yr) (locally 712% of renters already pay >50% of income on rent) — very limited rent-growth headroom before tenants either downsize or default.
Forward outlook
- Local home prices are declining (-3.0%/yr); year-one equity from $100 of loan paydown is wiped out by about $435 of value loss. Plan a longer hold.
- Pinellas County population projected at +14% by 2050 — modest demand growth; plan on rents tracking national, not racing it.
- At projected returns (-3.0% appreciation + 1.0% rent growth), your $4k cash investment doubles in ~1 year — after that, you're playing with house money.
Negotiation context
- It's been on market 187 days — a 12% lower offer ($13k) is reasonable based on typical stale-listing flexibility.
Risks & watch-outs
- Climate carrying-cost: severe wind risk, 99% chance of damaging wind over 30y; extreme-heat days projected 6→19/yr by 2055 (HVAC capex compounding) — expect insurance premiums to compound above CPI over the hold.
Questions for the listing agent
- It's been on market 187 days. Have you received any prior offers? Is the seller open to a 12% concession, seller financing, or rate buy-down credit?
- Built in 1974 — when were the roof, HVAC, electrical panel, plumbing, and water heater last replaced?
- Why hasn't it sold? Are there any deal-killer items the seller is aware of (foundation, flood, title, zoning, code violations)?
- Is there a deadline driving the sale (1031 exchange, divorce, estate, relocation)? That informs how much negotiation room exists.
- The area grade is low — what's the realistic commute time and amenity access for the typical tenant pool here? Any planned neighborhood developments (good or bad) we should know about?
- What's the average days-on-market for RENTAL listings here right now (not sales)? A rising rental-DOM trend means longer vacancies and softer asking-rent achievability than the comps imply.
- What's the recent tenant-quality profile in this submarket — average credit score on applications, eviction rate, late-payment / NSF rate, and stable-employment percentage? A property-management company in the area should have these aggregated.
- How much new for-sale + rental construction is in the pipeline within 1–3 miles? Heavy new supply typically softens prices + rents 12–24 months out; constrained supply supports both.
Investment metrics
- 1% rule
- 21.46% ✓
- Cap rate
- 201.45%
- Cash-on-cash
- 696.99%
- DSCR
- 32.01
- GRM
- 0.4
CMA / ARV
No comps found within radius.
Projected returns pro-forma
-3.0% appreciation · 0.99% rent growth · sell at horizon
- IRR
- —
- Equity multiple
- 35.91×
- Total profit
- $141,719
- Equity at exit
- $2,162
- IRR
- —
- Equity multiple
- 73.09×
- Total profit
- $292,677
- Equity at exit
- $1,254
Cash invested: $4,060 (down + closing). Projections, not guarantees.
Landlord ↔ Tenant lean methodology
- Overall (STATE)
- 87 Strongly Landlord-Friendly
- State Florida
- 87 Strongly Landlord-Friendly · R+3
- County
- — inherits STATE
- City
- — inherits STATE
ZIP-level market 33709
- Rents YoY
- 1.0%
- Active inventory
- 309
- Price-to-rent
- 0.4×
Monthly cashflow live
- Estimated rent
- $3,112 high interval (Pro) →
- Mortgage (P&I)
- −$76
- Tax est. 1.5%
- −$18 /mo · $218/yr
- Insurance
- −$6
- HOA
- −$0
- Vacancy / Maint / Mgmt
- −$653
- Net cashflow
- $2,358
Break-even live
UW: 25.0% down · 7.5% · 30yr · 1.5% tax · 5.0% vac · 8.0% maint · 8.0% mgmt
Financing live
Cash to close
- Down payment
- $3,625
- Closing costs
- $435
- Reserves months
- —
- Total cash needed
- —
Loan-product check · same deal, 3 products live
Conventional
25% down · 7.5% · 30yr
- Down + closing
- —
- Monthly P&I
- —
- Monthly cashflow
- —
- DSCR
- —
- Eligible?
- —
Personal DTI + credit; lowest rate.
DSCR
20% down · 8.5% · 30yr
- Down + closing
- —
- Monthly P&I
- —
- Monthly cashflow
- —
- DSCR
- —
- Eligible?
- —
No personal income docs; deal must DSCR.
Hard money
10% down · 12.0% · 12mo
- Down + closing
- —
- Monthly P&I
- —
- Monthly cashflow
- —
- DSCR
- —
- Eligible?
- —
Short-term bridge; refi at stabilization.
Rent comps 8 comps
| Address | Beds | Baths | Sqft | Rent | $/sqft | DOM | Units | Dist |
|---|---|---|---|---|---|---|---|---|
| 5341 71st Way N Saint Petersburg, FL | 3.0 | 2.5 | 1807 | $4,100 | $2.27 | 4d | 1 | 0.70mi |
| 6400 46th Ave N #10 Kenneth City, FL | 4.0 | 3.0 | 1616 | $2,500 | $1.55 | 18d | 1 | 1.00mi |
| 2901 70th St N Unit 1546478P St. Petersburg, FL | 3.0 | 2.0 | 1614 | $4,682 | $2.90 | 16d | 1 | 1.04mi |
| 6400 46th Ave N Kenneth City, FL | 4.0 | 3.0 | 1616 | $2,500 | $1.55 | 20d | 1 | 1.12mi |
| 2851 67th St N Saint Petersburg, FL | 4.0 | 2.0 | 1636 | $3,200 | $1.96 | 24d | 1 | 1.19mi |
| 8186 Terrace Garden Dr N #409 St Petersburg, FL | 2.0 | 2.0 | 1765 | $2,200 | $1.25 | 4d | 1 | 1.23mi |
| 2153 75th Way N Saint Petersburg, FL | 3.0 | 2.0 | 1410 | $3,500 | $2.48 | 22d | 1 | 1.35mi |
| 2121 Park St N Saint Petersburg, FL | 4.0 | 4.0 | 2346 | $3,800 | $1.62 | 16d | 1 | 1.49mi |
Listing history 16 events
-
2026-06-18days on market $14,500 Active 187 DOM
-
2026-06-17days on market $14,500 Active 186 DOM
-
2026-06-16days on market $14,500 Active 185 DOM
-
2026-06-15days on market $14,500 Active 184 DOM
-
2026-06-13days on market $14,500 Active 182 DOM
-
2026-06-09days on market $14,500 Active 178 DOM
-
2026-06-08days on market $14,500 Active 177 DOM
-
2026-06-07days on market $14,500 Active 176 DOM
-
2026-06-04days on market $14,500 Active 173 DOM
-
2026-06-03days on market $14,500 Active 172 DOM
-
2026-06-01days on market $14,500 Active 170 DOM
-
2026-05-31days on market $14,500 Active 169 DOM
-
2025-12-13$14,500 Active
-
1994-06-30soldstatus $241,700
-
1994-06-27soldstatus $262,000
-
1994-06-27soldstatus $71,300
ⓘ Source: listings_history table (triggers on properties + properties_extension) + one-shot
backfill from property_details.listing_events for pre-trigger history.
Climate risk First Street
- Flood 1/10 Low FEMA zone X (unshaded) · 0% chance over 30 yrs
- Wildfire 1/10 Low
- Heat 10/10 Extreme 6 d/yr ≥107°F today · 19 d/yr by 30 yrs out
- Wind 10/10 Extreme 99% chance of damaging wind over 30 yrs
- Air quality 4/10 Moderate 4 unhealthy d/yr today · 4 by 30 yrs out
Nearby sold comps map
Loading sold comps map…
Walkable amenities ~0.75 mi
Loading nearby amenities…
Taxation est. · year 1
- Rental income
- $37,342
- − Mortgage interest
- −$812
- − Property taxes
- −$218
- − Insurance
- −$72
- − Repairs & maintenance
- −$2,987
- − Management
- −$2,987
- − Depreciation
- −$422
- Taxable income
- $29,843
- Est. tax owed @ 24.0%
- −$7,162
- After-tax cash flow
- $21,135/yr
For passive investors: Depreciation is non-cash, so a rental often shows a tax loss while cash-flowing — sheltering income. Rental losses are passive: they offset passive income freely, and up to $25,000/yr can offset ordinary (W-2) income if you actively participate and your MAGI is under $100k (phasing out to $0 by $150k); unused losses carry forward. On sale, claimed depreciation is recaptured at up to 25%, and gains may owe capital-gains tax (a 1031 exchange can defer both). Figures are a year-1 estimate at your 24.0% rate — not tax advice; consult a CPA.
Schools (NCES district)
- District
- Pinellas
- NCES district ID
- 1201560
- Math proficiency
- 51% ▼ -5.00%
- Reading proficiency
- 51% ▼ -3.00%
- Median HH income
- $46,270
- Composite
- 43.27/100
- National rank
- #3046
- State rank
- #31 of 73 in FL
Livability — West Lealman
- Score
- 81/100
- State rank
- #84
- US rank
- #1396
Category grades
Schools grade is shown separately in the Schools card above.
Census & demographics
- Census place
- West Lealman, FL
- County
- Pinellas County · 939,478 people
- Metro
- Tampa-St. Petersburg-Clearwater, FL
- Population (ZIP)
- 25,050
- Household income
- $53,501
- Rent vs Own
- Severe rent burden
- 712.0
Population outlook (Pinellas County) Hauer SSP2
- Today (2025)
- 1,027,532 people
- By 2030
- 1,063,586 · +3.5%
- By 2040
- 1,125,020 · +9.5%
- By 2050
- 1,168,637 · +13.7%
- By 2075
- 1,265,188 · +23.1%
- By 2100
- 1,260,357 · +22.7%
Race, ethnicity, and origin ACS 2023
- Neighborhood character
- Predominantly White (73%)
- Race & ethnicity
- White 73% Hispanic / Latino 11% Two or more races 10% Black 5% Asian 5%
- Hispanic origin (detail)
- Mexican 2% Puerto Rican 3% Cuban 2% Dominican 1%
- Common ancestry
- Lithuanian 3% Romanian 3% Slovak 2%
- Foreign-born
- 14% · Canada, Vietnam, Jamaica
- Languages at home
- 84% English-only · Spanish 9% Other Indo-European 2% Vietnamese 2%
Political lean MEDSL · Pinellas
- 2024 margin
- Lean R (+5.2) · D 46.9% · R 52.1%
- 2008→2024 swing
- -13.5pp toward R · 2008: 8.3pp · 2024: -5.2pp
- All cycles
- 2024: R+5.2 2020: D+0.2 2016: R+1.1 2012: D+5.6 2008: D+8.3
Not yet ingested
- Civics
- —
Market trends
- HPI YoY
- ▼ -416.74%
- Current HPI
- 391.368
- Rent YoY
- ▲ 0.99%
- Metro
- Tampa-St. Petersburg-Clearwater, FL
- State GDP YoY
- ▲ 3.28%
- F500 in state
- 36
Industry mix (Fortune 500 HQ in FL)
| Industry | F500 HQs | Revenue |
|---|---|---|
| Industrial Technology | 2 | $29B |
|
||
| Insurance | 2 | $17B |
|
||
| Retail | 1 | $60B |
|
||
| Technology Distribution | 1 | $58B |
|
||
| Homebuilding | 1 | $35B |
|
||
| Technology Manufacturing | 1 | $35B |
|
||
Price history
-94.5% since first listed4 events — show timeline
- 2025-12-13 Listed $14,500 ForSaleByOwner.com
- 1994-06-30 Sold (Public Records) $241,700 Public Records
- 1994-06-27 Sold (Public Records) $71,300 Public Records
- 1994-06-27 Sold (Public Records) $262,000 Public Records
Property tax history
+10.8%/yrLatest (2025): $209,199 · +11.0% YoY. Source: county tax records.
Cash-flow waterfall
monthlySold comps — $/sqft
last 12 mo · ≤1 miLoading sold comps…