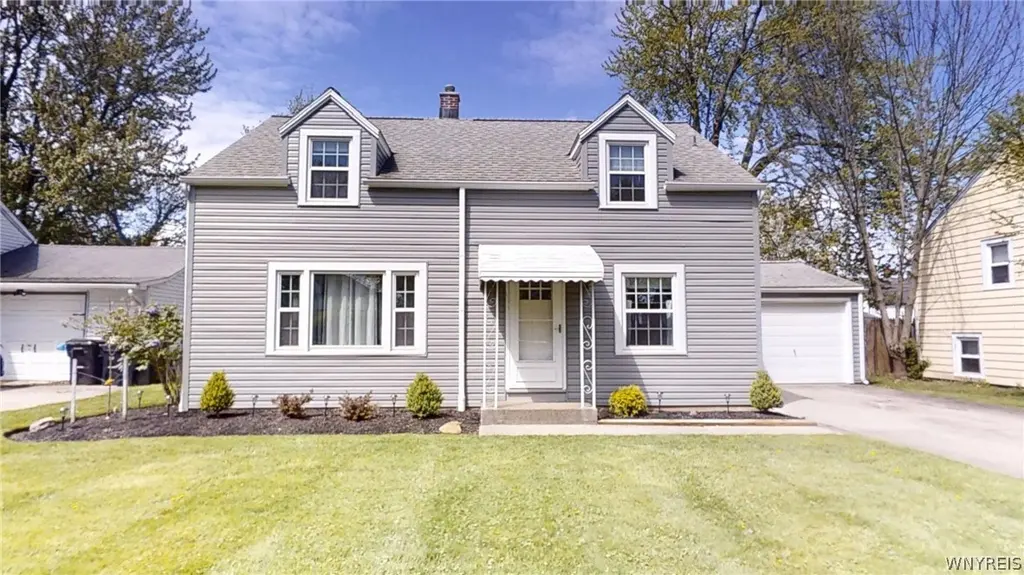
130 Kettering Dr · Tonawanda Town, NY
Flood risk 1/10 · Minimal
- FEMA flood zone
- X (unshaded)
- Chance of flooding over 30 yrs
- 0.0%
- Est. flood insurance / yr
- $473 – $860
Fire risk 1/10 · Minimal
- Est. fire insurance / yr
- $691 – $1,283
Heat risk 3/10 · Minor
- Hot days now (above 92°F)
- 7 days/yr
- Hot days in 30 yrs
- 15 days/yr
Wind risk 1/10 · Minimal
- Chance of severe wind over 30 yrs
- —
Air-quality risk 3/10 · Minor
- Unhealthy air days now
- 2 days/yr
- Unhealthy air days in 30 yrs
- 3 days/yr
Risk factors via First Street. Map © Google.
Why this score? — see what drove the D+ grade
The composite is a weighted blend of 9 inputs, each scored 0–100. Each bar is that input's sub-score; the figure is the points it added to the 100-point composite (weight × sub-score).
- ARV discount +15.0/15.0
- Cash flow +12.9/30.0
- 1% rule +6.0/10.0
- DSCR +3.9/10.0
- Schools +3.9/10.0
- Rent growth +2.5/5.0
- Livability +2.5/5.0
- Condition / age +2.5/5.0
- Appreciation +0.0/10.0
$175,000
🖨 Deal sheet (PDF) 📄 Offer letter ✓ Due diligence
Listing remarks
Well maintained and move-in ready home featuring bright, inviting living spaces and a flexible layout throughout. The spacious living room offers neutral décor, updated carpeting, and abundant natural light. The eat-in kitchen has a clean, functional design perfect for everyday living. Two generously sized bedrooms on the second floor one with beautiful hardwood floors and ample closet space, the other has new vinyl floors and a large closet. The third floor provides an additional bedroom with walk in closet. The attic also on the third floor presents excellent potential for future finishing, additional living space, studio space, or abundant storage. Outside, enjoy attractive curb a
Key facts
- Flexible layout
- Curb appeal
- Eat-in kitchen
Tags
Property features AI
Exterior
- Parking: Attached garage (1 car)
- Utilities: Public water connected; Sewer connected
- Home design: Single-story building (listed as 1 story total); Vinyl siding; Asphalt roof; Existing/resale property
- Construction: Built (existing); Block foundation
- Exterior features: Concrete driveway; Rectangular residential lot (60 x 110); City street frontage on a main thoroughfare
Interior
- Kitchen: Dishwasher; Electric oven; Electric range; Refrigerator
- Bedrooms: Bedroom 1 on second level (approx. 12 x 12); Bedroom 2 on second level (approx. 12 x 11); Bedroom 3 on third level (approx. 18 x 9.5)
- Flooring: Laminate; Vinyl; Varies
- Bathrooms: 1 full bathroom
- Heating & cooling: Gas forced-air heating
- Interior features: Eat-in kitchen; Separate/formal living room; Partial basement; Total of 5 rooms
- Laundry & utility: Laundry in basement; Gas water heater
Neighborhood map
What this means for you Summary
Snapshot
- This is a 3-bed/1.0-bath single-family listed at $175k.
Deal economics
- At list price, monthly cash flow is $-12 ($-150/yr) — negative.
- To cash-flow at today's rent, offer at most $173k (1.3% below list).
- Meets the 1% rule at list price ($2k rent vs $175k).
- Recommended offer: $173k (1.3% below list) — sets the bar for cash-flow.
- Cap rate 6.2% vs local median 4.1% in Tonawanda Town — top-decile yield for the area; either an underpriced asset or a hidden risk that comps aren't pricing in. Stress-test before assuming the spread holds.
Location & tenants
- Location reads: area grade D — affects rentability + tenant quality, not the cash-flow math above.
- Kenmore-Tonawanda Union Free School District (suburban): math 44% / reading 47% proficiency, ranked #453 of 590 in NY (top 77%) — families likely to look elsewhere, expect single-tenant / working-renter base with shorter leases.
- Market conditions: 119 active listings in the ZIP; 16 comparable units currently listed for rent nearby; rentals at typical pace (median 17d on market — plan ~3-4 weeks tenant-placement turnaround); solid renter incomes; 1,244 units permitted in Erie County in 2024 (563 in 5+ unit buildings).
Forward outlook
- Local home prices are declining (-3.0%/yr); year-one equity from $1k of loan paydown is wiped out by about $5k of value loss. Plan a longer hold.
Negotiation context
- Only 9 days on market — expect competitive offers; lowballing is unlikely to land.
Risks & watch-outs
- Watch-outs: property tax is 3.8% of price; built in 1948 — expect roof / HVAC / electrical / plumbing capex.
Questions for the listing agent
- What do current leases actually rent for vs. the listed asking? Can we see a recent rent roll and the last 12 months of T-12 income?
- Built in 1948 — when were the roof, HVAC, electrical panel, plumbing, and water heater last replaced?
- Property tax is high relative to price — has the assessment been appealed recently, and will the sale trigger a re-assessment?
- Is there a deadline driving the sale (1031 exchange, divorce, estate, relocation)? That informs how much negotiation room exists.
- The area grade is low — what's the realistic commute time and amenity access for the typical tenant pool here? Any planned neighborhood developments (good or bad) we should know about?
- What's the average days-on-market for RENTAL listings here right now (not sales)? A rising rental-DOM trend means longer vacancies and softer asking-rent achievability than the comps imply.
- What's the recent tenant-quality profile in this submarket — average credit score on applications, eviction rate, late-payment / NSF rate, and stable-employment percentage? A property-management company in the area should have these aggregated.
- How much new for-sale + rental construction is in the pipeline within 1–3 miles? Heavy new supply typically softens prices + rents 12–24 months out; constrained supply supports both.
Investment metrics
- 1% rule
- 1.10% ✓
- Cap rate
- 6.21%
- Cash-on-cash
- -0.31%
- DSCR
- 0.99
- GRM
- 7.6
CMA / ARV
- ARV (median comp)
- $262,592
- List price
- $175,000
- Delta
- -33.36%
- Verdict
- UNDERPRICED
- Comps
- 20 within 1.0 mi
Show comp detail 12 sales within ~0.75 mi
| Address | Dist | Beds/Ba | Sqft | Sold | Price | $/sf | Match |
|---|---|---|---|---|---|---|---|
| 136 Kettering Dr | 0.01mi | 3/1.5 | 1,023 (-3%) | 2mo | $229,900 | $225 | 91 |
| 244 Kettering Dr | 0.22mi | 3/1.0 | 1,056 (0%) | 2mo | $170,000 | $161 | 88 |
| 15 Kelvin Dr | 0.23mi | 3/1.0 | 1,076 (+2%) | 0mo | $93,000 | $86 | 86 |
| 51 Conant Dr | 0.19mi | 3/1.0 | 1,097 (+4%) | 2mo | $225,000 | $205 | 83 |
| 337 Claremont Ave | 0.37mi | 3/1.0 | 1,049 (-1%) | 4mo | $181,383 | $173 | 78 |
| 328 Wendel Ave | 0.36mi | 3/1.0 | 1,049 (-1%) | 4mo | $150,000 | $143 | 78 |
| 624 Moore Ave | 0.45mi | 3/1.5 | 1,103 (+4%) | 0mo | $285,000 | $258 | 69 |
| 141 Midland Ave | 0.74mi | 3/1.5 | 1,040 (-2%) | 4mo | $275,000 | $264 | 58 |
| 652 Moore Ave | 0.42mi | 3/1.5 | 1,182 (+12%) | 2mo | $265,000 | $224 | 57 |
| 450 University Ave | 0.47mi | 2/1.0 (-1) | 966 (-8%) | 4mo | $230,000 | $238 | 55 |
| 204 Lyndale Ave | 0.49mi | 4/1.0 (+1) | 1,176 (+11%) | 1mo | $268,204 | $228 | 52 |
| 215 Fairfield Ave | 0.72mi | 3/1.5 | 985 (-7%) | 2mo | $265,000 | $269 | 51 |
Match score weights: distance 35% · size 25% · config 20% · recency 20%. Top-matched comps best support the ARV.
Projected returns pro-forma
-3.0% appreciation · 3.0% rent growth · sell at horizon
- IRR
- -16.6%
- Equity multiple
- 0.41×
- Total profit
- $-28,921
- Equity at exit
- $26,093
- IRR
- -8.2%
- Equity multiple
- 0.48×
- Total profit
- $-25,268
- Equity at exit
- $15,131
Cash invested: $49,000 (down + closing). Projections, not guarantees.
Landlord ↔ Tenant lean methodology
- Overall (STATE)
- 15 Strongly Tenant-Friendly
- State New York
- 15 Strongly Tenant-Friendly · D+10
- County
- — inherits STATE
- City
- — inherits STATE
ZIP-level market 14223
- Active inventory
- 119
- Price-to-rent
- 7.6×
Monthly cashflow live
- Estimated rent
- $1,930 high interval (Pro) →
- Mortgage (P&I)
- −$918
- Tax from tax record
- −$547 /mo · $6,562/yr
- Insurance
- −$73
- HOA
- −$0
- Vacancy / Maint / Mgmt
- −$405
- Net cashflow
- $-12
Break-even live
Sensitivity live
| Price | -10% $87 | -5% $37 | +0% $-12 | +5% $-62 | +10% $-112 |
|---|---|---|---|---|---|
| Rent | -10% $-165 | -5% $-89 | +0% $-12 | +5% $64 | +10% $140 |
| Rate | -1.0pp $76 | -0.5pp $32 | base $-12 | +0.5pp $-58 | +1.0pp $-104 |
UW: 25.0% down · 7.5% · 30yr · 1.5% tax · 5.0% vac · 8.0% maint · 8.0% mgmt
Financing live
Cash to close
- Down payment
- $43,750
- Closing costs
- $5,250
- Reserves months
- —
- Total cash needed
- —
Loan-product check · same deal, 3 products live
Conventional
25% down · 7.5% · 30yr
- Down + closing
- —
- Monthly P&I
- —
- Monthly cashflow
- —
- DSCR
- —
- Eligible?
- —
Personal DTI + credit; lowest rate.
DSCR
20% down · 8.5% · 30yr
- Down + closing
- —
- Monthly P&I
- —
- Monthly cashflow
- —
- DSCR
- —
- Eligible?
- —
No personal income docs; deal must DSCR.
Hard money
10% down · 12.0% · 12mo
- Down + closing
- —
- Monthly P&I
- —
- Monthly cashflow
- —
- DSCR
- —
- Eligible?
- —
Short-term bridge; refi at stabilization.
Rent comps 16 comps
| Address | Beds | Baths | Sqft | Rent | $/sqft | DOM | Units | Dist |
|---|---|---|---|---|---|---|---|---|
| 348 Capen Blvd Buffalo, NY | 3.0 | 1.5 | 1424 | $2,200 | $1.54 | 2d | 1 | 0.41mi |
| 151 Lamson Rd Buffalo, NY | 4.0 | 2.0 | 1382 | $2,350 | $1.70 | 17d | 1 | 0.71mi |
| 33 Tillotson Pl Buffalo, NY | 3.0 | 1.0 | 1143 | $2,095 | $1.83 | 15d | 1 | 0.96mi |
| 626 Englewood Ave Buffalo, NY | 2.0 | 1.0 | 850 | $1,550 | $1.82 | 2d | 1 | 1.02mi |
| 4765 N Bailey Ave Buffalo, NY | 2.0 | 1.0 | 900 | $2,100 | $2.33 | 44d | 1 | 1.13mi |
| 780 Millersport Hwy Unit 1 Buffalo, NY | 2.0 | 1.0 | 850 | $1,395 | $1.64 | 44d | 1 | 1.13mi |
| 627 Kenmore Ave Buffalo, NY | 2.0 | 1.0 | 1000 | $1,250 | $1.25 | 24d | 1 | 1.18mi |
| 60 Englewood Ave Buffalo, NY | 4.0 | 1.0 | 1400 | $1,650 | $1.18 | 2d | 1 | 1.19mi |
| 182 Woodcrest Dr Amherst, NY | 3.0 | 1.5 | 1380 | $2,300 | $1.67 | 19d | 1 | 1.23mi |
| 2 Angle St Buffalo, NY | 2.0 | 1.0 | 725 | $1,212 | $1.67 | 15d | 2 | 1.30mi |
| 212 Dellwood Rd Buffalo, NY | 4.0 | 4.0 | 1209 | $3,400 | $2.81 | 2d | 2 | 1.35mi |
| 1257 Brighton Rd Tonawanda, NY | 4.0 | 1.0 | 1268 | $2,500 | $1.97 | 4d | 1 | 1.37mi |
| 1257 Brighton Rd Tonawanda, NY | 4.0 | 1.0 | 1268 | $2,500 | $1.97 | 16d | 1 | 1.37mi |
| 163 Carmel Rd Buffalo, NY | 3.0 | 1.0 | 1400 | $1,800 | $1.29 | 3d | 1 | 1.45mi |
| 26 Custer St Buffalo, NY | 2.0 | 1.0 | 1000 | $1,300 | $1.30 | 44d | 1 | 1.46mi |
| 63 Garnet Rd Buffalo, NY | 2.0 | 1.0 | 800 | $1,350 | $1.69 | 44d | 1 | 1.48mi |
Listing history 1 events
-
2026-05-11$175,000 Active 1007-char remark
ⓘ Source: listings_history table (triggers on properties + properties_extension) + one-shot
backfill from property_details.listing_events for pre-trigger history.
Tax reassessment forecast NY · Partial reset (capped growth)
- Current annual tax
- $6,562 · $547/mo
- Projected year-2 tax
- $6,562 · $547/mo
- Expected delta
- $0/yr ($0/mo · 0.0%)
ⓘ Screening estimate from a state-policy table — verify with the county assessor before closing.
Climate risk First Street
- Flood 1/10 Low FEMA zone X (unshaded) · 0% chance over 30 yrs
- Wildfire 1/10 Low
- Heat 3/10 Moderate 7 d/yr ≥92°F today · 15 d/yr by 30 yrs out
- Wind 1/10 Low
- Air quality 3/10 Moderate 2 unhealthy d/yr today · 3 by 30 yrs out
Nearby sold comps map
Loading sold comps map…
Walkable amenities ~0.75 mi
Loading nearby amenities…
Taxation est. · year 1
- Rental income
- $23,165
- − Mortgage interest
- −$9,803
- − Property taxes
- −$6,562
- − Insurance
- −$875
- − Repairs & maintenance
- −$1,853
- − Management
- −$1,853
- − Depreciation
- −$5,091
- Taxable loss
- −$2,872
- Est. tax savings @ 24.0%
- +$689
- After-tax cash flow
- $540/yr
For passive investors: Depreciation is non-cash, so a rental often shows a tax loss while cash-flowing — sheltering income. Rental losses are passive: they offset passive income freely, and up to $25,000/yr can offset ordinary (W-2) income if you actively participate and your MAGI is under $100k (phasing out to $0 by $150k); unused losses carry forward. On sale, claimed depreciation is recaptured at up to 25%, and gains may owe capital-gains tax (a 1031 exchange can defer both). Figures are a year-1 estimate at your 24.0% rate — not tax advice; consult a CPA.
Schools (NCES district)
- District
- Kenmore-Tonawanda Union Free School District
- NCES district ID
- 3616230
- Math proficiency
- 44% ▼ -12.00%
- Reading proficiency
- 47% ▼ -1.00%
- Median HH income
- $51,433
- Composite
- 39.18/100
- National rank
- #4024
- State rank
- #453 of 590 in NY
Livability — Tonawanda Town
No livability data for this city. (Only ~50 U.S. cities are tracked.)
Census & demographics
- Census place
- Tonawanda Town, NY
- County
- Erie County · 714,559 people
- City population
- 63,948
- Metro
- Buffalo-Cheektowaga, NY
- Population (ZIP)
- 22,611
- Household income
- $84,161
- Rent vs Own
- Severe rent burden
- 368.0
Population outlook (Erie County) Hauer SSP2
- Today (2025)
- 933,037 people
- By 2030
- 935,181 · +0.2%
- By 2040
- 928,531 · -0.5%
- By 2050
- 905,725 · -2.9%
- By 2075
- 834,037 · -10.6%
- By 2100
- 708,033 · -24.1%
Race, ethnicity, and origin ACS 2023
- Neighborhood character
- Predominantly White (84%)
- Race & ethnicity
- White 84% Asian 5% Two or more races 4% Black 4% Hispanic / Latino 3%
- Common ancestry
- Romanian 12% Slovak 2% Lithuanian 2%
- Foreign-born
- 7% · Canada, Vietnam, India
- Languages at home
- 92% English-only · Other Indo-European 3% French/Haitian/Cajun 1% Arabic 1%
Political lean MEDSL · Erie
- 2024 margin
- Lean D (+9.7) · D 54.8% · R 45.2%
- 2008→2024 swing
- -7.9pp toward R · 2008: 17.5pp · 2024: 9.7pp
- All cycles
- 2024: D+9.7 2020: D+14.7 2016: D+4.8 2012: D+15.6 2008: D+17.5
Not yet ingested
- Civics
- —
Market trends
- HPI YoY
- ▼ -245.18%
- Current HPI
- 320.9379
- Rent YoY
- —
- Metro
- Buffalo-Cheektowaga, NY
- State GDP YoY
- ▲ 2.60%
- F500 in state
- 92
Industry mix (Fortune 500 HQ in NY)
| Industry | F500 HQs | Revenue |
|---|---|---|
| Financial Services | 10 | $950B |
|
||
| Consumer Goods | 9 | $162B |
|
||
| Insurance | 4 | $225B |
|
||
| Telecommunications | 2 | $144B |
|
||
| Pharmaceuticals | 2 | $112B |
|
||
| Media / Entertainment | 2 | $69B |
|
||
Price history
2 events — show timeline
- 2026-05-21 Pending — WNYREIS
- 2026-05-11 Listed $175,000 WNYREIS
Property tax history
+9.0%/yrLatest (2025): $6,562 · +3.9% YoY. Source: county tax records.
Cash-flow waterfall
monthlySold comps — $/sqft
last 12 mo · ≤1 miLoading sold comps…