1719 6th St · Rensselaer, NY
Flood risk 1/10 · Minimal
- FEMA flood zone
- X
- Chance of flooding over 30 yrs
- 0.0%
- Est. flood insurance / yr
- $473 – $860
Fire risk 3/10 · Minor
- Est. fire insurance / yr
- $691 – $1,283
Heat risk 4/10 · Minor
- Hot days now (above 97°F)
- 7 days/yr
- Hot days in 30 yrs
- 16 days/yr
Wind risk 3/10 · Minor
- Chance of severe wind over 30 yrs
- 6.0%
Air-quality risk 2/10 · Minimal
- Unhealthy air days now
- 0 days/yr
- Unhealthy air days in 30 yrs
- 1 days/yr
Risk factors via First Street. Map © Google.
Why this score? — see what drove the D+ grade
The composite is a weighted blend of 9 inputs, each scored 0–100. Each bar is that input's sub-score; the figure is the points it added to the 100-point composite (weight × sub-score).
- Cash flow +15.1/30.0
- ARV discount +14.1/15.0
- DSCR +4.6/10.0
- 1% rule +4.3/10.0
- Livability +3.9/5.0
- Rent growth +2.7/5.0
- Schools +2.7/10.0
- Condition / age +2.5/5.0
- Appreciation +0.0/10.0
$225,000
🖨 Deal sheet 📄 Offer letter ✓ Due diligence
Listing remarks
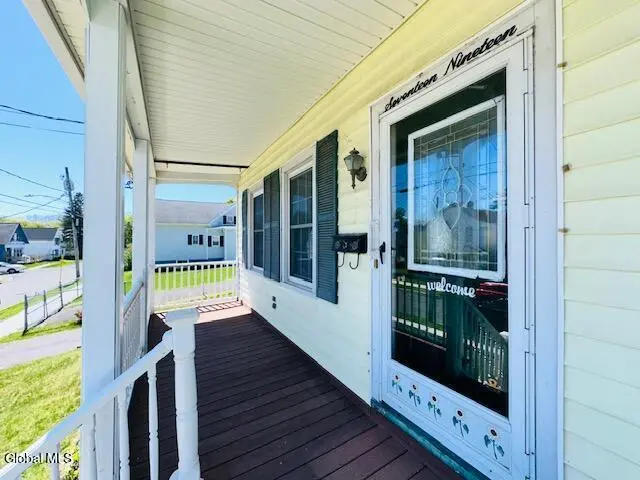
Welcome home to this beautifully maintained property that perfectly blends charm, functionality, and flexible living space. A welcoming covered front porch sets the tone, offering the perfect spot to relax and unwind. Inside, you'll find gleaming hardwood floors and a thoughtfully designed layout. The first floor features a versatile bedroom or flex space--ideal for a home office, playroom, or guest room--along with a formal dining room perfect for entertaining. A convenient half bath completes the main level. Upstairs and beyond, the home continues to impress with its excellent condition and meticulous upkeep over the years. The full, dry basement provides ample storage and laundry room. S
Key facts
- Covered front porch
- Half bath
- Formal dining room
Tags
Property features AI
Exterior
- Parking: Detached garage with storage and garage door opener; Total of 5 parking spaces (including garage)
- Utilities: Public water; Public sewer; Cable connected
- Home design: Single family residence; Facing information not provided
- Construction: Vinyl siding; Asphalt roof
- Exterior features: Covered front porch; Paved driveway; Outdoor lighting; Chain link fencing around backyard; Shed
Interior
- Kitchen: Dishwasher; Microwave; Oven; Range; Refrigerator
- Bedrooms: First-floor bedroom; Second-floor bedroom; Second-floor bedroom; Second-floor bedroom
- Flooring: Hardwood; Parquet
- Bathrooms: One full bathroom (second level); One half bathroom (first level)
- Heating & cooling: Hot water heating (natural gas); Window air conditioning units
- Interior features: High-speed internet; Central vacuum; Crown molding; Full basement
- Laundry & utility: Washer and dryer included; Laundry room in basement
Neighborhood map
What this means for you Summary
Snapshot
- This is a 3-bed/1.5-bath single-family listed at $225k.
Deal economics
- At list price, monthly cash flow is $76 ($914/yr) — positive.
- The deal already cash-flows at list — no discount required.
- To meet the 1% rule (rent ≥ 1% of price), the offer needs to be $209k (7.3% below list).
- Recommended offer: $209k (7.3% below list) — sets the bar for 1% rule.
- Cap rate 6.7% vs local median 5.0% in Rensselaer — top-decile yield for the area; either an underpriced asset or a hidden risk that comps aren't pricing in. Stress-test before assuming the spread holds.
Location & tenants
- Location reads 77/100 on livability (#191 in NY, #2,967 nationally) — a middle-class / working-renter tenant base. Strengths: commute A+, housing A+, health & safety A+; Watch: schools C-, crime D+.
- Rensselaer City School District (suburban): math 28% / reading 34% proficiency, ranked #574 of 590 in NY (top 97%) — families likely to look elsewhere, expect single-tenant / working-renter base with shorter leases.
- Market conditions: Rents flat; 102 active listings in the ZIP; 23 comparable units currently listed for rent nearby; rentals at typical pace (median 14d on market — plan ~3-4 weeks tenant-placement turnaround); solid renter incomes; 405 units permitted in Rensselaer County in 2024 (224 in 5+ unit buildings).
Forward outlook
- Local home prices are declining (-3.0%/yr); year-one equity from $2k of loan paydown is wiped out by about $7k of value loss. Plan a longer hold.
- Rensselaer County population projected to shrink 6% by 2050 — rents likely to lag national; underwrite the cash flow, not the appreciation.
Negotiation context
- Only 4 days on market — expect competitive offers; lowballing is unlikely to land.
Risks & watch-outs
- Watch-outs: built in 1909 — expect roof / HVAC / electrical / plumbing capex.
Questions for the listing agent
- Built in 1909 — when were the roof, HVAC, electrical panel, plumbing, and water heater last replaced?
- Is there a deadline driving the sale (1031 exchange, divorce, estate, relocation)? That informs how much negotiation room exists.
- Crime grade is D in this area — have there been break-ins, vandalism, or insurance claims at this property in the last 3 years? What carrier currently insures it and at what premium?
- The area grade is low — what's the realistic commute time and amenity access for the typical tenant pool here? Any planned neighborhood developments (good or bad) we should know about?
- What's the average days-on-market for RENTAL listings here right now (not sales)? A rising rental-DOM trend means longer vacancies and softer asking-rent achievability than the comps imply.
- What's the recent tenant-quality profile in this submarket — average credit score on applications, eviction rate, late-payment / NSF rate, and stable-employment percentage? A property-management company in the area should have these aggregated.
- How much new for-sale + rental construction is in the pipeline within 1–3 miles? Heavy new supply typically softens prices + rents 12–24 months out; constrained supply supports both.
Investment metrics
- 1% rule
- 0.93% ✗
- Cap rate
- 6.70%
- Cash-on-cash
- 1.45%
- DSCR
- 1.06
- GRM
- 9.0
CMA / ARV
- ARV (median comp)
- $263,889
- List price
- $225,000
- Delta
- -14.74%
- Verdict
- UNDERPRICED
- Comps
- 20 within 1.0 mi
Show comp detail 12 sales within ~0.75 mi
| Address | Dist | Beds/Ba | Sqft | Sold | Price | $/sf | Match |
|---|---|---|---|---|---|---|---|
| 47 Chestnut St | 0.07mi | 3/2.0 | 1,512 (+4%) | 4mo | $218,200 | $144 | 85 |
| 1827 8th St | 0.13mi | 3/2.5 | 1,569 (+8%) | 0mo | $280,000 | $178 | 76 |
| 12 Chestnut St | 0.07mi | 4/2.0 (+1) | 1,550 (+6%) | 5mo | $239,000 | $154 | 74 |
| 1936 9th St | 0.24mi | 3/1.5 | 1,553 (+7%) | 6mo | $280,000 | $180 | 73 |
| 1484 3rd St | 0.28mi | 2/1.5 (-1) | 1,322 (-9%) | 2mo | $125,000 | $95 | 65 |
| 113 Washington Ave | 0.14mi | 2/1.5 (-1) | 1,660 (+14%) | 2mo | $290,000 | $175 | 63 |
| 1512 Broadway | 0.34mi | 3/1.0 | 1,272 (-13%) | 1mo | $215,000 | $169 | 61 |
| 1309 2nd St | 0.51mi | 3/1.0 | 1,540 (+6%) | 5mo | $240,000 | $156 | 60 |
| 38 Farley Dr | 0.55mi | 4/1.5 (+1) | 1,494 (+3%) | 8mo | $333,000 | $223 | 58 |
| 941 6th St St | 0.73mi | 3/1.5 | 1,380 (-5%) | 4mo | $157,000 | $114 | 54 |
| 1140 Broadway | 0.65mi | 3/2.5 | 1,520 (+4%) | 9mo | $160,000 | $105 | 51 |
| 36 Farley Dr | 0.55mi | 3/1.5 | 1,662 (+14%) | 6mo | $330,000 | $199 | 45 |
Match score weights: distance 35% · size 25% · config 20% · recency 20%. Top-matched comps best support the ARV.
Projected returns pro-forma
-3.0% appreciation · 0.9% rent growth · sell at horizon
- IRR
- -16.4%
- Equity multiple
- 0.43×
- Total profit
- $-35,884
- Equity at exit
- $33,548
- IRR
- -12.4%
- Equity multiple
- 0.34×
- Total profit
- $-41,811
- Equity at exit
- $19,454
Cash invested: $63,000 (down + closing). Projections, not guarantees.
Landlord ↔ Tenant lean methodology
- Overall (STATE)
- 15 Strongly Tenant-Friendly
- State New York
- 15 Strongly Tenant-Friendly · D+10
- County
- — inherits STATE
- City
- — inherits STATE
ZIP-level market 12144
- Home prices YoY
- -33.4%
- Rents YoY
- 0.9%
- Active inventory
- 102
- Price-to-rent
- 9.0×
Monthly cashflow live
- Estimated rent
- $2,085 high interval (Pro) →
- Mortgage (P&I)
- −$1,180
- Tax from tax record
- −$297 /mo · $3,568/yr
- Insurance
- −$94
- HOA
- −$0
- Vacancy / Maint / Mgmt
- −$438
- Net cashflow
- $76
Break-even live
UW: 25.0% down · 7.5% · 30yr · 1.5% tax · 5.0% vac · 8.0% maint · 8.0% mgmt
Financing live
Cash to close
- Down payment
- $56,250
- Closing costs
- $6,750
- Reserves months
- —
- Total cash needed
- —
Loan-product check · same deal, 3 products live
Conventional
25% down · 7.5% · 30yr
- Down + closing
- —
- Monthly P&I
- —
- Monthly cashflow
- —
- DSCR
- —
- Eligible?
- —
Personal DTI + credit; lowest rate.
DSCR
20% down · 8.5% · 30yr
- Down + closing
- —
- Monthly P&I
- —
- Monthly cashflow
- —
- DSCR
- —
- Eligible?
- —
No personal income docs; deal must DSCR.
Hard money
10% down · 12.0% · 12mo
- Down + closing
- —
- Monthly P&I
- —
- Monthly cashflow
- —
- DSCR
- —
- Eligible?
- —
Short-term bridge; refi at stabilization.
Rent comps 23 comps
| Address | Beds | Baths | Sqft | Rent | $/sqft | DOM | Units | Dist |
|---|---|---|---|---|---|---|---|---|
| 1444 2nd St Unit 2 Rensselaer, NY | 4.0 | 1.0 | 950 | $1,900 | $2.00 | 43d | 1 | 0.38mi |
| 1311 Broadway Rensselaer, NY | 2.0 | 1.0 | 1014 | $1,650 | $1.63 | 14d | 1 | 0.60mi |
| 1307 Broadway Rensselaer, NY | 2.0 | 1.0 | 1014 | $1,650 | $1.63 | 14d | 1 | 0.60mi |
| 1047 Broadway Rensselaer, NY | 2.0 | 1.0 | 1014 | $1,650 | $1.63 | 14d | 1 | 0.76mi |
| 945 Broadway Rensselaer, NY | 3.0 | 1.0 | 1200 | $1,650 | $1.38 | 23d | 1 | 0.82mi |
| 25 Harrison Ave Rensselaer, NY | 2.0 | 1.0 | 1400 | $1,745 | $1.25 | 18d | 1 | 0.84mi |
| 883 Broadway Apt 103 Albany, NY | 2.0 | 1.0 | 1155 | $1,785 | $1.55 | 23d | 1 | 0.89mi |
| 883 Broadway Apt 201 Albany, NY | 2.0 | 1.0 | 980 | $1,450 | $1.48 | 23d | 1 | 0.89mi |
| 2 River Chase Rensselaer, NY | 1.0–3.0 | 1.0–2.0 | 1348 | $2,615 | $1.94 | 14d | 34 | 1.05mi |
| 100 New Broadway Rensselaer, NY | 2.0 | 2.0 | 1248 | $2,212 | $1.77 | 14d | 2 | 1.09mi |
| 99 New Broadway Rensselaer, NY | 2.0 | 1.0–2.0 | 946 | $2,495 | $2.64 | 14d | 5 | 1.13mi |
| 33 Centre St Apt 2A Albany, NY | 2.0 | 1.0 | 975 | $1,875 | $1.92 | 43d | 1 | 1.15mi |
| 33 Centre St Apt 3A Albany, NY | 2.0 | 1.0 | 975 | $1,925 | $1.97 | 21d | 1 | 1.15mi |
| 33 Centre St Apt 1A Albany, NY | 2.0 | 1.0 | 885 | $1,825 | $2.06 | 14d | 1 | 1.15mi |
| 33 Centre St Apt 2D Albany, NY | 2.0 | 1.0 | 1000 | $1,900 | $1.90 | 43d | 1 | 1.15mi |
| 9 St Josephs Ter Albany, NY | 3.0 | 2.0 | 1000 | $1,850 | $1.85 | 43d | 1 | 1.23mi |
| 32 1st St Albany, NY | 4.0 | 1.5 | 1773 | $1,850 | $1.04 | 43d | 1 | 1.25mi |
| 48 N Pearl St Albany, NY | 2.0 | 1.0–2.5 | 1251 | $3,500 | $2.80 | 14d | 17 | 1.28mi |
| 7 Elm Ct Rensselaer, NY | 1.0–2.0 | 1.0–2.0 | 829 | $1,830 | $2.21 | 14d | 1 | 1.31mi |
| 10 Van Allen Way Rensselaer, NY | 1.0–3.0 | 1.0–2.0 | 1153 | $2,500 | $2.17 | 14d | 1 | 1.31mi |
| 624 N Pearl St Unit 1st floor Albany, NY | 4.0 | 2.0 | 1800 | $1,950 | $1.08 | 14d | 1 | 1.34mi |
| 628 N Pearl St Menands, NY | 3.0 | 1.0 | 1088 | $1,500 | $1.38 | 43d | 1 | 1.35mi |
| 1 Broadway Menands, NY | 2.0 | 1.0–2.0 | 1017 | $3,125 | $3.07 | 14d | 5 | 1.43mi |
Listing history 2 events
-
2026-05-02status Pending 1142-char remark
-
2026-04-27$225,000 Active 1142-char remark
ⓘ Source: listings_history table (triggers on properties + properties_extension) + one-shot
backfill from property_details.listing_events for pre-trigger history.
Tax reassessment forecast NY · Partial reset (capped growth)
- Current annual tax
- $3,568 · $297/mo
- Projected year-2 tax
- $3,685 · $307/mo
- Expected delta
- +$117/yr (+$10/mo · 3.3%)
ⓘ Screening estimate from a state-policy table — verify with the county assessor before closing.
Climate risk First Street
- Flood 1/10 Low FEMA zone X · 0% chance over 30 yrs
- Wildfire 3/10 Moderate
- Heat 4/10 Moderate 7 d/yr ≥97°F today · 16 d/yr by 30 yrs out
- Wind 3/10 Moderate 6% chance of damaging wind over 30 yrs
- Air quality 2/10 Low 0 unhealthy d/yr today · 1 by 30 yrs out
Nearby sold comps map
Loading sold comps map…
Walkable amenities ~0.75 mi
Loading nearby amenities…
Taxation est. · year 1
- Rental income
- $25,021
- − Mortgage interest
- −$12,603
- − Property taxes
- −$3,568
- − Insurance
- −$1,125
- − Repairs & maintenance
- −$2,002
- − Management
- −$2,002
- − Depreciation
- −$6,545
- Taxable loss
- −$2,825
- Est. tax savings @ 24.0%
- +$678
- After-tax cash flow
- $1,592/yr
For passive investors: Depreciation is non-cash, so a rental often shows a tax loss while cash-flowing — sheltering income. Rental losses are passive: they offset passive income freely, and up to $25,000/yr can offset ordinary (W-2) income if you actively participate and your MAGI is under $100k (phasing out to $0 by $150k); unused losses carry forward. On sale, claimed depreciation is recaptured at up to 25%, and gains may owe capital-gains tax (a 1031 exchange can defer both). Figures are a year-1 estimate at your 24.0% rate — not tax advice; consult a CPA.
Schools (NCES district)
- District
- Rensselaer City School District
- NCES district ID
- 3624450
- Math proficiency
- 28% ▼ -2.00%
- Reading proficiency
- 34% ▼ -1.00%
- Median HH income
- $48,665
- Composite
- 26.89/100
- National rank
- #7096
- State rank
- #574 of 590 in NY
Livability — Rensselaer
- Score
- 77/100
- State rank
- #191
- US rank
- #2967
Category grades
Schools grade is shown separately in the Schools card above.
Census & demographics
- Census place
- Rensselaer, NY
- County
- Rensselaer County · 75,590 people
- City population
- 22,111
- Metro
- Albany-Schenectady-Troy, NY
- Population (ZIP)
- 22,111
- Household income
- $90,738
- Rent vs Own
- Severe rent burden
- 541.0
Population outlook (Rensselaer County) Hauer SSP2
- Today (2025)
- 162,400 people
- By 2030
- 161,746 · -0.4%
- By 2040
- 158,095 · -2.7%
- By 2050
- 152,966 · -5.8%
- By 2075
- 140,767 · -13.3%
- By 2100
- 124,727 · -23.2%
Race, ethnicity, and origin ACS 2023
- Neighborhood character
- Predominantly White (76%)
- Race & ethnicity
- White 76% Two or more races 8% Asian 7% Hispanic / Latino 6% Black 6%
- Hispanic origin (detail)
- Puerto Rican 4%
- Common ancestry
- Romanian 7% Lithuanian 6% Iranian 3%
- Foreign-born
- 7% · Philippines, Canada, China
- Languages at home
- 91% English-only · Other Asian/Pacific 3% Spanish 2% Chinese 1%
Political lean MEDSL · Rensselaer
- 2024 margin
- Toss-up / Even · D 50.7% · R 49.3%
- 2008→2024 swing
- -8.0pp toward R · 2008: 9.3pp · 2024: 1.4pp
- All cycles
- 2024: D+1.4 2020: D+5.6 2016: R+2.9 2012: D+11.8 2008: D+9.3
Not yet ingested
- Civics
- —
Market trends
- HPI YoY
- ▼ -138.26%
- Current HPI
- 276.2239
- Rent YoY
- ▲ 0.90%
- Metro
- Albany-Schenectady-Troy, NY
- State GDP YoY
- ▲ 2.60%
- F500 in state
- 92
Industry mix (Fortune 500 HQ in NY)
| Industry | F500 HQs | Revenue |
|---|---|---|
| Financial Services | 10 | $950B |
|
||
| Consumer Goods | 9 | $162B |
|
||
| Insurance | 4 | $225B |
|
||
| Telecommunications | 2 | $144B |
|
||
| Pharmaceuticals | 2 | $112B |
|
||
| Media / Entertainment | 2 | $69B |
|
||
Price history
2 events — show timeline
- 2026-05-02 Pending — Global MLS
- 2026-04-27 Listed $225,000 Global MLS
Property tax history
+22.4%/yrLatest (2025): $3,568 · +1.1% YoY. Source: county tax records.
Cash-flow waterfall
monthlySold comps — $/sqft
last 12 mo · ≤1 miLoading sold comps…