 Multi-family
12065 S State Rd 17 · Donaldson, IN
Flood risk 1/10 · Minimal
- FEMA flood zone
- X (unshaded)
- Chance of flooding over 30 yrs
- 0.0%
- Est. flood insurance / yr
- $507 – $1,088
Fire risk 2/10 · Minimal
- Est. fire insurance / yr
- $717 – $1,331
Heat risk 2/10 · Minimal
- Hot days now (above 101°F)
- 7 days/yr
- Hot days in 30 yrs
- 16 days/yr
Wind risk 2/10 · Minimal
- Chance of severe wind over 30 yrs
- —
Air-quality risk 2/10 · Minimal
- Unhealthy air days now
- 1 days/yr
- Unhealthy air days in 30 yrs
- 1 days/yr
Risk factors via First Street. Map © Google.
Why this score? — see what drove the D grade
The composite is a weighted blend of 9 inputs, each scored 0–100. Each bar is that input's sub-score; the figure is the points it added to the 100-point composite (weight × sub-score).
- Cash flow +15.5/30.0
- ARV discount +7.5/15.0
- DSCR +4.8/10.0
- 1% rule +3.5/10.0
- Schools +3.2/10.0
- Rent growth +2.5/5.0
- Livability +2.5/5.0
- Condition / age +2.5/5.0
- Appreciation +0.0/10.0
$165,000
🖨 Deal sheet 📄 Offer letter ✓ Due diligence
Multi-family units
County records classify this as Multi-Family (2-4 Unit). Listing-text estimate: 1 unit. estimate disagrees with records
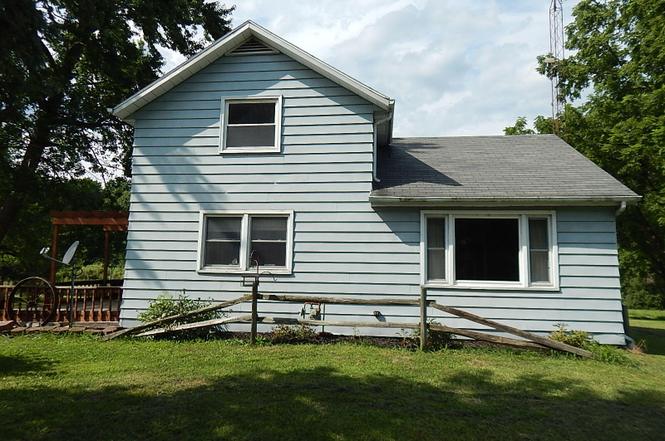
Listing remarks
Loads of potential in this rural 3 bedroom 1 bath farm house sitting on 4 lush acres right on SR 17 near Lake Latonka. Vinyl replacement windows installed. Expansive 16'x12' wooden deck off of the dining room to enjoy the county life. Centrally located between Plymouth and Culver to take advantage of all that Marshall County has to offer. Additional well and septic on property from a trailer that was removed. Also a brand new septic tank for the house is in the back yard that will go with the property. This home is being offered through an estate. All offers welcomed.
Key facts
- 16x12 wooden deck
- Rural farm house
- 4 lush acres
Tags
Neighborhood map
What this means for you Summary
Snapshot
- This is a 3-bed/1.0-bath multifamily listed at $165k.
Deal economics
- At list price, monthly cash flow is $65 ($781/yr) — positive.
- The deal already cash-flows at list — no discount required.
- To meet the 1% rule (rent ≥ 1% of price), the offer needs to be $140k (14.8% below list).
- Recommended offer: $140k (14.8% below list) — sets the bar for 1% rule.
Location & tenants
- Location reads: area grade D — affects rentability + tenant quality, not the cash-flow math above.
- Plymouth Community School Corporation (town): math 33% / reading 41% proficiency, ranked #173 of 301 in IN (top 58%) — families likely to look elsewhere, expect single-tenant / working-renter base with shorter leases.
- Market conditions: 82 active listings in the ZIP; 147 units permitted in Marshall County in 2024 (0 in 5+ unit buildings).
Forward outlook
- Local home prices are declining (-3.0%/yr); year-one equity from $1k of loan paydown is wiped out by about $5k of value loss. Plan a longer hold.
- Marshall County population projected to shrink 9% by 2050 — rents likely to lag national; underwrite the cash flow, not the appreciation.
Negotiation context
- It's been on market 233 days — a 12% lower offer ($145k) is reasonable based on typical stale-listing flexibility.
Risks & watch-outs
- Watch-outs: built in 1920 — expect roof / HVAC / electrical / plumbing capex.
Questions for the listing agent
- It's been on market 233 days. Have you received any prior offers? Is the seller open to a 15% concession, seller financing, or rate buy-down credit?
- Built in 1920 — when were the roof, HVAC, electrical panel, plumbing, and water heater last replaced?
- Why hasn't it sold? Are there any deal-killer items the seller is aware of (foundation, flood, title, zoning, code violations)?
- Is there a deadline driving the sale (1031 exchange, divorce, estate, relocation)? That informs how much negotiation room exists.
- The area grade is low — what's the realistic commute time and amenity access for the typical tenant pool here? Any planned neighborhood developments (good or bad) we should know about?
- What's the average days-on-market for RENTAL listings here right now (not sales)? A rising rental-DOM trend means longer vacancies and softer asking-rent achievability than the comps imply.
- What's the recent tenant-quality profile in this submarket — average credit score on applications, eviction rate, late-payment / NSF rate, and stable-employment percentage? A property-management company in the area should have these aggregated.
- How much new apartment / multifamily construction is in the pipeline within 1–3 miles? Heavy new supply (>2% of stock underway) typically softens rents 12–24 months out; light construction supports rent growth.
Investment metrics
- 1% rule
- 0.85% ✗
- Cap rate
- 6.77%
- Cash-on-cash
- 1.69%
- DSCR
- 1.08
- GRM
- 9.8
CMA / ARV
No comps found within radius.
Projected returns pro-forma
-3.0% appreciation · 3.0% rent growth · sell at horizon
- IRR
- -13.6%
- Equity multiple
- 0.51×
- Total profit
- $-22,627
- Equity at exit
- $24,602
- IRR
- -4.8%
- Equity multiple
- 0.69×
- Total profit
- $-14,514
- Equity at exit
- $14,266
Cash invested: $46,200 (down + closing). Projections, not guarantees.
Landlord ↔ Tenant lean methodology
- Overall (STATE)
- 90 Strongly Landlord-Friendly
- State Indiana
- 90 Strongly Landlord-Friendly · R+11
- County
- — inherits STATE
- City
- — inherits STATE
ZIP-level market 46563
- Home prices YoY
- -27.7%
- Active inventory
- 82
- Price-to-rent
- 9.8×
Monthly cashflow live
- Estimated rent
- $1,405 medium interval (Pro) →
- Mortgage (P&I)
- −$865
- Tax from tax record
- −$111 /mo · $1,330/yr
- Insurance
- −$69
- HOA
- −$0
- Vacancy / Maint / Mgmt
- −$295
- Net cashflow
- $65
Break-even live
UW: 25.0% down · 7.5% · 30yr · 1.5% tax · 5.0% vac · 8.0% maint · 8.0% mgmt
Financing live
Cash to close
- Down payment
- $41,250
- Closing costs
- $4,950
- Reserves months
- —
- Total cash needed
- —
Loan-product check · same deal, 3 products live
Conventional
25% down · 7.5% · 30yr
- Down + closing
- —
- Monthly P&I
- —
- Monthly cashflow
- —
- DSCR
- —
- Eligible?
- —
Personal DTI + credit; lowest rate.
DSCR
20% down · 8.5% · 30yr
- Down + closing
- —
- Monthly P&I
- —
- Monthly cashflow
- —
- DSCR
- —
- Eligible?
- —
No personal income docs; deal must DSCR.
Hard money
10% down · 12.0% · 12mo
- Down + closing
- —
- Monthly P&I
- —
- Monthly cashflow
- —
- DSCR
- —
- Eligible?
- —
Short-term bridge; refi at stabilization.
Listing history 5 events
-
2026-03-27status Pending
-
2026-01-24price $165,000
-
2025-10-03price $177,000
-
2025-08-26price $180,000
-
2025-08-06$185,000 Active
ⓘ Source: listings_history table (triggers on properties + properties_extension) + one-shot
backfill from property_details.listing_events for pre-trigger history.
Tax reassessment forecast IN · Partial reset (capped growth)
- Current annual tax
- $1,330 · $111/mo
- Projected year-2 tax
- $1,366 · $114/mo
- Expected delta
- +$36/yr (+$3/mo · 2.7%)
ⓘ Screening estimate from a state-policy table — verify with the county assessor before closing.
Climate risk First Street
- Flood 1/10 Low FEMA zone X (unshaded) · 0% chance over 30 yrs
- Wildfire 2/10 Low
- Heat 2/10 Low 7 d/yr ≥101°F today · 16 d/yr by 30 yrs out
- Wind 2/10 Low
- Air quality 2/10 Low 1 unhealthy d/yr today · 1 by 30 yrs out
Nearby sold comps map
Loading sold comps map…
Walkable amenities ~0.75 mi
Loading nearby amenities…
Taxation est. · year 1
- Rental income
- $16,860
- − Mortgage interest
- −$9,243
- − Property taxes
- −$1,330
- − Insurance
- −$825
- − Repairs & maintenance
- −$1,349
- − Management
- −$1,349
- − Depreciation
- −$4,800
- Taxable loss
- −$2,035
- Est. tax savings @ 24.0%
- +$488
- After-tax cash flow
- $1,270/yr
For passive investors: Depreciation is non-cash, so a rental often shows a tax loss while cash-flowing — sheltering income. Rental losses are passive: they offset passive income freely, and up to $25,000/yr can offset ordinary (W-2) income if you actively participate and your MAGI is under $100k (phasing out to $0 by $150k); unused losses carry forward. On sale, claimed depreciation is recaptured at up to 25%, and gains may owe capital-gains tax (a 1031 exchange can defer both). Figures are a year-1 estimate at your 24.0% rate — not tax advice; consult a CPA.
Schools (NCES district)
- District
- Plymouth Community School Corporation
- NCES district ID
- 1809060
- Math proficiency
- 33% ▼ -10.00%
- Reading proficiency
- 41% ▼ -11.00%
- Median HH income
- $45,852
- Composite
- 31.58/100
- National rank
- #5949
- State rank
- #173 of 301 in IN
Livability — Donaldson
No livability data for this city. (Only ~50 U.S. cities are tracked.)
Census & demographics
- County
- Marshall County · 23,615 people
- Metro
- Plymouth, IN
- Population (ZIP)
- 23,615
- Household income
- $73,293
- Rent vs Own
- Severe rent burden
- 243.0
Population outlook (Marshall County) Hauer SSP2
- Today (2025)
- 46,402 people
- By 2030
- 45,775 · -1.4%
- By 2040
- 44,220 · -4.7%
- By 2050
- 42,329 · -8.8%
- By 2075
- 38,235 · -17.6%
- By 2100
- 33,285 · -28.3%
Race, ethnicity, and origin ACS 2023
- Neighborhood character
- Predominantly White (81%)
- Race & ethnicity
- White 81% Hispanic / Latino 16% Two or more races 4%
- Hispanic origin (detail)
- Mexican 10%
- Common ancestry
- Romanian 4% Iranian 2% Slovak 1%
- Foreign-born
- 7% · Canada
- Languages at home
- 87% English-only · Spanish 12% German/W. Germanic 1%
Political lean MEDSL · Marshall
- 2024 margin
- Solid R (+43.4) · D 27.4% · R 70.8% · Other 1.8%
- 2008→2024 swing
- -29.8pp toward R · 2008: -13.6pp · 2024: -43.4pp
- All cycles
- 2024: R+43.4 2020: R+40.8 2016: R+41.6 2012: R+28.9 2008: R+13.6
Not yet ingested
- Civics
- —
Market trends
- HPI YoY
- ▼ -94.52%
- Current HPI
- 247.1045
- Rent YoY
- —
- Metro
- Plymouth, IN
- State GDP YoY
- ▲ 2.90%
- F500 in state
- 18
Industry mix (Fortune 500 HQ in IN)
| Industry | F500 HQs | Revenue |
|---|---|---|
| Industrial Machinery | 2 | $37B |
|
||
| Healthcare | 1 | $177B |
|
||
| Pharmaceuticals | 1 | $45B |
|
||
| Metals / Steel | 1 | $18B |
|
||
| Agriculture | 1 | $17B |
|
||
| Packaging | 1 | $12B |
|
||
Price history
-10.8% since first listed5 events — show timeline
- 2026-03-27 Pending — NIRA MLS as Distributed by MLS Grid
- 2026-01-24 Price Changed $165,000 NIRA MLS as Distributed by MLS Grid
- 2025-10-03 Price Changed $177,000 NIRA MLS as Distributed by MLS Grid
- 2025-08-26 Price Changed $180,000 NIRA MLS as Distributed by MLS Grid
- 2025-08-06 Listed $185,000 NIRA MLS as Distributed by MLS Grid
Property tax history
+11.7%/yrLatest (2025): $1,330 · -17.7% YoY. Source: county tax records.
Cash-flow waterfall
monthlySold comps — $/sqft
last 12 mo · ≤1 miLoading sold comps…