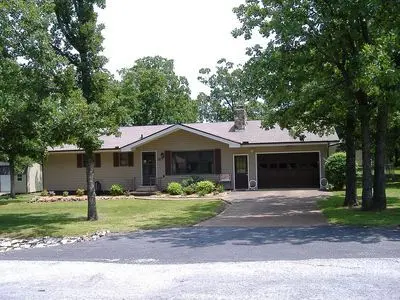
408 Fairway Dr · Horseshoe Bend, AR
Flood risk 1/10 · Minimal
- FEMA flood zone
- X
- Chance of flooding over 30 yrs
- 0.0%
- Est. flood insurance / yr
- $507 – $1,088
Fire risk 3/10 · Minor
- Est. fire insurance / yr
- $1,499 – $2,785
Heat risk 4/10 · Minor
- Hot days now (above 109°F)
- 7 days/yr
- Hot days in 30 yrs
- 20 days/yr
Wind risk 2/10 · Minimal
- Chance of severe wind over 30 yrs
- 4.0%
Air-quality risk 1/10 · Minimal
- Unhealthy air days now
- 0 days/yr
- Unhealthy air days in 30 yrs
- 0 days/yr
Risk factors via First Street. Map © Google.
Why this score? — see what drove the C- grade
The composite is a weighted blend of 9 inputs, each scored 0–100. Each bar is that input's sub-score; the figure is the points it added to the 100-point composite (weight × sub-score).
- Cash flow +20.9/30.0
- ARV discount +10.6/15.0
- DSCR +6.6/10.0
- 1% rule +4.5/10.0
- Livability +3.2/5.0
- Rent growth +2.5/5.0
- Condition / age +2.5/5.0
- Schools +2.3/10.0
- Appreciation +0.0/10.0
$137,000
🖨 Deal sheet 📄 Offer letter ✓ Due diligence
Listing remarks MLS
Everything is in perfect order including recent updates of new: vinyl windows, siding & gutters, appliances, water softener. Heat pump new in 2002 and new septic on extra lot in 1999. Nice kitchen with all appliance included, nice laundry area includes washer/dryer, large living rm w/ wood burning f/p that has blowers & glass doors plus propane back up heater. Deck on back of house. one & one half car garage w/ auto opener. Very well taken care of home. Lot size & room dim. are approx. & rounded down.
Key facts
- 10x16 shed
- Fenced in back yard
- Built 1992
Tags
Neighborhood map
What this means for you Summary
Snapshot
- This is a 2-bed/2.0-bath single-family listed at $137k.
Deal economics
- At list price, monthly cash flow is $190 ($2k/yr) — positive.
- The deal already cash-flows at list — no discount required.
- To meet the 1% rule (rent ≥ 1% of price), the offer needs to be $130k (5.1% below list).
- Recommended offer: $130k (5.1% below list) — sets the bar for 1% rule.
- Cap rate 8.0% vs local median 6.1% in Horseshoe Bend — top-decile yield for the area; either an underpriced asset or a hidden risk that comps aren't pricing in. Stress-test before assuming the spread holds.
Location & tenants
- Location reads 64/100 on livability (#183 in AR) — a middle-class / working-renter tenant base. Strengths: cost of living A+, housing A+, crime B; Watch: schools F, amenities F, commute F.
- Izard CountyConsolidated School District (rural): math 27% / reading 29% proficiency, ranked #171 of 238 in AR (top 72%) — low school quality limits family demand, transient renter base, plan for 1-2y turnover; 63% free/reduced lunch — lower-income household profile, screen leases tightly.
- Market conditions: 442 active listings in the ZIP; 1 comparable units currently listed for rent nearby; 6 units permitted in Izard County in 2024 (0 in 5+ unit buildings).
Forward outlook
- Local home prices are declining (-3.0%/yr); year-one equity from $947 of loan paydown is wiped out by about $4k of value loss. Plan a longer hold.
- Izard County population projected to shrink 8% by 2050 — rents likely to lag national; underwrite the cash flow, not the appreciation.
Negotiation context
- Only 1 days on market — expect competitive offers; lowballing is unlikely to land.
- 2 sale attempts since 14y ago with the ask held roughly flat each time — persistent listings suggest the price (not the market) is what's stuck; bring a comps-based counter.
Questions for the listing agent
- Is there a deadline driving the sale (1031 exchange, divorce, estate, relocation)? That informs how much negotiation room exists.
- Schools are F-rated, which usually means shorter tenancies and higher turnover. Who's the typical renter profile here, and what's been the actual vacancy rate?
- What's the average days-on-market for RENTAL listings here right now (not sales)? A rising rental-DOM trend means longer vacancies and softer asking-rent achievability than the comps imply.
- What's the recent tenant-quality profile in this submarket — average credit score on applications, eviction rate, late-payment / NSF rate, and stable-employment percentage? A property-management company in the area should have these aggregated.
- How much new for-sale + rental construction is in the pipeline within 1–3 miles? Heavy new supply typically softens prices + rents 12–24 months out; constrained supply supports both.
Investment metrics
- 1% rule
- 0.95% ✗
- Cap rate
- 7.96%
- Cash-on-cash
- 5.95%
- DSCR
- 1.26
- GRM
- 8.8
CMA / ARV
- ARV (on-the-fly)
- $147,028
- Comps found
- 10
Show comp detail 10 sales within ~0.75 mi
| Address | Dist | Beds/Ba | Sqft | Sold | Price | $/sf | Match |
|---|---|---|---|---|---|---|---|
| 509 N Cheyenne Dr | 0.20mi | 3/1.5 (+1) | 1,328 (+7%) | 9mo | $144,000 | $108 | 65 |
| 323 Fairway Dr | 0.13mi | 2/1.5 | 1,176 (-6%) | 24mo | $139,000 | $118 | 63 |
| 608 Apache | 0.32mi | 2/2.0 | 1,176 (-6%) | 22mo | $109,900 | $93 | 57 |
| 327 W Green Valley Dr | 0.43mi | 2/2.0 | 1,400 (+12%) | 5mo | $178,000 | $127 | 55 |
| 205 S Nightingale Dr | 0.74mi | 2/2.0 | 1,253 (+1%) | 15mo | $135,000 | $108 | 52 |
| 205 N Bend Dr | 0.60mi | 2/1.5 | 1,120 (-10%) | 7mo | $138,000 | $123 | 47 |
| 602 Tongie Pt | 0.46mi | 3/2.5 (+1) | 1,371 (+10%) | 10mo | $32,000 | $23 | 47 |
| 210 W Lansing Ave | 0.61mi | 3/2.0 (+1) | 1,356 (+9%) | 10mo | $209,000 | $154 | 44 |
| 906 Sequoia Dr | 0.72mi | 3/2.0 (+1) | 1,200 (-4%) | 16mo | $156,000 | $130 | 42 |
| 907 Eagle Ln | 0.71mi | 3/2.0 (+1) | 1,384 (+11%) | 21mo | $101,000 | $73 | 26 |
Match score weights: distance 35% · size 25% · config 20% · recency 20%. Top-matched comps best support the ARV.
Projected returns pro-forma
-3.0% appreciation · 3.0% rent growth · sell at horizon
- IRR
- -7.2%
- Equity multiple
- 0.74×
- Total profit
- $-10,138
- Equity at exit
- $20,427
- IRR
- 2.4%
- Equity multiple
- 1.17×
- Total profit
- $6,571
- Equity at exit
- $11,845
Cash invested: $38,360 (down + closing). Projections, not guarantees.
Landlord ↔ Tenant lean methodology
- Overall (STATE)
- 92 Strongly Landlord-Friendly
- State Arkansas
- 92 Strongly Landlord-Friendly · R+14
- County
- — inherits STATE
- City
- — inherits STATE
ZIP-level market 72512
- Home prices YoY
- -8.3%
- Active inventory
- 442
- Price-to-rent
- 8.8×
Monthly cashflow live
- Estimated rent
- $1,300 medium interval (Pro) →
- Mortgage (P&I)
- −$718
- Tax from tax record
- −$61 /mo · $736/yr
- Insurance
- −$57
- HOA
- −$0
- Vacancy / Maint / Mgmt
- −$273
- Net cashflow
- $190
Break-even live
UW: 25.0% down · 7.5% · 30yr · 1.5% tax · 5.0% vac · 8.0% maint · 8.0% mgmt
Financing live
Cash to close
- Down payment
- $34,250
- Closing costs
- $4,110
- Reserves months
- —
- Total cash needed
- —
Loan-product check · same deal, 3 products live
Conventional
25% down · 7.5% · 30yr
- Down + closing
- —
- Monthly P&I
- —
- Monthly cashflow
- —
- DSCR
- —
- Eligible?
- —
Personal DTI + credit; lowest rate.
DSCR
20% down · 8.5% · 30yr
- Down + closing
- —
- Monthly P&I
- —
- Monthly cashflow
- —
- DSCR
- —
- Eligible?
- —
No personal income docs; deal must DSCR.
Hard money
10% down · 12.0% · 12mo
- Down + closing
- —
- Monthly P&I
- —
- Monthly cashflow
- —
- DSCR
- —
- Eligible?
- —
Short-term bridge; refi at stabilization.
Rent comps 1 comps
| Address | Beds | Baths | Sqft | Rent | $/sqft | DOM | Units | Dist |
|---|---|---|---|---|---|---|---|---|
| 103 E Church St Horseshoe Bend, AR | 2.0 | 1.5 | 1176 | $1,300 | $1.11 | 43d | 1 | 1.23mi |
Listing history 8 events
-
2026-05-26$137,000 Active
-
2024-10-01soldstatus $125,510
-
2013-11-22soldstatus $52,000
-
2012-07-12soldstatus $50,000
-
2012-07-10soldstatus $50,000 535-char remark
Show marketing remark (535 chars)
Everything is in perfect order including recent updates of new: vinyl windows, siding & gutters, appliances, water softener. Heat pump new in 2002 and new septic on extra lot in 1999. Nice kitchen with all appliance included, nice laundry area includes washer/dryer, large living rm w/ wood burning f/p that has blowers & glass doors plus propane back up heater. Deck on back of house. one & one half car garage w/ auto opener. Very well taken care of home. Lot size & room dim. are approx. & rounded down.
-
2012-06-20historical 535-char remark
Show marketing remark (535 chars)
Everything is in perfect order including recent updates of new: vinyl windows, siding & gutters, appliances, water softener. Heat pump new in 2002 and new septic on extra lot in 1999. Nice kitchen with all appliance included, nice laundry area includes washer/dryer, large living rm w/ wood burning f/p that has blowers & glass doors plus propane back up heater. Deck on back of house. one & one half car garage w/ auto opener. Very well taken care of home. Lot size & room dim. are approx. & rounded down.
-
2012-04-13$69,500 535-char remark
Show marketing remark (535 chars)
Everything is in perfect order including recent updates of new: vinyl windows, siding & gutters, appliances, water softener. Heat pump new in 2002 and new septic on extra lot in 1999. Nice kitchen with all appliance included, nice laundry area includes washer/dryer, large living rm w/ wood burning f/p that has blowers & glass doors plus propane back up heater. Deck on back of house. one & one half car garage w/ auto opener. Very well taken care of home. Lot size & room dim. are approx. & rounded down.
-
1990-08-01soldstatus $45,000
ⓘ Source: listings_history table (triggers on properties + properties_extension) + one-shot
backfill from property_details.listing_events for pre-trigger history.
Tax reassessment forecast AR · Resets to sale price
- Current annual tax
- $736 · $61/mo
- Projected year-2 tax
- $877 · $73/mo
- Expected delta
- +$141/yr (+$12/mo · 19.1%)
ⓘ Screening estimate from a state-policy table — verify with the county assessor before closing.
Climate risk First Street
- Flood 1/10 Low FEMA zone X · 0% chance over 30 yrs
- Wildfire 3/10 Moderate
- Heat 4/10 Moderate 7 d/yr ≥109°F today · 20 d/yr by 30 yrs out
- Wind 2/10 Low 4% chance of damaging wind over 30 yrs
- Air quality 1/10 Low 0 unhealthy d/yr today · 0 by 30 yrs out
Nearby sold comps map
Loading sold comps map…
Walkable amenities ~0.75 mi
Loading nearby amenities…
Taxation est. · year 1
- Rental income
- $15,600
- − Mortgage interest
- −$7,674
- − Property taxes
- −$736
- − Insurance
- −$685
- − Repairs & maintenance
- −$1,248
- − Management
- −$1,248
- − Depreciation
- −$3,985
- Taxable income
- $23
- Est. tax owed @ 24.0%
- −$6
- After-tax cash flow
- $2,276/yr
For passive investors: Depreciation is non-cash, so a rental often shows a tax loss while cash-flowing — sheltering income. Rental losses are passive: they offset passive income freely, and up to $25,000/yr can offset ordinary (W-2) income if you actively participate and your MAGI is under $100k (phasing out to $0 by $150k); unused losses carry forward. On sale, claimed depreciation is recaptured at up to 25%, and gains may owe capital-gains tax (a 1031 exchange can defer both). Figures are a year-1 estimate at your 24.0% rate — not tax advice; consult a CPA.
Schools (NCES district)
- District
- Izard CountyConsolidated School District
- NCES district ID
- 0500021
- Math proficiency
- 27% ▼ -15.00%
- Reading proficiency
- 29% ▼ -16.00%
- Median HH income
- $30,245
- Composite
- 22.66/100
- National rank
- #8047
- State rank
- #171 of 238 in AR
Livability — Horseshoe Bend
- Score
- 64/100
- State rank
- #183
- US rank
- #14584
Category grades
Schools grade is shown separately in the Schools card above.
Census & demographics
- Census place
- Horseshoe Bend, AR
- City population
- 2,458
- Population (ZIP)
- 2,458
Population outlook (Izard County) Hauer SSP2
- Today (2025)
- 13,018 people
- By 2030
- 12,761 · -2.0%
- By 2040
- 12,331 · -5.3%
- By 2050
- 12,041 · -7.5%
- By 2075
- 11,516 · -11.5%
- By 2100
- 10,549 · -19.0%
Race, ethnicity, and origin ACS 2023
- Neighborhood character
- Predominantly White (87%)
- Race & ethnicity
- White 87% Two or more races 11% Hispanic / Latino 2%
- Common ancestry
- Romanian 4% Lithuanian 4% Serbian 2%
- Foreign-born
- 0%
- Languages at home
- 99% English-only · Spanish 1%
Political lean MEDSL · Izard
- 2024 margin
- Solid R (+65.9) · D 16.0% · R 81.9% · Other 2.1%
- 2008→2024 swing
- -39.1pp toward R · 2008: -26.9pp · 2024: -65.9pp
- All cycles
- 2024: R+65.9 2020: R+62.1 2016: R+54.3 2012: R+37.8 2008: R+26.9
Not yet ingested
- Civics
- —
Market trends
- HPI YoY
- ▼ -16.58%
- Current HPI
- 184.0807
- Rent YoY
- —
- Metro
- —
- State GDP YoY
- ▲ 3.80%
- F500 in state
- 10
Industry mix (Fortune 500 HQ in AR)
| Industry | F500 HQs | Revenue |
|---|---|---|
| Retail | 1 | $681B |
|
||
| Food / Agriculture | 1 | $53B |
|
||
| Retail / Energy | 1 | $22B |
|
||
| Transportation / Logistics | 1 | $12B |
|
||
| Energy | 1 | $4B |
|
||
Price history
+204.4% since first listed8 events — show timeline
- 2026-05-26 Listed $137,000 FSBO.com
- 2024-10-01 Sold (Public Records) $125,510 Public Records
- 2013-11-22 Sold (Public Records) $52,000 Public Records
- 2012-07-12 Sold (Public Records) $50,000 Public Records
- 2012-07-10 Sold (MLS) $50,000 CARMLS
- 2012-06-20 Listing Removed — CARMLS
- 2012-04-13 Listed $69,500 CARMLS
- 1990-08-01 Sold (Public Records) $45,000 Public Records
Property tax history
+10.2%/yrLatest (2025): $736 · +300.2% YoY. Source: county tax records.
Cash-flow waterfall
monthlySold comps — $/sqft
last 12 mo · ≤1 miLoading sold comps…