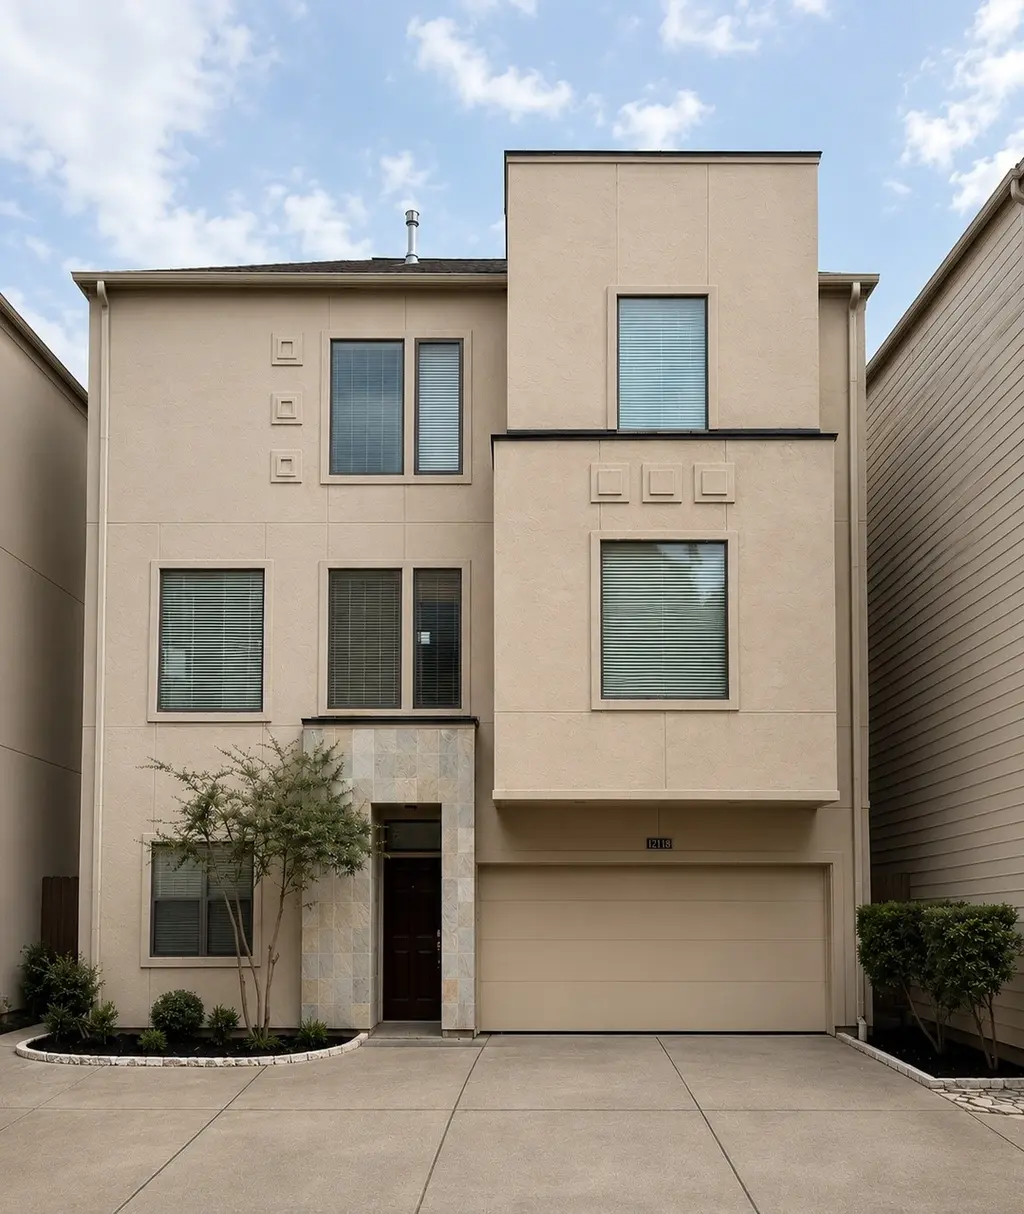
1211 Birdsall St Unit B · Houston, TX
Flood risk 6/10 · Moderate
- FEMA flood zone
- X (unshaded)
- Chance of flooding over 30 yrs
- 0.67%
- Est. flood insurance / yr
- $507 – $1,088
Fire risk 1/10 · Minimal
- Est. fire insurance / yr
- $1,222 – $2,270
Heat risk 9/10 · Severe
- Hot days now (above 109°F)
- 7 days/yr
- Hot days in 30 yrs
- 24 days/yr
Wind risk 9/10 · Severe
- Chance of severe wind over 30 yrs
- 99.0%
Air-quality risk 3/10 · Minor
- Unhealthy air days now
- 2 days/yr
- Unhealthy air days in 30 yrs
- 3 days/yr
Risk factors via First Street. Map © Google.
Why this score? — see what drove the D+ grade
The composite is a weighted blend of 9 inputs, each scored 0–100. Each bar is that input's sub-score; the figure is the points it added to the 100-point composite (weight × sub-score).
- Cash flow +20.1/30.0
- 1% rule +6.5/10.0
- DSCR +6.4/10.0
- ARV discount +4.9/15.0
- Livability +3.7/5.0
- Schools +2.7/10.0
- Condition / age +2.5/5.0
- Rent growth +2.3/5.0
- Appreciation +0.0/10.0
$439,900
🖨 Deal sheet 📄 Offer letter ✓ Due diligence
Listing remarks
Come see this Chic 3-Story home featuring 3 bedrooms and 3.5 baths, completely re-imagined with a top to bottom contemporary remodel. Open concept with kitchen that opens to the dining room and living room- Making this home perfect for entertaining. The Primary Bedroom (1st floor) offers a walk-in shower and oversized soaking tub with a large walk-in closet. New modern quartzite throughout all bathrooms and kitchen. High end appliances, fresh paint and brand new berber carpet. Easy access to shopping, restaurants and more! NO HOA!!!
Key facts
- Open concept
- 3 story home
- Contemporary remodel
Tags
Property features AI
Finance
- Other: Seller disclosure available
- Financial info: Lease not considered
Exterior
- Parking: Attached garage with 2 parking spaces
- Utilities: Public water; Public sewer
- Home design: Residential property; 3 stories; Built in 2004; Slab foundation
- Construction: Brick, stone, and wood siding construction; Composition roof
- Exterior features: Lot approximately 1,972 square feet
Interior
- Bedrooms: Primary bedroom on the first floor (19 x 16); Bedroom on the third floor (13 x 12); Bedroom on the third floor (14 x 13)
- Bathrooms: 3 full bathrooms; 1 half bathroom
- Heating & cooling: Central heating (gas); Central electric air conditioning
- Interior features: One fireplace; Three total rooms
Neighborhood map
What this means for you Summary
Snapshot
- This is a 3-bed/3.5-bath townhouse listed at $440k.
Deal economics
- At list price, monthly cash flow is $545 ($7k/yr) — positive.
- The deal already cash-flows at list — no discount required.
- Meets the 1% rule at list price ($5k rent vs $440k).
- Recommended offer: $427k (3.0% below list) — sets the bar for market timing.
- Cap rate 7.8% vs local median 3.2% in Houston — top-decile yield for the area; either an underpriced asset or a hidden risk that comps aren't pricing in. Stress-test before assuming the spread holds.
Location & tenants
- Location reads 74/100 on livability (#184 in TX, #4,771 nationally) — a middle-class / working-renter tenant base. Strengths: amenities A+, cost of living A+, housing A+; Watch: crime F.
- Houston ISD (urban): math 27% / reading 35% proficiency, ranked #593 of 826 in TX (top 72%) — families likely to look elsewhere, expect single-tenant / working-renter base with shorter leases; 71% free/reduced lunch — lower-income household profile, screen leases tightly.
- Zoned schools: Hogg Middle (math 44% / reading 48%, grade D+, #462 of 1,662 statewide, top 28%, 1,120 students, 52% FRL); Lamar H S (math 38% / reading 65%, grade D+, #478 of 1,632 statewide, top 29%, 3,125 students, 49% FRL) — zoned schools average 50% FRL vs 71% district-wide (21 pts lower); this property's tenant base skews higher-income than the district average.
- Zoned-school proficiency averages 49% at this address vs 31% district-wide (+18 pts) — the actual schools serving this property are materially stronger than the Houston ISD average implies; a family-tenant draw the district grade alone would hide.
- Market conditions: Rents soft (-0.8%/yr); 646 active listings in the ZIP; 37 comparable units currently listed for rent nearby; rentals at typical pace (median 25d on market — plan ~3-4 weeks tenant-placement turnaround); 43% of comp listings sitting > 30 days — soft ceiling on asking rent; high-income renter base; 29,883 units permitted in Harris County in 2024 (8,621 in 5+ unit buildings).
- This rent runs 42% of the median local income ($145k/yr) — at the standard rent-burdened threshold; future hikes will face affordability resistance.
Forward outlook
- Local home prices are declining (-3.0%/yr); year-one equity from $3k of loan paydown is wiped out by about $13k of value loss. Plan a longer hold.
- Harris County population projected at +47% by 2050 — long-run rental-demand tailwind backs the buy-and-hold thesis.
Negotiation context
- It's been on market 37 days — a 3% lower offer ($427k) is reasonable based on typical stale-listing flexibility.
- 8 sale attempts since 23y ago with the ask held roughly flat each time — persistent listings suggest the price (not the market) is what's stuck; bring a comps-based counter.
Risks & watch-outs
- Watch-outs: property tax is 2.6% of price.
- Climate carrying-cost: major flood risk; severe wind risk, 99% chance of damaging wind over 30y; extreme-heat days projected 7→24/yr by 2055 (HVAC capex compounding) — expect insurance premiums to compound above CPI over the hold.
Questions for the listing agent
- It's been on market 37 days. Have you received any prior offers? Is the seller open to a 3% concession, seller financing, or rate buy-down credit?
- Property tax is high relative to price — has the assessment been appealed recently, and will the sale trigger a re-assessment?
- Is there a deadline driving the sale (1031 exchange, divorce, estate, relocation)? That informs how much negotiation room exists.
- Schools are D-rated, which usually means shorter tenancies and higher turnover. Who's the typical renter profile here, and what's been the actual vacancy rate?
- Crime grade is F in this area — have there been break-ins, vandalism, or insurance claims at this property in the last 3 years? What carrier currently insures it and at what premium?
- The area grade is low — what's the realistic commute time and amenity access for the typical tenant pool here? Any planned neighborhood developments (good or bad) we should know about?
- What's the average days-on-market for RENTAL listings here right now (not sales)? A rising rental-DOM trend means longer vacancies and softer asking-rent achievability than the comps imply.
- What's the recent tenant-quality profile in this submarket — average credit score on applications, eviction rate, late-payment / NSF rate, and stable-employment percentage? A property-management company in the area should have these aggregated.
- How much new for-sale + rental construction is in the pipeline within 1–3 miles? Heavy new supply typically softens prices + rents 12–24 months out; constrained supply supports both.
Investment metrics
- 1% rule
- 1.15% ✓
- Cap rate
- 7.78%
- Cash-on-cash
- 5.31%
- DSCR
- 1.24
- GRM
- 7.3
CMA / ARV
- ARV (median comp)
- $415,852
- List price
- $439,900
- Delta
- 5.78%
- Verdict
- FAIR
- Comps
- 20 within 1.0 mi
Show comp detail 12 sales within ~0.75 mi
| Address | Dist | Beds/Ba | Sqft | Sold | Price | $/sf | Match |
|---|---|---|---|---|---|---|---|
| 1517 Asbury St | 0.21mi | 3/2.5 | 2,763 (+1%) | 2mo | $410,000 | $148 | 84 |
| 6410 Rodrigo St Unit B | 0.41mi | 3/3.5 | 2,774 (+1%) | 1mo | $875,000 | $315 | 78 |
| 5213 Feagan St Unit H | 0.59mi | 3/3.5 | 2,750 (+0%) | 1mo | $699,900 | $255 | 71 |
| 5811 Rose St | 0.22mi | 3/2.5 | 2,477 (-10%) | 0mo | $735,000 | $297 | 70 |
| 6501 Rodrigo St | 0.46mi | 3/3.5 | 2,569 (-6%) | 1mo | $840,000 | $327 | 67 |
| 6507 Minola St Unit A | 0.46mi | 3/2.5 | 2,840 (+4%) | 1mo | $790,000 | $278 | 67 |
| 409 Detering St | 0.45mi | 3/3.5 | 2,462 (-10%) | 1mo | $494,000 | $201 | 61 |
| 1625 Mcdonald St | 0.38mi | 3/3.5 | 2,401 (-12%) | 2mo | $425,000 | $177 | 60 |
| 6227 Haskell St | 0.42mi | 2/2.5 (-1) | 2,488 (-9%) | 0mo | $749,000 | $301 | 56 |
| 5618 Lacy St | 0.52mi | 3/3.5 | 2,400 (-12%) | 1mo | $609,000 | $254 | 54 |
| 5208 Blossom St #5 | 0.49mi | 3/3.5 | 2,340 (-15%) | 0mo | $435,000 | $186 | 53 |
| 5527 Darling Unit A | 0.53mi | 3/2.5 | 2,401 (-12%) | 1mo | $450,000 | $187 | 50 |
Match score weights: distance 35% · size 25% · config 20% · recency 20%. Top-matched comps best support the ARV.
Projected returns pro-forma
-3.0% appreciation · 0.0% rent growth · sell at horizon
- IRR
- -11.8%
- Equity multiple
- 0.59×
- Total profit
- $-51,058
- Equity at exit
- $65,591
- IRR
- -8.5%
- Equity multiple
- 0.55×
- Total profit
- $-55,672
- Equity at exit
- $38,035
Cash invested: $123,172 (down + closing). Projections, not guarantees.
Landlord ↔ Tenant lean methodology
- Overall (STATE)
- 87 Strongly Landlord-Friendly
- State Texas
- 87 Strongly Landlord-Friendly · R+5
- County
- — inherits STATE
- City
- — inherits STATE
ZIP-level market 77007
- Rents YoY
- -0.8%
- Active inventory
- 646
- Price-to-rent
- 7.3×
Monthly cashflow live
- Estimated rent
- $5,053 high interval (Pro) →
- Mortgage (P&I)
- −$2,307
- Tax from tax record
- −$957 /mo · $11,479/yr
- Insurance
- −$183
- HOA
- −$0
- Vacancy / Maint / Mgmt
- −$1,061
- Net cashflow
- $545
Break-even live
UW: 25.0% down · 7.5% · 30yr · 1.5% tax · 5.0% vac · 8.0% maint · 8.0% mgmt
Financing live
Cash to close
- Down payment
- $109,975
- Closing costs
- $13,197
- Reserves months
- —
- Total cash needed
- —
Loan-product check · same deal, 3 products live
Conventional
25% down · 7.5% · 30yr
- Down + closing
- —
- Monthly P&I
- —
- Monthly cashflow
- —
- DSCR
- —
- Eligible?
- —
Personal DTI + credit; lowest rate.
DSCR
20% down · 8.5% · 30yr
- Down + closing
- —
- Monthly P&I
- —
- Monthly cashflow
- —
- DSCR
- —
- Eligible?
- —
No personal income docs; deal must DSCR.
Hard money
10% down · 12.0% · 12mo
- Down + closing
- —
- Monthly P&I
- —
- Monthly cashflow
- —
- DSCR
- —
- Eligible?
- —
Short-term bridge; refi at stabilization.
Rent comps 37 comps
| Address | Beds | Baths | Sqft | Rent | $/sqft | DOM | Units | Dist |
|---|---|---|---|---|---|---|---|---|
| 5610 Schuler St Houston, TX | 3.0 | 3.5 | 2614 | $3,111 | $1.19 | 5d | 1 | 0.08mi |
| 5811 Maxie St Houston, TX | 3.0 | 3.5 | 2226 | $3,000 | $1.35 | 44d | 1 | 0.14mi |
| 920 Westcott St Houston, TX | 1.0–2.0 | 1.0–2.0 | 1175 | $3,306 | $2.81 | 1d | 29 | 0.15mi |
| 929 Westcott St Houston, TX | 1.0–3.0 | 1.0–3.0 | 1375 | $9,263 | $6.74 | 3d | 22 | 0.24mi |
| 5305 Nett St Unit A Houston, TX | 3.0 | 3.5 | 2104 | $2,950 | $1.40 | 24d | 1 | 0.25mi |
| 5237 Center St Houston, TX | 3.0 | 3.0 | 2284 | $2,995 | $1.31 | 44d | 1 | 0.31mi |
| 2103 Radcliffe St Unit 1225772P Houston, TX | 3.0 | 2.0 | 1797 | $4,729 | $2.63 | 8d | 1 | 0.45mi |
| 2210 Radcliffe St Houston, TX | 3.0 | 3.5 | 2066 | $2,716 | $1.31 | 8d | 1 | 0.52mi |
| 5336 Darling St Unit 1225767P Houston, TX | 3.0 | 3.0 | 2292 | $5,570 | $2.43 | 8d | 1 | 0.58mi |
| 4917 Nolda St Houston, TX | 3.0 | 3.5 | 1764 | $5,000 | $2.83 | 24d | 1 | 0.59mi |
| 5620 Petty St Houston, TX | 4.0 | 3.5 | 2891 | $8,750 | $3.03 | 44d | 1 | 0.63mi |
| 5620 Petty St Unit 1019538P Houston, TX | 4.0 | 3.5 | 2884 | $16,259 | $5.64 | 22d | 1 | 0.63mi |
| 5235 Petty St Unit B Houston, TX | 3.0 | 2.5 | 2532 | $3,000 | $1.18 | 44d | 1 | 0.64mi |
| 5732 Darling St Unit 1056419P Houston, TX | 3.0 | 3.5 | 2400 | $7,771 | $3.24 | 44d | 1 | 0.65mi |
| 5530 Kiam St Houston, TX | 4.0 | 2.5 | 2688 | $9,750 | $3.63 | 44d | 1 | 0.66mi |
| 5530 Kiam St Unit 1019540P Houston, TX | 4.0 | 2.5 | 2680 | $15,799 | $5.90 | 44d | 1 | 0.66mi |
| 5108 Larkin St Houston, TX | 3.0 | 3.5 | 2108 | $2,850 | $1.35 | 44d | 1 | 0.66mi |
| 5427 Kansas St Houston, TX | 3.0 | 4.0 | 2156 | $2,700 | $1.25 | 44d | 1 | 0.67mi |
| 543 T C Jester Blvd Unit 1225766P Houston, TX | 3.0 | 3.5 | 2389 | $5,222 | $2.19 | 16d | 1 | 0.68mi |
| 4608 Nett St Houston, TX | 3.0 | 4.0 | 2261 | $3,750 | $1.66 | 44d | 1 | 0.73mi |
| 5201 Memorial Dr Houston, TX | 1.0–2.0 | 1.0–2.5 | 1071 | $3,361 | $3.14 | 2d | 21 | 0.79mi |
| 4510 Inker St Houston, TX | 4.0 | 4.0 | 2293 | $4,500 | $1.96 | 44d | 1 | 0.85mi |
| 4444 Center St Houston, TX | 3.0 | 3.0 | 2121 | $3,200 | $1.51 | 44d | 1 | 0.85mi |
| 4311 Marina St Houston, TX | 3.0 | 4.0 | 2328 | $3,599 | $1.55 | 44d | 1 | 0.94mi |
| 915 Thompson St Unit 915 Houston, TX | 4.0 | 3.5 | 3200 | $8,500 | $2.66 | 24d | 1 | 0.95mi |
| 913 Thompson St #913 Houston, TX | 4.0 | 3.5 | 3200 | $8,500 | $2.66 | 24d | 1 | 0.96mi |
| 917 Thompson St Unit 917 Houston, TX | 4.0 | 3.5 | 3200 | $8,000 | $2.50 | 24d | 1 | 0.96mi |
| 911 Thompson St #911 Houston, TX | 4.0 | 3.5 | 3200 | $8,500 | $2.66 | 24d | 1 | 0.96mi |
| 1221 Bonner St Houston, TX | 3.0 | 3.5 | 2252 | $3,200 | $1.42 | 44d | 1 | 1.02mi |
| 707 Marston St Unit 510 Houston, TX | 3.0 | 2.0 | 2310 | $12,482 | $5.40 | 3d | 1 | 1.21mi |
| 811 Buffalo Park Dr Unit 3187 Houston, TX | 3.0 | 2.0 | 3632 | $15,392 | $4.24 | 3d | 1 | 1.31mi |
| 811 Buffalo Park Dr Unit 510 Houston, TX | 3.0 | 2.0 | 3632 | $15,424 | $4.25 | 11d | 1 | 1.31mi |
| 811 Buffalo Park Dr Unit 844 Houston, TX | 3.0 | 2.0 | 3632 | $14,913 | $4.11 | 14d | 1 | 1.31mi |
| 1027 Gross St Houston, TX | 4.0 | 3.5 | 3035 | $5,800 | $1.91 | 44d | 1 | 1.35mi |
| 3333 Allen Pkwy Unit 1000 Houston, TX | 2.0 | 2.5 | 1860 | $4,500 | $2.42 | 44d | 1 | 1.41mi |
| 1958 W Gray St Unit 1991 Houston, TX | 3.0 | 2.0 | 3206 | $15,050 | $4.69 | 11d | 1 | 1.49mi |
| 1958 W Gray St Unit 3165 Houston, TX | 3.0 | 2.0 | 3206 | $15,018 | $4.68 | 3d | 1 | 1.49mi |
Listing history 38 events
-
2026-06-18days on market $439,900 Active 37 DOM
-
2026-06-17days on market $439,900 Active 36 DOM
-
2026-06-16days on market $439,900 Active 35 DOM
-
2026-06-15days on market $439,900 Active 34 DOM
-
2026-06-13pricedays on market $439,900 Active 32 DOM
-
2026-06-10days on market $449,900 Active 28 DOM
-
2026-06-08days on market $449,900 Active 27 DOM
-
2026-06-07days on market $449,900 Active 26 DOM
-
2026-06-04days on market $449,900 Active 23 DOM
-
2026-06-01days on market $449,900 Active 20 DOM
-
2026-05-31days on market $449,900 Active 19 DOM
-
2026-05-12historical
-
2026-05-12$460,000 Active 540-char remark
-
2026-03-24price $449,900
-
2026-02-28price $459,900
-
2026-02-05price $475,000
-
2026-01-20price $489,900
-
2025-12-22price $499,900
-
2025-12-01price $529,900
-
2025-11-19$549,900 Active
-
2019-07-07historical
-
2019-06-13$395,000 Active
-
2017-07-18historical
-
2017-06-28price $364,900
-
2017-06-16price $369,900
-
2017-05-23price $379,900
-
2017-04-21$389,900 Active
-
2015-09-04historical
-
2015-08-05price $395,000
-
2015-07-05$409,000 Active
-
2009-03-18soldstatus
-
2009-03-17historical
-
2008-11-12$360,000
-
2008-06-12historical
-
2008-04-10$375,000
-
2007-07-11soldstatus
-
2004-04-28historical
-
2003-09-15$279,900
ⓘ Source: listings_history table (triggers on properties + properties_extension) + one-shot
backfill from property_details.listing_events for pre-trigger history.
Tax reassessment forecast TX · Resets to sale price
- Current annual tax
- $11,479 · $957/mo
- Projected year-2 tax
- $11,479 · $957/mo
- Expected delta
- $0/yr ($0/mo · 0.0%)
ⓘ Screening estimate from a state-policy table — verify with the county assessor before closing.
Climate risk First Street
- Flood 6/10 Major FEMA zone X (unshaded) · 67% chance over 30 yrs
- Wildfire 1/10 Low
- Heat 9/10 Extreme 7 d/yr ≥109°F today · 24 d/yr by 30 yrs out
- Wind 9/10 Extreme 99% chance of damaging wind over 30 yrs
- Air quality 3/10 Moderate 2 unhealthy d/yr today · 3 by 30 yrs out
Nearby sold comps map
Loading sold comps map…
Walkable amenities ~0.75 mi
Loading nearby amenities…
Taxation est. · year 1
- Rental income
- $60,633
- − Mortgage interest
- −$24,641
- − Property taxes
- −$11,479
- − Insurance
- −$2,200
- − Repairs & maintenance
- −$4,851
- − Management
- −$4,851
- − Depreciation
- −$12,797
- Taxable loss
- −$185
- Est. tax savings @ 24.0%
- +$44
- After-tax cash flow
- $6,583/yr
For passive investors: Depreciation is non-cash, so a rental often shows a tax loss while cash-flowing — sheltering income. Rental losses are passive: they offset passive income freely, and up to $25,000/yr can offset ordinary (W-2) income if you actively participate and your MAGI is under $100k (phasing out to $0 by $150k); unused losses carry forward. On sale, claimed depreciation is recaptured at up to 25%, and gains may owe capital-gains tax (a 1031 exchange can defer both). Figures are a year-1 estimate at your 24.0% rate — not tax advice; consult a CPA.
Schools (NCES district)
- District
- Houston ISD
- NCES district ID
- 4823640
- Math proficiency
- 27% ▼ -18.00%
- Reading proficiency
- 35% ▼ -6.00%
- Median HH income
- $46,054
- Composite
- 26.63/100
- National rank
- #7173
- State rank
- #593 of 826 in TX
Livability — Houston
- Score
- 74/100
- State rank
- #184
- US rank
- #4771
Category grades
Schools grade is shown separately in the Schools card above.
Census & demographics
- Census place
- Houston, TX
- County
- Harris County · 4,702,590 people
- City population
- 3,226,434
- Metro
- Houston-The Woodlands-Sugar Land, TX
- Population (ZIP)
- 47,808
- Household income
- $144,911
- Rent vs Own
- Severe rent burden
- 1812.0
Population outlook (Harris County) Hauer SSP2
- Today (2025)
- 5,571,493 people
- By 2030
- 6,089,821 · +9.3%
- By 2040
- 7,142,806 · +28.2%
- By 2050
- 8,185,864 · +46.9%
- By 2075
- 10,574,329 · +89.8%
- By 2100
- 12,109,958 · +117.4%
Race, ethnicity, and origin ACS 2023
- Neighborhood character
- Diverse neighborhood (Simpson 0.63)
- Race & ethnicity
- White 57% Hispanic / Latino 17% Two or more races 13% Asian 11% Black 9%
- Hispanic origin (detail)
- Mexican 12%
- Common ancestry
- Slovak 3% Romanian 3% Italian 3%
- Foreign-born
- 19% · Canada, China, South Korea
- Languages at home
- 75% English-only · Spanish 12% Other Indo-European 4% Chinese 2%
Political lean MEDSL · Harris
- 2024 margin
- Lean D (+5.5) · D 52.0% · R 46.4% · Other 1.6%
- 2008→2024 swing
- +3.9pp toward D · 2008: 1.6pp · 2024: 5.5pp
- All cycles
- 2024: D+5.5 2020: D+13.3 2016: D+12.4 2012: D+0.1 2008: D+1.6
Not yet ingested
- Civics
- —
Market trends
- HPI YoY
- ▼ -219.42%
- Current HPI
- 159.8157
- Rent YoY
- ▼ -0.83%
- Metro
- Houston-The Woodlands-Sugar Land, TX
- State GDP YoY
- ▲ 3.95%
- F500 in state
- 110
Industry mix (Fortune 500 HQ in TX)
| Industry | F500 HQs | Revenue |
|---|---|---|
| Energy | 16 | $1,198B |
|
||
| Technology | 5 | $198B |
|
||
| Engineering / Construction | 4 | $72B |
|
||
| Energy Services | 3 | $60B |
|
||
| Utilities | 3 | $41B |
|
||
| Healthcare | 2 | $330B |
|
||
Price history
+57.2% since first listed29 events — show timeline
- 2026-06-12 Price Changed $439,900 HARMLS
- 2026-05-23 Price Changed $449,900 HARMLS
- 2026-05-12 Listing Removed — HARMLS
- 2026-05-12 Listed $460,000 HARMLS
- 2026-03-24 Price Changed $449,900 HARMLS
- 2026-02-28 Price Changed $459,900 HARMLS
- 2026-02-05 Price Changed $475,000 HARMLS
- 2026-01-20 Price Changed $489,900 HARMLS
- 2025-12-22 Price Changed $499,900 HARMLS
- 2025-12-01 Price Changed $529,900 HARMLS
- 2025-11-19 Listed $549,900 HARMLS
- 2019-07-07 Listing Removed — HARMLS
- 2019-06-13 Listed $395,000 HARMLS
- 2017-07-18 Listing Removed — HARMLS
- 2017-06-28 Price Changed $364,900 HARMLS
- 2017-06-16 Price Changed $369,900 HARMLS
- 2017-05-23 Price Changed $379,900 HARMLS
- 2017-04-21 Listed $389,900 HARMLS
- 2015-09-04 Listing Removed — HARMLS
- 2015-08-05 Price Changed $395,000 HARMLS
- 2015-07-05 Listed $409,000 HARMLS
- 2009-03-18 Sold (MLS) — HARMLS
- 2009-03-17 Listing Removed — HARMLS
- 2008-11-12 Listed $360,000 HARMLS
- 2008-06-12 Listing Removed — HARMLS
- 2008-04-10 Listed $375,000 HARMLS
- 2007-07-11 Sold (Public Records) — Public Records
- 2004-04-28 Listing Removed — HARMLS
- 2003-09-15 Listed $279,900 HARMLS
Property tax history
+2.1%/yrLatest (2025): $11,479 · +2.7% YoY. Source: county tax records.
Cash-flow waterfall
monthlySold comps — $/sqft
last 12 mo · ≤1 miLoading sold comps…