528 Jones Beach Cv · Jarrell, TX
Flood risk No data
- FEMA flood zone
- —
- Chance of flooding over 30 yrs
- —
- Est. flood insurance / yr
- —
Fire risk No data
- Est. fire insurance / yr
- —
Heat risk No data
- Hot days now (above threshold)
- —
- Hot days in 30 yrs
- —
Wind risk No data
- Chance of severe wind over 30 yrs
- —
Air-quality risk No data
- Unhealthy air days now
- —
- Unhealthy air days in 30 yrs
- —
Risk factors via First Street. Map © Google.
Why this score? — see what drove the D+ grade
The composite is a weighted blend of 9 inputs, each scored 0–100. Each bar is that input's sub-score; the figure is the points it added to the 100-point composite (weight × sub-score).
- Cash flow +13.6/30.0
- ARV discount +13.0/15.0
- Condition / age +4.8/5.0
- DSCR +4.1/10.0
- Livability +3.6/5.0
- 1% rule +3.5/10.0
- Rent growth +2.1/5.0
- Schools +2.1/10.0
- Appreciation +0.0/10.0
$200,999
🖨 Deal sheet 📄 Offer letter ✓ Due diligence
Listing remarks
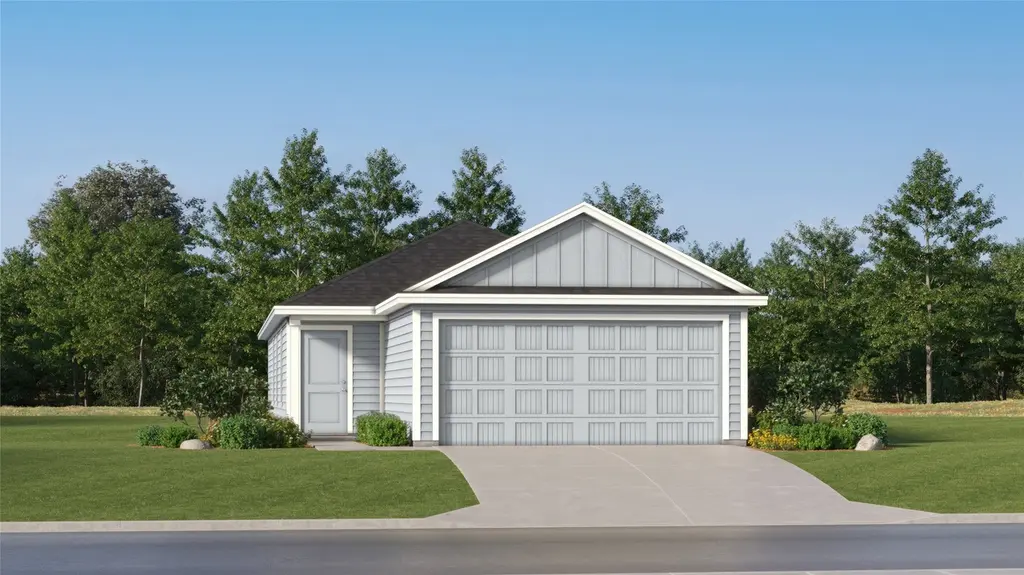
The Gerson - This single-level home showcases a spacious open floorplan shared between the kitchen, dining area and family room for easy entertaining. An owner’s suite enjoys a private location at the front of the home, complemented by an en-suite bathroom and walk-in closet. There are two secondary bedrooms just off the main living areas, which are comfortable spaces for household members and overnight guests. Photos are for illustrative purposes only. Estimated Completion August 2026. The completion date, prices and features may vary and are subject to change. Please verify with Lennar directly.
Key facts
- Walk-in closet
- Open floorplan
- Secondary bedrooms
Tags
Property features AI
Finance
- HOA & community: Homeowners association (Rancho Del Cielo) with a $100 monthly fee covering common area maintenance; Community playground; Community pool
Exterior
- Parking: Attached garage; Driveway; 2 covered parking spaces (total 2)
- Utilities: Electricity connected; Public water; Public sewer
- Home design: Single-story; New construction by Lennar; Faces east; Has a view; Slab foundation
- Construction: Built with brick, cement siding (HardiPlank type), and stone; Composition shingle roof
- Exterior features: No exterior steps; Back yard; Front yard; Interior lot; Cul-de-sac lot
Interior
- Kitchen: Dishwasher; Range
- Bedrooms: 3 main-level bedrooms
- Flooring: Carpet; Tile
- Bathrooms: 2 full bathrooms
- Heating & cooling: Central heating; Central electric air conditioning
- Interior features: Main-level primary suite; Open floor plan
- Laundry & utility: Laundry closet
Neighborhood map
What this means for you Summary
Snapshot
- This is a 3-bed/2.0-bath other listed at $201k. Condition is rated excellent.
Deal economics
- At list price, monthly cash flow is $10 ($121/yr) — positive.
- The deal already cash-flows at list — no discount required.
- To meet the 1% rule (rent ≥ 1% of price), the offer needs to be $172k (14.5% below list).
- Recommended offer: $172k (14.5% below list) — sets the bar for 1% rule.
- Cap rate 6.4% vs local median 4.7% in Jarrell — top-decile yield for the area; either an underpriced asset or a hidden risk that comps aren't pricing in. Stress-test before assuming the spread holds.
Location & tenants
- Location reads 71/100 on livability (#313 in TX) — a middle-class / working-renter tenant base. Strengths: employment A+, housing A+, crime A; Watch: schools F, amenities F, commute F.
- Jarrell ISD (rural): math 19% / reading 28% proficiency, ranked #713 of 826 in TX (top 86%) — low school quality limits family demand, transient renter base, plan for 1-2y turnover.
- Market conditions: Rents soft (-1.7%/yr); 761 active listings in the ZIP; 10 comparable units currently listed for rent nearby; rentals at typical pace (median 24d on market — plan ~3-4 weeks tenant-placement turnaround); 40% of comp listings sitting > 30 days — soft ceiling on asking rent; solid renter incomes; 7,543 units permitted in Williamson County in 2024 (1,425 in 5+ unit buildings).
Forward outlook
- Local home prices are declining (-3.0%/yr); year-one equity from $1k of loan paydown is wiped out by about $6k of value loss. Plan a longer hold.
- Williamson County population projected at +69% by 2050 — long-run rental-demand tailwind backs the buy-and-hold thesis.
Negotiation context
- Only 9 days on market — expect competitive offers; lowballing is unlikely to land.
Questions for the listing agent
- What does the HOA fee cover, when was the last increase, and are there any pending special assessments or reserve-fund shortfalls?
- Is there a deadline driving the sale (1031 exchange, divorce, estate, relocation)? That informs how much negotiation room exists.
- Schools are F-rated, which usually means shorter tenancies and higher turnover. Who's the typical renter profile here, and what's been the actual vacancy rate?
- The area grade is low — what's the realistic commute time and amenity access for the typical tenant pool here? Any planned neighborhood developments (good or bad) we should know about?
- What's the average days-on-market for RENTAL listings here right now (not sales)? A rising rental-DOM trend means longer vacancies and softer asking-rent achievability than the comps imply.
- What's the recent tenant-quality profile in this submarket — average credit score on applications, eviction rate, late-payment / NSF rate, and stable-employment percentage? A property-management company in the area should have these aggregated.
- How much new for-sale + rental construction is in the pipeline within 1–3 miles? Heavy new supply typically softens prices + rents 12–24 months out; constrained supply supports both.
Investment metrics
- 1% rule
- 0.85% ✗
- Cap rate
- 6.35%
- Cash-on-cash
- 0.21%
- DSCR
- 1.01
- GRM
- 9.7
CMA / ARV
- ARV (median comp)
- $229,208
- List price
- $200,999
- Delta
- -12.31%
- Verdict
- UNDERPRICED
- Comps
- 20 within 1.0 mi
Projected returns pro-forma
-3.0% appreciation · 0.0% rent growth · sell at horizon
- IRR
- -19.3%
- Equity multiple
- 0.34×
- Total profit
- $-36,965
- Equity at exit
- $29,970
- IRR
- -19.6%
- Equity multiple
- 0.10×
- Total profit
- $-50,823
- Equity at exit
- $17,379
Cash invested: $56,280 (down + closing). Projections, not guarantees.
Landlord ↔ Tenant lean methodology
- Overall (STATE)
- 87 Strongly Landlord-Friendly
- State Texas
- 87 Strongly Landlord-Friendly · R+5
- County
- — inherits STATE
- City
- — inherits STATE
ZIP-level market 76537
- Home prices YoY
- -14.4%
- Rents YoY
- -1.7%
- Active inventory
- 761
- Price-to-rent
- 9.7×
Monthly cashflow live
- Estimated rent
- $1,718 high interval (Pro) →
- Mortgage (P&I)
- −$1,054
- Tax from tax record
- −$110 /mo · $1,315/yr
- Insurance
- −$84
- HOA
- −$100
- Vacancy / Maint / Mgmt
- −$361
- Net cashflow
- $10
Break-even live
UW: 25.0% down · 7.5% · 30yr · 1.5% tax · 5.0% vac · 8.0% maint · 8.0% mgmt
Financing live
Cash to close
- Down payment
- $50,250
- Closing costs
- $6,030
- Reserves months
- —
- Total cash needed
- —
Loan-product check · same deal, 3 products live
Conventional
25% down · 7.5% · 30yr
- Down + closing
- —
- Monthly P&I
- —
- Monthly cashflow
- —
- DSCR
- —
- Eligible?
- —
Personal DTI + credit; lowest rate.
DSCR
20% down · 8.5% · 30yr
- Down + closing
- —
- Monthly P&I
- —
- Monthly cashflow
- —
- DSCR
- —
- Eligible?
- —
No personal income docs; deal must DSCR.
Hard money
10% down · 12.0% · 12mo
- Down + closing
- —
- Monthly P&I
- —
- Monthly cashflow
- —
- DSCR
- —
- Eligible?
- —
Short-term bridge; refi at stabilization.
Rent comps 10 comps
| Address | Beds | Baths | Sqft | Rent | $/sqft | DOM | Units | Dist |
|---|---|---|---|---|---|---|---|---|
| 133 Texas Angel Way Jarrell, TX | 3.0 | 2.0 | 1230 | $1,500 | $1.22 | 23d | 1 | 0.04mi |
| 136 Texas Angel Way Jarrell, TX | 3.0 | 2.0 | 1450 | $1,550 | $1.07 | 4d | 1 | 0.07mi |
| 136 Texas Angel Way Jarrell, TX | 3.0 | 2.0 | 1450 | $1,495 | $1.03 | 43d | 1 | 0.07mi |
| 337 Rancho del Cielo Loop Georgetown, TX | 3.0 | 2.0 | 1411 | $1,535 | $1.09 | 20d | 1 | 0.08mi |
| 128 Hasty Heart Ct Jarrell, TX | 4.0 | 2.0 | 1606 | $1,775 | $1.11 | 17d | 1 | 0.20mi |
| 516 Rancho del Cielo Loop Jarrell, TX | 3.0 | 2.0 | 1274 | $1,700 | $1.33 | 43d | 1 | 0.21mi |
| 544 Rancho del Cielo Loop Georgetown, TX | 4.0 | 2.0 | 1606 | $1,800 | $1.12 | 43d | 1 | 0.23mi |
| 564 Rancho del Cielo Loop Jarrell, TX | 3.0 | 2.0 | 1266 | $1,600 | $1.26 | 2d | 1 | 0.24mi |
| 856 Rancho del Cielo Loop Jarrell, TX | 3.0 | 2.0 | 1447 | $1,600 | $1.11 | 43d | 1 | 0.27mi |
| 253 Tugboat Annie Way Jarrell, TX | 3.0 | 2.0 | 1380 | $1,495 | $1.08 | 14d | 1 | 0.32mi |
HOA detail
- Monthly dues
- $100 · $1,200/yr
Listing history 2 events
-
2026-05-12price $200,999 610-char remark
-
2026-05-11$202,999 Active 610-char remark
ⓘ Source: listings_history table (triggers on properties + properties_extension) + one-shot
backfill from property_details.listing_events for pre-trigger history.
Tax reassessment forecast TX · Resets to sale price
- Current annual tax
- $1,315 · $110/mo
- Projected year-2 tax
- $3,678 · $307/mo
- Expected delta
- +$2,363/yr (+$197/mo · 179.6%)
ⓘ Screening estimate from a state-policy table — verify with the county assessor before closing.
Nearby sold comps map
Loading sold comps map…
Walkable amenities ~0.75 mi
Loading nearby amenities…
Taxation est. · year 1
- Rental income
- $20,620
- − Mortgage interest
- −$11,259
- − Property taxes
- −$1,315
- − Insurance
- −$1,005
- − Repairs & maintenance
- −$1,650
- − Management
- −$1,650
- − HOA
- −$1,200
- − Depreciation
- −$5,847
- Taxable loss
- −$3,306
- Est. tax savings @ 24.0%
- +$793
- After-tax cash flow
- $914/yr
For passive investors: Depreciation is non-cash, so a rental often shows a tax loss while cash-flowing — sheltering income. Rental losses are passive: they offset passive income freely, and up to $25,000/yr can offset ordinary (W-2) income if you actively participate and your MAGI is under $100k (phasing out to $0 by $150k); unused losses carry forward. On sale, claimed depreciation is recaptured at up to 25%, and gains may owe capital-gains tax (a 1031 exchange can defer both). Figures are a year-1 estimate at your 24.0% rate — not tax advice; consult a CPA.
Condition & rehab AI · 1 photo
This single-level home is in excellent condition with no visible repairs or maintenance needed. It offers a spacious open floorplan and is move-in ready. Potential updates could enhance its curb appeal and functionality.
Value-add opportunities
- Both Painting exterior and interior — Enhances curb appeal and interior aesthetics
- Both Landscaping improvements — Enhances curb appeal and adds value
- Both New flooring in bathrooms and kitchen — Improves functionality and aesthetics
- Both New countertops and backsplash in kitchen — Enhances functionality and aesthetics
- Both New lighting fixtures throughout — Enhances functionality and aesthetics
Renovation cost estimate screening
Value-add ROI direction
- Both Painting exterior and interior — Enhances curb appeal and interior aesthetics ↑
- Both Landscaping improvements — Enhances curb appeal and adds value ↑
- Both New flooring in bathrooms and kitchen — Improves functionality and aesthetics ↑
- Both New countertops and backsplash in kitchen — Enhances functionality and aesthetics ↑
- Both New lighting fixtures throughout — Enhances functionality and aesthetics ↑
ⓘ Cost ranges are severity-bucket heuristics (US national rule-of-thumb). Get contractor quotes + a written scope before underwriting a rehab budget.
Schools (NCES district)
- District
- Jarrell ISD
- NCES district ID
- 4824600
- Math proficiency
- 19% ▼ -18.00%
- Reading proficiency
- 28% ▼ -5.00%
- Median HH income
- $57,132
- Composite
- 21.47/100
- National rank
- #8335
- State rank
- #713 of 826 in TX
Livability — Jarrell
- Score
- 71/100
- State rank
- #313
- US rank
- #7020
Category grades
Schools grade is shown separately in the Schools card above.
Census & demographics
- County
- Williamson County · 680,029 people
- City population
- 16,272
- Metro
- Austin-Round Rock-Georgetown, TX
- Population (ZIP)
- 16,272
- Household income
- $98,199
- Rent vs Own
- Severe rent burden
- 225.0
Population outlook (Williamson County) Hauer SSP2
- Today (2025)
- 699,027 people
- By 2030
- 795,537 · +13.8%
- By 2040
- 990,683 · +41.7%
- By 2050
- 1,184,292 · +69.4%
- By 2075
- 1,623,825 · +132.3%
- By 2100
- 1,924,153 · +175.3%
Race, ethnicity, and origin ACS 2023
- Neighborhood character
- Diverse neighborhood (Simpson 0.63)
- Race & ethnicity
- White 48% Hispanic / Latino 36% Two or more races 14% Black 7% Asian 4%
- Hispanic origin (detail)
- Mexican 30% Puerto Rican 5%
- Common ancestry
- Romanian 3% Italian 2% Slovak 1%
- Foreign-born
- 13% · Canada, Vietnam
- Languages at home
- 69% English-only · Spanish 26% Chinese 2% French/Haitian/Cajun 1%
Political lean MEDSL · Williamson
- 2024 margin
- Toss-up / Even · D 48.0% · R 50.4% · Other 1.6%
- 2008→2024 swing
- +10.6pp toward D · 2008: -13.0pp · 2024: -2.5pp
- All cycles
- 2024: R+2.5 2020: D+1.4 2016: R+9.9 2012: R+21.5 2008: R+13.0
Not yet ingested
- Civics
- —
Market trends
- HPI YoY
- ▼ -31.03%
- Current HPI
- 184.8935
- Rent YoY
- ▼ -1.73%
- Metro
- Austin-Round Rock-Georgetown, TX
- State GDP YoY
- ▲ 3.95%
- F500 in state
- 110
Industry mix (Fortune 500 HQ in TX)
| Industry | F500 HQs | Revenue |
|---|---|---|
| Energy | 16 | $1,198B |
|
||
| Technology | 5 | $198B |
|
||
| Engineering / Construction | 4 | $72B |
|
||
| Energy Services | 3 | $60B |
|
||
| Utilities | 3 | $41B |
|
||
| Healthcare | 2 | $330B |
|
||
Price history
-1.0% since first listed3 events — show timeline
- 2026-05-20 Pending — Unlock MLS
- 2026-05-12 Price Changed $200,999 Unlock MLS
- 2026-05-11 Listed $202,999 Unlock MLS
Property tax history
-7.4%/yrLatest (2026): $1,315 · -7.4% YoY. Source: county tax records.
Cash-flow waterfall
monthlySold comps — $/sqft
last 12 mo · ≤1 miLoading sold comps…