18 Nyoda Trl · Medford Lakes, NJ
Flood risk 1/10 · Minimal
- FEMA flood zone
- X (unshaded)
- Chance of flooding over 30 yrs
- 0.0%
- Est. flood insurance / yr
- $507 – $1,088
Fire risk 5/10 · Moderate
- Est. fire insurance / yr
- $526 – $976
Heat risk 6/10 · Moderate
- Hot days now (above 104°F)
- 7 days/yr
- Hot days in 30 yrs
- 15 days/yr
Wind risk 6/10 · Moderate
- Chance of severe wind over 30 yrs
- 65.0%
Air-quality risk 4/10 · Minor
- Unhealthy air days now
- 4 days/yr
- Unhealthy air days in 30 yrs
- 5 days/yr
Risk factors via First Street. Map © Google.
Why this score? — see what drove the C+ grade
The composite is a weighted blend of 9 inputs, each scored 0–100. Each bar is that input's sub-score; the figure is the points it added to the 100-point composite (weight × sub-score).
- Cash flow +25.2/30.0
- 1% rule +9.8/10.0
- DSCR +8.2/10.0
- ARV discount +7.5/15.0
- Livability +3.3/5.0
- Schools +3.2/10.0
- Rent growth +2.5/5.0
- Condition / age +2.5/5.0
- Appreciation +0.0/10.0
$250,000
🖨 Deal sheet 📄 Offer letter ✓ Due diligence
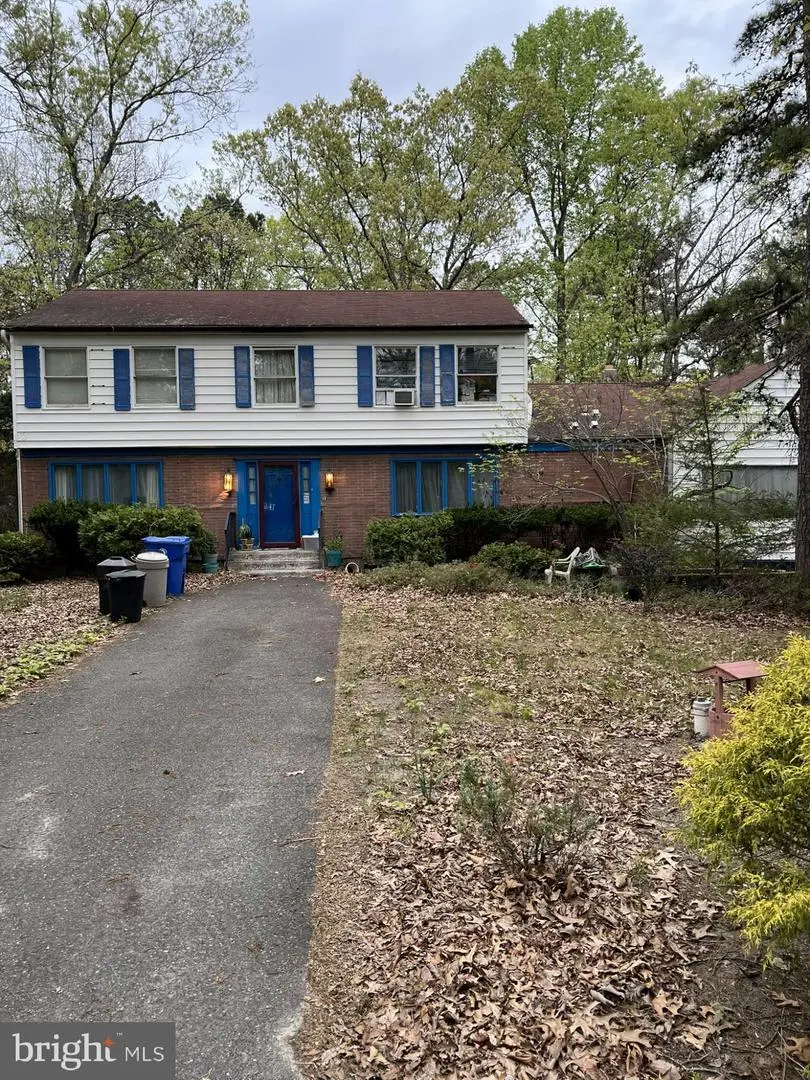
Listing remarks
Opportunity knocks in a well-established Tabernacle community—this custom-built 4-bedroom, 2 . 5 bath home sits on a generous lot and offers the perfect canvas for a complete renovation. Built in 1972, the property features a spacious layout including an oversized family room, separate living room, and formal dining room, along with a full basement providing additional potential. This home is being sold strictly as-is and requires a full interior and exterior rehab. The property currently has no heat, is serviced by well and septic, and includes a known structural concern in the basement. There is direct access from the garage to the basement. Buyers should conduct their own due dilig
Key facts
- 1 acre lot
- 2 garage spots
- Built 1972
Property features AI
Exterior
- Parking: Attached 2-car garage with inside access; Driveway parking
- Utilities: Well water; Septic system; Electric service
- Home design: Detached home; Assessor indicates year built (source: Assessor)
- Construction: Frame construction; Block foundation
- Exterior features: Detached structure; Above-grade and below-grade structures noted; Lot dimensions listed by assessor
Interior
- Bedrooms: Four bedrooms on the upper level
- Bathrooms: Two full bathrooms; One half bathroom on the main level
- Heating & cooling: Baseboard hot water heating; Electric cooling; Electric hot water
- Interior features: Full basement; Assessor-listed living area
- Laundry & utility: Laundry room
Neighborhood map
What this means for you Summary
Snapshot
- This is a 4-bed/2.5-bath single-family listed at $250k.
Deal economics
- At list price, monthly cash flow is $556 ($7k/yr) — positive.
- The deal already cash-flows at list — no discount required.
- Meets the 1% rule at list price ($4k rent vs $250k).
- Recommended offer: $246k (1.5% below list) — sets the bar for market timing.
- Cap rate 9.0% vs local median 2.0% in Medford Lakes — top-decile yield for the area; either an underpriced asset or a hidden risk that comps aren't pricing in. Stress-test before assuming the spread holds.
Location & tenants
- Location reads 66/100 on livability (#348 in NJ) — a middle-class / working-renter tenant base. Strengths: crime A+, employment A+, housing A+; Watch: amenities F, commute F, cost of living F.
- Tabernacle Township School District (rural): math 19% / reading 44% proficiency, ranked #278 of 472 in NJ (top 59%) — families likely to look elsewhere, expect single-tenant / working-renter base with shorter leases; only 9% free/reduced lunch — higher-income household profile.
- Market conditions: 156 active listings in the ZIP; 1 comparable units currently listed for rent nearby; 2,161 units permitted in Burlington County in 2024 (988 in 5+ unit buildings).
Forward outlook
- Local home prices are declining (-3.0%/yr); year-one equity from $2k of loan paydown is wiped out by about $8k of value loss. Plan a longer hold.
- Burlington County population projected to shrink 5% by 2050 — rents likely to lag national; underwrite the cash flow, not the appreciation.
Negotiation context
- It's been on market 23 days — a 2% lower offer ($246k) is reasonable based on typical stale-listing flexibility.
Risks & watch-outs
- Watch-outs: property tax is 4.6% of price.
- Climate carrying-cost: major wind risk, 65% chance of damaging wind over 30y; moderate wildfire risk; extreme-heat days projected 7→15/yr by 2055 (HVAC capex compounding) — expect insurance premiums to compound above CPI over the hold.
Questions for the listing agent
- Built in 1972 — when were the roof, HVAC, electrical panel, plumbing, and water heater last replaced?
- Property tax is high relative to price — has the assessment been appealed recently, and will the sale trigger a re-assessment?
- Is there a deadline driving the sale (1031 exchange, divorce, estate, relocation)? That informs how much negotiation room exists.
- Schools are A-rated — typically a magnet for longer-tenancy family renters. What's the average tenant stay here, and is there a school-zone premium baked into asking?
- What's the average days-on-market for RENTAL listings here right now (not sales)? A rising rental-DOM trend means longer vacancies and softer asking-rent achievability than the comps imply.
- What's the recent tenant-quality profile in this submarket — average credit score on applications, eviction rate, late-payment / NSF rate, and stable-employment percentage? A property-management company in the area should have these aggregated.
- How much new for-sale + rental construction is in the pipeline within 1–3 miles? Heavy new supply typically softens prices + rents 12–24 months out; constrained supply supports both.
Investment metrics
- 1% rule
- 1.48% ✓
- Cap rate
- 8.96%
- Cash-on-cash
- 9.54%
- DSCR
- 1.42
- GRM
- 5.6
CMA / ARV
- ARV (on-the-fly)
- $708,299
- Comps found
- 4
Show comp detail 4 sales within ~0.75 mi
| Address | Dist | Beds/Ba | Sqft | Sold | Price | $/sf | Match |
|---|---|---|---|---|---|---|---|
| 18 Forest Ln | 0.33mi | 4/3.0 | 2,556 (-13%) | 1mo | $615,000 | $241 | 60 |
| 8 Hillcrest Dr | 0.53mi | 4/3.0 | 2,850 (-3%) | 21mo | $525,000 | $184 | 51 |
| 43 Woodside Dr | 0.42mi | 3/2.5 (-1) | 2,548 (-13%) | 4mo | $450,000 | $177 | 50 |
| 606 Old Indian Mills Rd | 0.67mi | 3/2.5 (-1) | 2,590 (-12%) | 20mo | $730,000 | $282 | 27 |
Match score weights: distance 35% · size 25% · config 20% · recency 20%. Top-matched comps best support the ARV.
Projected returns pro-forma
-3.0% appreciation · 3.0% rent growth · sell at horizon
- IRR
- -1.7%
- Equity multiple
- 0.93×
- Total profit
- $-4,629
- Equity at exit
- $37,276
- IRR
- 8.1%
- Equity multiple
- 1.62×
- Total profit
- $43,418
- Equity at exit
- $21,615
Cash invested: $70,000 (down + closing). Projections, not guarantees.
Landlord ↔ Tenant lean methodology
- Overall (STATE)
- 21 Tenant-Leaning
- State New Jersey
- 21 Tenant-Leaning · D+6
- County
- — inherits STATE
- City
- — inherits STATE
ZIP-level market 08088
- Active inventory
- 156
- Price-to-rent
- 5.6×
Monthly cashflow live
- Estimated rent
- $3,700 medium interval (Pro) →
- Mortgage (P&I)
- −$1,311
- Tax from tax record
- −$951 /mo · $11,418/yr
- Insurance
- −$104
- HOA
- −$0
- Vacancy / Maint / Mgmt
- −$777
- Net cashflow
- $556
Break-even live
UW: 25.0% down · 7.5% · 30yr · 1.5% tax · 5.0% vac · 8.0% maint · 8.0% mgmt
Financing live
Cash to close
- Down payment
- $62,500
- Closing costs
- $7,500
- Reserves months
- —
- Total cash needed
- —
Loan-product check · same deal, 3 products live
Conventional
25% down · 7.5% · 30yr
- Down + closing
- —
- Monthly P&I
- —
- Monthly cashflow
- —
- DSCR
- —
- Eligible?
- —
Personal DTI + credit; lowest rate.
DSCR
20% down · 8.5% · 30yr
- Down + closing
- —
- Monthly P&I
- —
- Monthly cashflow
- —
- DSCR
- —
- Eligible?
- —
No personal income docs; deal must DSCR.
Hard money
10% down · 12.0% · 12mo
- Down + closing
- —
- Monthly P&I
- —
- Monthly cashflow
- —
- DSCR
- —
- Eligible?
- —
Short-term bridge; refi at stabilization.
Rent comps 1 comps
| Address | Beds | Baths | Sqft | Rent | $/sqft | DOM | Units | Dist |
|---|---|---|---|---|---|---|---|---|
| 44 Red Oak Dr Tabernacle, NJ | 3.0 | 2.5 | 1971 | $3,700 | $1.88 | 1d | 1 | 0.82mi |
Listing history 2 events
-
2026-05-04$250,000 Active 1157-char remark
-
2026-04-30historical $250,000 1157-char remark
ⓘ Source: listings_history table (triggers on properties + properties_extension) + one-shot
backfill from property_details.listing_events for pre-trigger history.
Tax reassessment forecast NJ · Partial reset (capped growth)
- Current annual tax
- $11,418 · $951/mo
- Projected year-2 tax
- $11,418 · $951/mo
- Expected delta
- $0/yr ($0/mo · 0.0%)
ⓘ Screening estimate from a state-policy table — verify with the county assessor before closing.
Climate risk First Street
- Flood 1/10 Low FEMA zone X (unshaded) · 0% chance over 30 yrs
- Wildfire 5/10 Major
- Heat 6/10 Major 7 d/yr ≥104°F today · 15 d/yr by 30 yrs out
- Wind 6/10 Major 65% chance of damaging wind over 30 yrs
- Air quality 4/10 Moderate 4 unhealthy d/yr today · 5 by 30 yrs out
Nearby sold comps map
Loading sold comps map…
Walkable amenities ~0.75 mi
Loading nearby amenities…
Taxation est. · year 1
- Rental income
- $44,400
- − Mortgage interest
- −$14,004
- − Property taxes
- −$11,418
- − Insurance
- −$1,250
- − Repairs & maintenance
- −$3,552
- − Management
- −$3,552
- − Depreciation
- −$7,273
- Taxable income
- $3,352
- Est. tax owed @ 24.0%
- −$804
- After-tax cash flow
- $5,872/yr
For passive investors: Depreciation is non-cash, so a rental often shows a tax loss while cash-flowing — sheltering income. Rental losses are passive: they offset passive income freely, and up to $25,000/yr can offset ordinary (W-2) income if you actively participate and your MAGI is under $100k (phasing out to $0 by $150k); unused losses carry forward. On sale, claimed depreciation is recaptured at up to 25%, and gains may owe capital-gains tax (a 1031 exchange can defer both). Figures are a year-1 estimate at your 24.0% rate — not tax advice; consult a CPA.
Schools (NCES district)
- District
- Tabernacle Township School District
- NCES district ID
- 3416020
- Math proficiency
- 19% ▼ -20.00%
- Reading proficiency
- 44% ▼ -3.00%
- Median HH income
- $96,192
- Composite
- 31.76/100
- National rank
- #5900
- State rank
- #278 of 472 in NJ
Livability — Medford Lakes
- Score
- 66/100
- State rank
- #348
- US rank
- #11400
Category grades
Schools grade is shown separately in the Schools card above.
Census & demographics
- Population (ZIP)
- 24,153
Population outlook (Burlington County) Hauer SSP2
- Today (2025)
- 453,425 people
- By 2030
- 452,359 · -0.2%
- By 2040
- 445,033 · -1.9%
- By 2050
- 431,760 · -4.8%
- By 2075
- 406,277 · -10.4%
- By 2100
- 364,732 · -19.6%
Race, ethnicity, and origin ACS 2023
- Neighborhood character
- Predominantly White (90%)
- Race & ethnicity
- White 90% Hispanic / Latino 4% Two or more races 4% Asian 2% Black 1%
- Common ancestry
- Romanian 8% Slovak 2% Iranian 2%
- Foreign-born
- 4% · Canada, China
- Languages at home
- 94% English-only · Spanish 3% Chinese 1%
Political lean MEDSL · Burlington
- 2024 margin
- D (+16.6) · D 57.6% · R 41.0% · Other 1.3%
- 2008→2024 swing
- -2.0pp toward R · 2008: 18.6pp · 2024: 16.6pp
- All cycles
- 2024: D+16.6 2020: D+19.5 2016: D+14.8 2012: D+18.7 2008: D+18.6
Not yet ingested
- Civics
- —
Market trends
- HPI YoY
- ▼ -214.45%
- Current HPI
- 302.9094
- Rent YoY
- —
- Metro
- —
- State GDP YoY
- ▲ 2.05%
- F500 in state
- 34
Industry mix (Fortune 500 HQ in NJ)
| Industry | F500 HQs | Revenue |
|---|---|---|
| Consumer Goods | 3 | $31B |
|
||
| Pharmaceuticals | 2 | $153B |
|
||
| Technology | 2 | $21B |
|
||
| Insurance | 2 | $20B |
|
||
| Healthcare | 2 | $19B |
|
||
| Financial Services | 1 | $70B |
|
||
Price history
+23.2% since first listed4 events — show timeline
- 2026-06-18 Sold (MLS) $308,000 BRIGHT MLS
- 2026-05-26 Pending — BRIGHT MLS
- 2026-05-04 Listed $250,000 BRIGHT MLS
- 2026-04-30 Coming Soon $250,000 BRIGHT MLS
Property tax history
+2.1%/yrLatest (2025): $11,418 · +2.1% YoY. Source: county tax records.
Cash-flow waterfall
monthlySold comps — $/sqft
last 12 mo · ≤1 miLoading sold comps…