 🏷️ Likely Rental
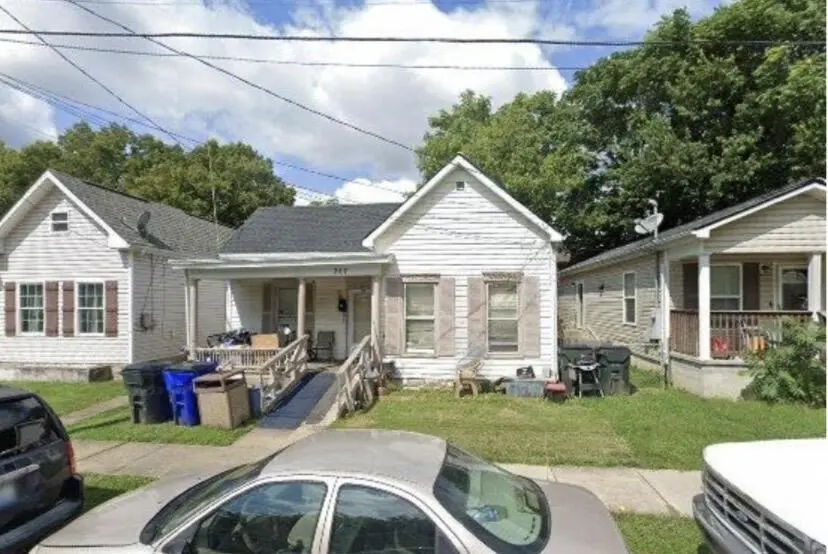
347 Ohio St · Lexington-Fayette, KY
Flood risk 4/10 · Minor
- FEMA flood zone
- X (unshaded)
- Chance of flooding over 30 yrs
- 0.2%
- Est. flood insurance / yr
- $507 – $1,088
Fire risk 1/10 · Minimal
- Est. fire insurance / yr
- $839 – $1,559
Heat risk 4/10 · Minor
- Hot days now (above 101°F)
- 7 days/yr
- Hot days in 30 yrs
- 19 days/yr
Wind risk 2/10 · Minimal
- Chance of severe wind over 30 yrs
- 1.0%
Air-quality risk 1/10 · Minimal
- Unhealthy air days now
- 0 days/yr
- Unhealthy air days in 30 yrs
- 0 days/yr
Risk factors via First Street. Map © Google.
Why this score? — see what drove the B grade
The composite is a weighted blend of 9 inputs, each scored 0–100. Each bar is that input's sub-score; the figure is the points it added to the 100-point composite (weight × sub-score).
- Cash flow +29.1/30.0
- ARV discount +15.0/15.0
- DSCR +10.0/10.0
- 1% rule +6.9/10.0
- Rent growth +5.0/5.0
- Schools +3.4/10.0
- Livability +2.5/5.0
- Condition / age +2.5/5.0
- Appreciation +0.0/10.0
$139,900
🖨 Deal sheet (PDF) 📄 Offer letter ✓ Due diligence
Listing remarks
Turnkey investment opportunity producing $1,200/month in rental income. Ideal for investors seeking immediate cash flow. Up to 4 additional properties can be added to maximize cash flow.
Key facts
- 3,833 sq ft lot
- Built 1900
- Listed 54 days
Property features AI
Finance
- Other: Located in Fayette County
- Financial info: Parcel number 16818550
Exterior
- Home design: Property address: 347 Ohio St, Lexington, KY 40508
- Construction: Building area listed as 3,833 total
- Exterior features: Located in the Downtown subdivision; Zoned R-1 (Residential)
Interior
- Bathrooms: 1 full bathroom
- Heating & cooling: Heat pump heating; Heat pump cooling
- Interior features: Heat pump provides both heating and cooling
Neighborhood map
What this means for you Summary
Snapshot
- This is a 2-bed/1.0-bath single-family listed at $140k.
Deal economics
- At list price, monthly cash flow is $485 ($6k/yr) — positive.
- The deal already cash-flows at list — no discount required.
- Meets the 1% rule at list price ($2k rent vs $140k).
- Recommended offer: $136k (3.0% below list) — sets the bar for market timing.
- Cap rate 10.5% vs local median 3.8% in Lexington-Fayette — top-decile yield for the area; either an underpriced asset or a hidden risk that comps aren't pricing in. Stress-test before assuming the spread holds.
Location & tenants
- Location reads: area grade B — affects rentability + tenant quality, not the cash-flow math above.
- Fayette County (urban): math 35% / reading 45% proficiency, ranked #27 of 165 in KY (top 16%) — families likely to look elsewhere, expect single-tenant / working-renter base with shorter leases.
- Zoned schools: William Wells Brown Elementary (math 8% / reading 12%, grade F, #648 of 676 statewide, top 98%, 308 students, 86% FRL); Frederick Douglass High School (math 36% / reading 42%, grade F, #51 of 254 statewide, top 21%, 1,667 students, 43% FRL) — zoned schools average 65% FRL vs 44% district-wide (20 pts higher); higher-poverty schools than district average — tighter screening recommended.
- Zoned-school proficiency averages 24% at this address vs 40% district-wide (-16 pts) — the specific schools serving this property underperform the Fayette County average; the district grade overstates school quality for this exact location.
- Market conditions: Rents rising fast (+11.8%/yr); 82 active listings in the ZIP; 39 comparable units currently listed for rent nearby; rentals at typical pace (median 25d on market — plan ~3-4 weeks tenant-placement turnaround); lower-income renter base — watch delinquency; 1,036 units permitted in Fayette County in 2024 (542 in 5+ unit buildings).
- At $1,661/mo this rent would consume 68% of the median local household income ($29k/yr) (locally 2644% of renters already pay >50% of income on rent) — very limited rent-growth headroom before tenants either downsize or default.
Forward outlook
- Local home prices are declining (-3.0%/yr); year-one equity from $967 of loan paydown is wiped out by about $4k of value loss. Plan a longer hold.
- Fayette County population projected at +35% by 2050 — long-run rental-demand tailwind backs the buy-and-hold thesis.
- At projected returns (-3.0% appreciation + 8.0% rent growth), your $39k cash investment doubles in ~6 years — after that, you're playing with house money.
Negotiation context
- It's been on market 55 days — a 3% lower offer ($136k) is reasonable based on typical stale-listing flexibility.
- Current owner paid $16k; list at $140k implies a 774% gain — meaningful room to come down on a strong offer.
Risks & watch-outs
- Watch-outs: built in 1900 — expect roof / HVAC / electrical / plumbing capex.
Questions for the listing agent
- It's been on market 55 days. Have you received any prior offers? Is the seller open to a 3% concession, seller financing, or rate buy-down credit?
- Built in 1900 — when were the roof, HVAC, electrical panel, plumbing, and water heater last replaced?
- Is there a deadline driving the sale (1031 exchange, divorce, estate, relocation)? That informs how much negotiation room exists.
- What's the average days-on-market for RENTAL listings here right now (not sales)? A rising rental-DOM trend means longer vacancies and softer asking-rent achievability than the comps imply.
- What's the recent tenant-quality profile in this submarket — average credit score on applications, eviction rate, late-payment / NSF rate, and stable-employment percentage? A property-management company in the area should have these aggregated.
- How much new for-sale + rental construction is in the pipeline within 1–3 miles? Heavy new supply typically softens prices + rents 12–24 months out; constrained supply supports both.
Investment metrics
- 1% rule
- 1.19% ✓
- Cap rate
- 10.45%
- Cash-on-cash
- 14.85%
- DSCR
- 1.66
- GRM
- 7.0
CMA / ARV
- ARV (on-the-fly)
- $255,744
- Comps found
- 12
Show comp detail 12 sales within ~0.75 mi
| Address | Dist | Beds/Ba | Sqft | Sold | Price | $/sf | Match |
|---|---|---|---|---|---|---|---|
| 331 Wilgus Ave | 0.11mi | 3/1.5 (+1) | 1,260 (-5%) | 1mo | $242,500 | $192 | 78 |
| 517 Goodloe St | 0.23mi | 2/1.5 | 1,437 (+8%) | 2mo | $318,000 | $221 | 73 |
| 432 Race St | 0.21mi | 3/2.5 (+1) | 1,380 (+4%) | 2mo | $289,900 | $210 | 72 |
| 117 W Fifth St | 0.44mi | 2/1.0 | 1,286 (-4%) | 8mo | $182,000 | $142 | 67 |
| 443 Chestnut St | 0.15mi | 3/1.0 (+1) | 1,144 (-14%) | 1mo | $109,900 | $96 | 64 |
| 380 Nelson Ave | 0.41mi | 3/2.0 (+1) | 1,252 (-6%) | 2mo | $285,000 | $228 | 60 |
| 647 North Limestone | 0.59mi | 3/1.0 (+1) | 1,337 (+0%) | 12mo | $236,500 | $177 | 57 |
| 635 Breckenridge St | 0.66mi | 3/2.0 (+1) | 1,240 (-7%) | 3mo | $100,000 | $81 | 46 |
| 133 Rand Ave | 0.41mi | 3/1.0 (+1) | 1,526 (+15%) | 12mo | $300,000 | $197 | 41 |
| 511 Breckenridge St | 0.53mi | 3/1.5 (+1) | 1,492 (+12%) | 9mo | $212,000 | $142 | 41 |
| 265 E Loudon Ave | 0.73mi | 3/2.0 (+1) | 1,422 (+7%) | 10mo | $237,000 | $167 | 37 |
| 559 Breckenridge St | 0.58mi | 3/2.0 (+1) | 1,180 (-11%) | 11mo | $242,000 | $205 | 36 |
Match score weights: distance 35% · size 25% · config 20% · recency 20%. Top-matched comps best support the ARV.
Projected returns pro-forma
-3.0% appreciation · 8.0% rent growth · sell at horizon
- IRR
- 10.4%
- Equity multiple
- 1.43×
- Total profit
- $16,915
- Equity at exit
- $20,860
- IRR
- 22.9%
- Equity multiple
- 3.40×
- Total profit
- $94,173
- Equity at exit
- $12,096
Cash invested: $39,172 (down + closing). Projections, not guarantees.
Landlord ↔ Tenant lean methodology
- Overall (STATE)
- 83 Strongly Landlord-Friendly
- State Kentucky
- 83 Strongly Landlord-Friendly · R+16
- County
- — inherits STATE
- City
- — inherits STATE
ZIP-level market 40508
- Rents YoY
- 11.8%
- Active inventory
- 82
- Price-to-rent
- 7.0×
Monthly cashflow live
- Estimated rent
- $1,661 high interval (Pro) →
- Mortgage (P&I)
- −$734
- Tax from tax record
- −$35 /mo · $423/yr
- Insurance
- −$58
- HOA
- −$0
- Vacancy / Maint / Mgmt
- −$349
- Net cashflow
- $485
Break-even live
Sensitivity live
| Price | -10% $564 | -5% $524 | +0% $485 | +5% $445 | +10% $405 |
|---|---|---|---|---|---|
| Rent | -10% $353 | -5% $419 | +0% $485 | +5% $550 | +10% $616 |
| Rate | -1.0pp $555 | -0.5pp $520 | base $485 | +0.5pp $448 | +1.0pp $412 |
UW: 25.0% down · 7.5% · 30yr · 1.5% tax · 5.0% vac · 8.0% maint · 8.0% mgmt
Financing live
Cash to close
- Down payment
- $34,975
- Closing costs
- $4,197
- Reserves months
- —
- Total cash needed
- —
Loan-product check · same deal, 3 products live
Conventional
25% down · 7.5% · 30yr
- Down + closing
- —
- Monthly P&I
- —
- Monthly cashflow
- —
- DSCR
- —
- Eligible?
- —
Personal DTI + credit; lowest rate.
DSCR
20% down · 8.5% · 30yr
- Down + closing
- —
- Monthly P&I
- —
- Monthly cashflow
- —
- DSCR
- —
- Eligible?
- —
No personal income docs; deal must DSCR.
Hard money
10% down · 12.0% · 12mo
- Down + closing
- —
- Monthly P&I
- —
- Monthly cashflow
- —
- DSCR
- —
- Eligible?
- —
Short-term bridge; refi at stabilization.
Rent comps 39 comps
| Address | Beds | Baths | Sqft | Rent | $/sqft | DOM | Units | Dist |
|---|---|---|---|---|---|---|---|---|
| 425 Hawkins Ave Lexington, KY | 3.0 | 1.5 | 1124 | $1,570 | $1.40 | 15d | 1 | 0.14mi |
| 434 N Martin Luther King Blvd #201 Lexington, KY | 2.0 | 2.0 | 950 | $1,450 | $1.53 | 24d | 1 | 0.20mi |
| 236 Warnock St Lexington, KY | 3.0 | 1.0 | 1028 | $2,200 | $2.14 | 24d | 1 | 0.28mi |
| 211 E Sixth St Lexington, KY | 3.0 | 1.0 | 1400 | $1,500 | $1.07 | 24d | 1 | 0.38mi |
| 658 Elm Tree Ln Lexington, KY | 3.0 | 2.0 | 1350 | $1,800 | $1.33 | 24d | 1 | 0.45mi |
| 231 Walton Ave Unit 206 Lexington, KY | 2.0 | 2.0 | 1178 | $1,700 | $1.44 | 24d | 1 | 0.50mi |
| 706 Lancaster Ave Lexington, KY | 3.0 | 3.0 | 1050 | $1,495 | $1.42 | 15d | 1 | 0.53mi |
| 111 Woodland Ave #309 Lexington, KY | 2.0 | 2.0 | 1833 | $3,300 | $1.80 | 24d | 1 | 0.55mi |
| 120 E Main St Lexington, KY | 2.0 | 1.0–2.0 | 710 | $2,486 | $3.50 | 15d | 20 | 0.55mi |
| 222 W Sixth St Lexington, KY | 3.0 | 1.5 | 1050 | $1,150 | $1.10 | 24d | 1 | 0.56mi |
| 444 N Broadway Lexington, KY | 3.0 | 1.0 | 1160 | $1,595 | $1.38 | 24d | 1 | 0.57mi |
| 325 W 6th St Lexington, KY | 1.0 | 1.0 | 900 | $1,300 | $1.44 | 24d | 1 | 0.63mi |
| 143 Woodland Ave Lexington, KY | 2.0 | 1.0 | 1100 | $1,650 | $1.50 | 24d | 1 | 0.63mi |
| 341 Grosvenor Ave Unit 3 Lexington, KY | 3.0 | 3.0 | 875 | $2,500 | $2.86 | 24d | 1 | 0.68mi |
| 170 E Loudon Ave Unit 2 Lexington, KY | 3.0 | 1.0 | 1500 | $1,350 | $0.90 | 24d | 1 | 0.71mi |
| 161 E Loudon Ave Lexington, KY | 2.0 | 1.0 | 1118 | $1,300 | $1.16 | 24d | 1 | 0.74mi |
| 261 S Limestone #303 Lexington, KY | 2.0 | 2.0 | 1102 | $2,995 | $2.72 | 24d | 1 | 0.79mi |
| 275 S Limestone #140 Lexington, KY | 2.0 | 2.0 | 1578 | $4,700 | $2.98 | 24d | 1 | 0.80mi |
| 275 S Limestone #115 Lexington, KY | 2.0 | 2.0 | 1010 | $2,500 | $2.48 | 24d | 1 | 0.80mi |
| 275 S Limestone #135 Lexington, KY | 3.0 | 2.0 | 1142 | $2,950 | $2.58 | 15d | 1 | 0.80mi |
| 444 Jefferson St Unit A Lexington, KY | 2.0 | 2.0 | 1220 | $1,950 | $1.60 | 15d | 1 | 0.84mi |
| 51 Mentelle Park Unit 4 Lexington, KY | 1.0 | 1.0 | 1000 | $1,060 | $1.06 | 15d | 1 | 0.86mi |
| 355 S Broadway #305 Lexington, KY | 2.0 | 2.0 | 1436 | $2,900 | $2.02 | 24d | 1 | 0.90mi |
| 115 W Loudon Ave Unit L97 Lexington, KY | 3.0 | 2.0 | 960 | $980 | $1.02 | 24d | 1 | 0.90mi |
| 345 Blackburn Ave Lexington, KY | 2.0 | 2.0 | 946 | $1,925 | $2.03 | 15d | 1 | 0.96mi |
| 303 Owsley Ave Lexington, KY | 3.0 | 2.0 | 1188 | $2,100 | $1.77 | 15d | 1 | 1.01mi |
| 324 Hillcrest Ave Unit Z1 Lexington, KY | 3.0 | 2.0 | 1550 | $1,499 | $0.97 | 22d | 1 | 1.07mi |
| 330 Newtown Pike Lexington, KY | 1.0–3.0 | 1.0–2.0 | 976 | $1,205 | $1.23 | 24d | 1 | 1.08mi |
| 585 S Upper St #114 Lexington, KY | 2.0 | 2.0 | 1000 | $1,995 | $2.00 | 24d | 1 | 1.10mi |
| 832 W High St Unit 1 Lexington, KY | 3.0 | 1.5 | 900 | $1,400 | $1.56 | 24d | 1 | 1.15mi |
| 161 Preston Ave #3 Lexington, KY | 2.0 | 1.0 | 900 | $1,500 | $1.67 | 15d | 1 | 1.17mi |
| 1211 N Limestone Lexington, KY | 3.0 | 1.0 | 1300 | $1,050 | $0.81 | 24d | 1 | 1.18mi |
| 458 Morgan Ave Lexington, KY | 3.0 | 1.0 | 1275 | $1,325 | $1.04 | 24d | 1 | 1.21mi |
| 723 Charles Ave Lexington, KY | 3.0 | 1.0 | 992 | $1,300 | $1.31 | 15d | 1 | 1.22mi |
| 411 Morgan Ave Lexington, KY | 3.0 | 2.0 | 1160 | $1,600 | $1.38 | 22d | 1 | 1.22mi |
| 1105 Sparks Rd Lexington, KY | 3.0 | 1.0 | 1302 | $1,575 | $1.21 | 24d | 1 | 1.23mi |
| 232 Bassett Ave Lexington, KY | 2.0 | 1.0 | 989 | $1,495 | $1.51 | 15d | 1 | 1.24mi |
| 132 Bassett Ave Lexington, KY | 3.0 | 2.0 | 1850 | $2,900 | $1.57 | 22d | 1 | 1.28mi |
| 1120 Sparks Rd Lexington, KY | 3.0 | 1.0 | 1200 | $1,600 | $1.33 | 22d | 1 | 1.29mi |
Listing history 20 events
-
2026-06-18days on market $139,900 Active 55 DOM
-
2026-06-17days on market $139,900 Active 54 DOM
-
2026-06-16days on market $139,900 Active 53 DOM
-
2026-06-15days on market $139,900 Active 52 DOM
-
2026-06-14days on market $139,900 Active 50 DOM
-
2026-06-13days on market $139,900 Active 49 DOM
-
2026-06-10days on market $139,900 Active 47 DOM
-
2026-06-09days on market $139,900 Active 46 DOM
-
2026-06-08days on market $139,900 Active 45 DOM
-
2026-06-07days on market $139,900 Active 44 DOM
-
2026-06-05days on market $139,900 Active 41 DOM
-
2026-06-03days on market $139,900 Active 40 DOM
-
2026-06-02days on market $139,900 Active 39 DOM
-
2026-06-01days on market $139,900 Active 38 DOM
-
2026-05-31days on market $139,900 Active 37 DOM
-
2026-05-06price $139,900
-
2026-04-28price $144,999
-
2026-04-23$139,999 Active
-
2015-10-01soldstatus $16,000
-
2015-08-27soldstatus $20,000
ⓘ Source: listings_history table (triggers on properties + properties_extension) + one-shot
backfill from property_details.listing_events for pre-trigger history.
Tax reassessment forecast KY · Resets to sale price
- Current annual tax
- $423 · $35/mo
- Projected year-2 tax
- $1,203 · $100/mo
- Expected delta
- +$781/yr (+$65/mo · 184.7%)
ⓘ Screening estimate from a state-policy table — verify with the county assessor before closing.
Climate risk First Street
- Flood 4/10 Moderate FEMA zone X (unshaded) · 20% chance over 30 yrs
- Wildfire 1/10 Low
- Heat 4/10 Moderate 7 d/yr ≥101°F today · 19 d/yr by 30 yrs out
- Wind 2/10 Low 100% chance of damaging wind over 30 yrs
- Air quality 1/10 Low 0 unhealthy d/yr today · 0 by 30 yrs out
Nearby sold comps map
Loading sold comps map…
Walkable amenities ~0.75 mi
Loading nearby amenities…
Taxation est. · year 1
- Rental income
- $19,927
- − Mortgage interest
- −$7,837
- − Property taxes
- −$423
- − Insurance
- −$700
- − Repairs & maintenance
- −$1,594
- − Management
- −$1,594
- − Depreciation
- −$4,070
- Taxable income
- $3,710
- Est. tax owed @ 24.0%
- −$890
- After-tax cash flow
- $4,926/yr
For passive investors: Depreciation is non-cash, so a rental often shows a tax loss while cash-flowing — sheltering income. Rental losses are passive: they offset passive income freely, and up to $25,000/yr can offset ordinary (W-2) income if you actively participate and your MAGI is under $100k (phasing out to $0 by $150k); unused losses carry forward. On sale, claimed depreciation is recaptured at up to 25%, and gains may owe capital-gains tax (a 1031 exchange can defer both). Figures are a year-1 estimate at your 24.0% rate — not tax advice; consult a CPA.
Schools (NCES district)
- District
- Fayette County
- NCES district ID
- 2101860
- Math proficiency
- 35% ▼ -16.00%
- Reading proficiency
- 45% ▼ -13.00%
- Median HH income
- $49,245
- Composite
- 34.38/100
- National rank
- #5211
- State rank
- #27 of 165 in KY
Livability — Lexington-Fayette
No livability data for this city. (Only ~50 U.S. cities are tracked.)
Census & demographics
- Census place
- Lexington-Fayette, KY
- County
- Fayette County · 317,143 people
- City population
- 321,882
- Metro
- Lexington-Fayette, KY
- Population (ZIP)
- 23,756
- Household income
- $29,440
- Rent vs Own
- Severe rent burden
- 2644.0
Population outlook (Fayette County) Hauer SSP2
- Today (2025)
- 363,454 people
- By 2030
- 388,270 · +6.8%
- By 2040
- 438,688 · +20.7%
- By 2050
- 490,667 · +35.0%
- By 2075
- 625,394 · +72.1%
- By 2100
- 721,354 · +98.5%
Race, ethnicity, and origin ACS 2023
- Neighborhood character
- Diverse neighborhood (Simpson 0.58)
- Race & ethnicity
- White 60% Black 22% Hispanic / Latino 9% Two or more races 7% Asian 3%
- Hispanic origin (detail)
- Mexican 5%
- Common ancestry
- Serbian 2% Italian 2% Lithuanian 2%
- Foreign-born
- 9% · Canada, China
- Languages at home
- 87% English-only · Spanish 8% Chinese 1% Other Indo-European 1%
Political lean MEDSL · Fayette
- 2024 margin
- D (+18.1) · D 58.0% · R 39.9% · Other 2.1%
- 2008→2024 swing
- +13.3pp toward D · 2008: 4.8pp · 2024: 18.1pp
- All cycles
- 2024: D+18.1 2020: D+20.8 2016: D+9.5 2012: D+1.0 2008: D+4.8
Not yet ingested
- Civics
- —
Market trends
- HPI YoY
- ▼ -251.04%
- Current HPI
- 204.3994
- Rent YoY
- ▲ 11.83%
- Metro
- Lexington-Fayette, KY
- State GDP YoY
- ▲ 1.81%
- F500 in state
- 4
Industry mix (Fortune 500 HQ in KY)
| Industry | F500 HQs | Revenue |
|---|---|---|
| Healthcare | 1 | $118B |
|
||
| Food / Beverage | 1 | $7B |
|
||
Price history
+599.5% since first listed5 events — show timeline
- 2026-05-06 Price Changed $139,900 ImagineMLS
- 2026-04-28 Price Changed $144,999 ImagineMLS
- 2026-04-23 Listed $139,999 ImagineMLS
- 2015-10-01 Sold (Public Records) $16,000 Public Records
- 2015-08-27 Sold (Public Records) $20,000 Public Records
Property tax history
+1.8%/yrLatest (2015): $423 · +1.8% YoY. Source: county tax records.
Cash-flow waterfall
monthlySold comps — $/sqft
last 12 mo · ≤1 miLoading sold comps…