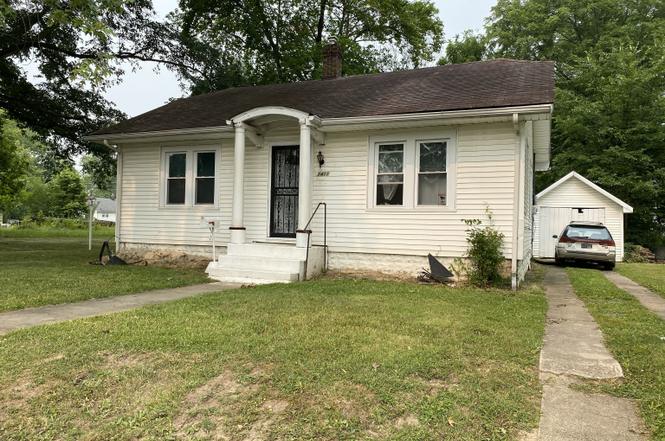
1411 Halford St · Anderson, IN
Flood risk 1/10 · Minimal
- FEMA flood zone
- X (unshaded)
- Chance of flooding over 30 yrs
- 0.0%
- Est. flood insurance / yr
- $473 – $860
Fire risk 1/10 · Minimal
- Est. fire insurance / yr
- $717 – $1,331
Heat risk 3/10 · Minor
- Hot days now (above 100°F)
- 7 days/yr
- Hot days in 30 yrs
- 18 days/yr
Wind risk 2/10 · Minimal
- Chance of severe wind over 30 yrs
- 0.0%
Air-quality risk 3/10 · Minor
- Unhealthy air days now
- 2 days/yr
- Unhealthy air days in 30 yrs
- 3 days/yr
Risk factors via First Street. Map © Google.
Why this score? — see what drove the B+ grade
The composite is a weighted blend of 9 inputs, each scored 0–100. Each bar is that input's sub-score; the figure is the points it added to the 100-point composite (weight × sub-score).
- Cash flow +30.0/30.0
- ARV discount +15.0/15.0
- 1% rule +10.0/10.0
- DSCR +10.0/10.0
- Rent growth +4.5/5.0
- Livability +3.0/5.0
- Condition / age +2.5/5.0
- Schools +1.6/10.0
- Appreciation +0.0/10.0
$56,900
🖨 Deal sheet 📄 Offer letter ✓ Due diligence
Listing remarks
Located at 1411 Halford ST, Anderson, IN, this single-family residence presents a great investment opportunity for the discerning buyer. Calling all handy homeowners and investors, this is your chance to transform potential into profit. With 832 square feet of living area offering endless possibilities, imagine crafting a welcoming atmosphere within the two bedrooms, each space ready to become a personalized haven. The full bathroom provides a canvas for rejuvenation, awaiting your design vision to transform it into a tranquil retreat. The generous 6350 square foot lot offers an expansive outdoor area, perfect for creating an inviting garden oasis or an entertainment space that extends the
Key facts
- Generous lot
- Vintage charm
- Outdoor area
Tags
Property features AI
Finance
- Other: Has additional parcels
Exterior
- Parking: Detached garage (1 car)
- Utilities: Public water; Municipal sewer connected; 100 amp electrical service; Electricity connected; Natural gas connected
- Home design: Single-family residence (attached property); One story; Property listed as fixer; Less than 1/4 acre lot
- Construction: Vinyl siding; Block foundation
- Exterior features: Covered porch; Storage shed; See remarks for lot details
Interior
- Kitchen: Electric oven; Refrigerator
- Bedrooms: 2 bedrooms on the main level
- Bathrooms: 1 full bathroom (main level)
- Heating & cooling: Forced air heating (natural gas); No central air
- Interior features: Attic access; Finished basement
- Laundry & utility: Natural gas connection
Neighborhood map
What this means for you Summary
Snapshot
- This is a 2-bed/1.0-bath single-family listed at $57k.
Deal economics
- At list price, monthly cash flow is $354 ($4k/yr) — positive.
- The deal already cash-flows at list — no discount required.
- Meets the 1% rule at list price ($946 rent vs $57k).
- Recommended offer: $50k (12.0% below list) — sets the bar for market timing.
- Cap rate 13.8% vs local median 6.5% in Anderson — top-decile yield for the area; either an underpriced asset or a hidden risk that comps aren't pricing in. Stress-test before assuming the spread holds.
Location & tenants
- Location reads 60/100 on livability (#521 in IN) — a middle-class / working-renter tenant base. Strengths: cost of living A+, housing A+; Watch: schools F, crime D-, amenities F.
- Anderson Community School Corporation (urban): math 15% / reading 23% proficiency, ranked #280 of 301 in IN (top 93%) — low school quality limits family demand, transient renter base, plan for 1-2y turnover; 70% free/reduced lunch — lower-income household profile, screen leases tightly.
- Market conditions: Rents rising fast (+7.9%/yr); 185 active listings in the ZIP; 40 comparable units currently listed for rent nearby; rentals at typical pace (median 24d on market — plan ~3-4 weeks tenant-placement turnaround); 48% of comp listings sitting > 30 days — soft ceiling on asking rent; lower-income renter base — watch delinquency; 184 units permitted in Madison County in 2024 (0 in 5+ unit buildings).
- This rent runs 31% of the median local income ($36k/yr) — at the standard rent-burdened threshold; future hikes will face affordability resistance.
Forward outlook
- Local home prices are declining (-3.0%/yr); year-one equity from $393 of loan paydown is wiped out by about $2k of value loss. Plan a longer hold.
- Madison County population projected at -14% by 2050 — secular population decline; favor cash flow + early exit over multi-decade hold.
- At projected returns (-3.0% appreciation + 7.9% rent growth), your $16k cash investment doubles in ~4 years — after that, you're playing with house money.
Negotiation context
- It's been on market 186 days — a 12% lower offer ($50k) is reasonable based on typical stale-listing flexibility.
- 5 sale attempts since 23y ago; this cycle's ask has dropped $13k (19%) from the opening price — seller is motivated, your offer sets the floor, not the list.
- Current owner paid $7k; list at $57k implies a 713% gain — meaningful room to come down on a strong offer.
Risks & watch-outs
- Watch-outs: built in 1929 — expect roof / HVAC / electrical / plumbing capex.
Questions for the listing agent
- It's been on market 186 days. Have you received any prior offers? Is the seller open to a 12% concession, seller financing, or rate buy-down credit?
- Built in 1929 — when were the roof, HVAC, electrical panel, plumbing, and water heater last replaced?
- Why hasn't it sold? Are there any deal-killer items the seller is aware of (foundation, flood, title, zoning, code violations)?
- Is there a deadline driving the sale (1031 exchange, divorce, estate, relocation)? That informs how much negotiation room exists.
- Schools are F-rated, which usually means shorter tenancies and higher turnover. Who's the typical renter profile here, and what's been the actual vacancy rate?
- Crime grade is D in this area — have there been break-ins, vandalism, or insurance claims at this property in the last 3 years? What carrier currently insures it and at what premium?
- What's the average days-on-market for RENTAL listings here right now (not sales)? A rising rental-DOM trend means longer vacancies and softer asking-rent achievability than the comps imply.
- What's the recent tenant-quality profile in this submarket — average credit score on applications, eviction rate, late-payment / NSF rate, and stable-employment percentage? A property-management company in the area should have these aggregated.
- How much new for-sale + rental construction is in the pipeline within 1–3 miles? Heavy new supply typically softens prices + rents 12–24 months out; constrained supply supports both.
Investment metrics
- 1% rule
- 1.66% ✓
- Cap rate
- 13.76%
- Cash-on-cash
- 26.65%
- DSCR
- 2.19
- GRM
- 5.0
CMA / ARV
- ARV (on-the-fly)
- $100,672
- Comps found
- 12
Show comp detail 12 sales within ~0.75 mi
| Address | Dist | Beds/Ba | Sqft | Sold | Price | $/sf | Match |
|---|---|---|---|---|---|---|---|
| 1423 Halford St | 0.03mi | 3/1.0 (+1) | 864 (+4%) | 2mo | $68,000 | $79 | 86 |
| 1632 W 17th St | 0.30mi | 2/1.0 | 840 (+1%) | 12mo | $38,000 | $45 | 74 |
| 2308 W 16th St | 0.21mi | 2/1.0 | 756 (-9%) | 3mo | $91,500 | $121 | 72 |
| 1830 Nichol Ave | 0.13mi | 2/1.0 | 943 (+13%) | 4mo | $55,000 | $58 | 68 |
| 1516 Fulton St | 0.18mi | 2/1.0 | 720 (-14%) | 3mo | $63,500 | $88 | 67 |
| 1812 Halford St | 0.28mi | 2/1.0 | 720 (-14%) | 3mo | $50,000 | $69 | 62 |
| 2241 Nelle St | 0.59mi | 2/1.0 | 796 (-4%) | 4mo | $66,500 | $84 | 62 |
| 1640 W 7th St | 0.57mi | 2/1.0 | 810 (-3%) | 12mo | $98,500 | $122 | 59 |
| 710 Henry St | 0.68mi | 3/1.0 (+1) | 864 (+4%) | 5mo | $108,900 | $126 | 53 |
| 2610 W 18th St | 0.49mi | 3/1.0 (+1) | 900 (+8%) | 13mo | $119,000 | $132 | 47 |
| 2310 Halford St | 0.64mi | 2/2.0 | 744 (-11%) | 2mo | $150,000 | $202 | 47 |
| 2517 Horton Dr | 0.50mi | 3/1.0 (+1) | 936 (+12%) | 12mo | $128,000 | $137 | 41 |
Match score weights: distance 35% · size 25% · config 20% · recency 20%. Top-matched comps best support the ARV.
Projected returns pro-forma
-3.0% appreciation · 7.88% rent growth · sell at horizon
- IRR
- 25.9%
- Equity multiple
- 2.14×
- Total profit
- $18,202
- Equity at exit
- $8,484
- IRR
- 36.5%
- Equity multiple
- 5.21×
- Total profit
- $67,043
- Equity at exit
- $4,920
Cash invested: $15,932 (down + closing). Projections, not guarantees.
Landlord ↔ Tenant lean methodology
- Overall (STATE)
- 90 Strongly Landlord-Friendly
- State Indiana
- 90 Strongly Landlord-Friendly · R+11
- County
- — inherits STATE
- City
- — inherits STATE
ZIP-level market 46016
- Home prices YoY
- -3.5%
- Rents YoY
- 7.9%
- Active inventory
- 185
- Price-to-rent
- 5.0×
Monthly cashflow live
- Estimated rent
- $946 high interval (Pro) →
- Mortgage (P&I)
- −$298
- Tax est. 1.5%
- −$71 /mo · $854/yr
- Insurance
- −$24
- HOA
- −$0
- Vacancy / Maint / Mgmt
- −$199
- Net cashflow
- $354
Break-even live
UW: 25.0% down · 7.5% · 30yr · 1.5% tax · 5.0% vac · 8.0% maint · 8.0% mgmt
Financing live
Cash to close
- Down payment
- $14,225
- Closing costs
- $1,707
- Reserves months
- —
- Total cash needed
- —
Loan-product check · same deal, 3 products live
Conventional
25% down · 7.5% · 30yr
- Down + closing
- —
- Monthly P&I
- —
- Monthly cashflow
- —
- DSCR
- —
- Eligible?
- —
Personal DTI + credit; lowest rate.
DSCR
20% down · 8.5% · 30yr
- Down + closing
- —
- Monthly P&I
- —
- Monthly cashflow
- —
- DSCR
- —
- Eligible?
- —
No personal income docs; deal must DSCR.
Hard money
10% down · 12.0% · 12mo
- Down + closing
- —
- Monthly P&I
- —
- Monthly cashflow
- —
- DSCR
- —
- Eligible?
- —
Short-term bridge; refi at stabilization.
Rent comps 40 comps
| Address | Beds | Baths | Sqft | Rent | $/sqft | DOM | Units | Dist |
|---|---|---|---|---|---|---|---|---|
| 1404 Walton St Anderson, IN | 3.0 | 1.0 | 1090 | $995 | $0.91 | 43d | 1 | 0.11mi |
| 1136 Irving Way Anderson, IN | 2.0 | 1.0 | 900 | $895 | $0.99 | 21d | 1 | 0.15mi |
| 1123 Louise St Anderson, IN | 2.0 | 1.0 | 850 | $850 | $1.00 | 43d | 1 | 0.17mi |
| 1720 Nelle St Anderson, IN | 2.0 | 1.0 | 768 | $1,100 | $1.43 | 23d | 1 | 0.28mi |
| 1640 W 17th St Anderson, IN | 2.0 | 1.0 | 810 | $895 | $1.10 | 20d | 1 | 0.30mi |
| 1616 W 16th St Anderson, IN | 2.0 | 1.0 | 1038 | $1,050 | $1.01 | 43d | 1 | 0.31mi |
| 1614 W 18th St Anderson, IN | 2.0 | 1.0 | 690 | $975 | $1.41 | 23d | 1 | 0.38mi |
| 2004 Arrow Ave Anderson, IN | 2.0 | 1.0 | 816 | $1,125 | $1.38 | 23d | 1 | 0.46mi |
| 1708 W 7th St Anderson, IN | 1.0 | 1.0 | 700 | $1,000 | $1.43 | 43d | 1 | 0.52mi |
| 1708 W 7th St Anderson, IN | 1.0 | 1.0 | 700 | $875 | $1.25 | 17d | 1 | 0.52mi |
| 1708 W 7th St Anderson, IN | 1.0 | 1.0 | 700 | $875 | $1.25 | 19d | 1 | 0.52mi |
| 1631 W 7th St Anderson, IN | 3.0 | 1.0 | 900 | $1,000 | $1.11 | 43d | 1 | 0.53mi |
| 1222 Nichol Ave Unit 4 Anderson, IN | 3.0 | 1.0 | 1000 | $1,135 | $1.14 | 7d | 1 | 0.55mi |
| 1627 W 6th St Anderson, IN | 2.0 | 1.0 | 650 | $850 | $1.31 | 23d | 1 | 0.59mi |
| 2705 Horton Dr Anderson, IN | 3.0 | 1.0 | 936 | $1,050 | $1.12 | 20d | 1 | 0.60mi |
| 1502 Cedar St Anderson, IN | 2.0 | 1.0 | 1104 | $850 | $0.77 | 43d | 1 | 0.65mi |
| 1312 W 8th St Unit 1332 F Anderson, IN | 2.0 | 1.0 | 850 | $979 | $1.15 | 43d | 1 | 0.69mi |
| 1312 W 8th St Unit 1308H Anderson, IN | 1.0 | 1.0 | 750 | $999 | $1.33 | 14d | 1 | 0.69mi |
| 1529 W 2nd St Anderson, IN | 3.0 | 1.0 | 884 | $1,200 | $1.36 | 23d | 1 | 0.85mi |
| 2613 Louise St Anderson, IN | 2.0 | 1.0 | 1096 | $950 | $0.87 | 21d | 1 | 0.88mi |
| 1020 W 5th St Unit 1022 Anderson, IN | 1.0 | 1.0 | 550 | $750 | $1.36 | 43d | 1 | 0.89mi |
| 803 1/2 W 9th St Anderson, IN | 1.0 | 1.0 | 600 | $525 | $0.88 | 43d | 1 | 0.93mi |
| 925 W 5th St Unit 1 Anderson, IN | 1.0 | 1.0 | 617 | $775 | $1.26 | 16d | 1 | 0.93mi |
| 2208 Hendricks St Unit 3 Anderson, IN | 1.0 | 1.0 | 585 | $675 | $1.15 | 43d | 1 | 0.94mi |
| 1708 Euclid Dr Anderson, IN | 2.0 | 1.0 | 732 | $1,225 | $1.67 | 43d | 1 | 0.94mi |
| 2719 Dewey St Anderson, IN | 2.0 | 1.0 | 877 | $1,150 | $1.31 | 43d | 1 | 0.95mi |
| 924 W 5th St Unit 924 Anderson, IN | 1.0 | 1.0 | 750 | $600 | $0.80 | 23d | 1 | 0.95mi |
| 924 W 5th St Unit 928 Anderson, IN | 1.0 | 1.0 | 600 | $600 | $1.00 | 43d | 1 | 0.95mi |
| 2203 W 28th St Anderson, IN | 3.0 | 1.0 | 1068 | $1,000 | $0.94 | 43d | 1 | 0.99mi |
| 2411 Hendricks St Anderson, IN | 3.0 | 1.0 | 860 | $1,000 | $1.16 | 23d | 1 | 1.01mi |
| 618 W 22nd St Anderson, IN | 3.0 | 1.0 | 900 | $1,250 | $1.39 | 43d | 1 | 1.04mi |
| 702 W 23rd St Anderson, IN | 1.0 | 1.0 | 560 | $595 | $1.06 | 4d | 1 | 1.04mi |
| 215 S Madison Ave Anderson, IN | 1.0 | 1.0 | 600 | $650 | $1.08 | 43d | 1 | 1.04mi |
| 213 Madison Ave Anderson, IN | 1.0 | 1.0 | 600 | $650 | $1.08 | 43d | 1 | 1.04mi |
| 2301 Sheridan St Anderson, IN | 2.0 | 1.0 | 900 | $950 | $1.06 | 43d | 1 | 1.05mi |
| 1010 W 2nd St Unit 1 Anderson, IN | 1.0 | 1.0 | 724 | $925 | $1.28 | 23d | 1 | 1.06mi |
| 1010 W 2nd St Unit 3 Anderson, IN | 3.0 | 1.0 | 1025 | $1,125 | $1.10 | 14d | 1 | 1.06mi |
| 1010 W 2nd St Unit 2 Anderson, IN | 2.0 | 1.0 | 875 | $1,025 | $1.17 | 21d | 1 | 1.06mi |
| 2442 Morton St Anderson, IN | 2.0 | 1.0 | 862 | $1,125 | $1.31 | 23d | 1 | 1.25mi |
| 519 W 2nd St Anderson, IN | 1.0 | 1.0 | 650 | $800 | $1.23 | 43d | 1 | 1.27mi |
Listing history 6 events
-
2026-06-18days on market $56,900 Active 186 DOM
-
2026-06-17days on market $56,900 Active 185 DOM
-
2026-06-16days on market $56,900 Active 184 DOM
-
2026-06-15days on market $56,900 Active 183 DOM
-
2026-06-13remarks 699-char remark
-
2026-06-13$56,900 Active 181 DOM
ⓘ Source: listings_history table (triggers on properties + properties_extension) + one-shot
backfill from property_details.listing_events for pre-trigger history.
Climate risk First Street
- Flood 1/10 Low FEMA zone X (unshaded) · 0% chance over 30 yrs
- Wildfire 1/10 Low
- Heat 3/10 Moderate 7 d/yr ≥100°F today · 18 d/yr by 30 yrs out
- Wind 2/10 Low 0% chance of damaging wind over 30 yrs
- Air quality 3/10 Moderate 2 unhealthy d/yr today · 3 by 30 yrs out
Nearby sold comps map
Loading sold comps map…
Walkable amenities ~0.75 mi
Loading nearby amenities…
Taxation est. · year 1
- Rental income
- $11,348
- − Mortgage interest
- −$3,187
- − Property taxes
- −$854
- − Insurance
- −$284
- − Repairs & maintenance
- −$908
- − Management
- −$908
- − Depreciation
- −$1,655
- Taxable income
- $3,551
- Est. tax owed @ 24.0%
- −$852
- After-tax cash flow
- $3,394/yr
For passive investors: Depreciation is non-cash, so a rental often shows a tax loss while cash-flowing — sheltering income. Rental losses are passive: they offset passive income freely, and up to $25,000/yr can offset ordinary (W-2) income if you actively participate and your MAGI is under $100k (phasing out to $0 by $150k); unused losses carry forward. On sale, claimed depreciation is recaptured at up to 25%, and gains may owe capital-gains tax (a 1031 exchange can defer both). Figures are a year-1 estimate at your 24.0% rate — not tax advice; consult a CPA.
Schools (NCES district)
- District
- Anderson Community School Corporation
- NCES district ID
- 1800150
- Math proficiency
- 15% ▼ -14.00%
- Reading proficiency
- 23% ▼ -7.00%
- Median HH income
- $38,208
- Composite
- 15.93/100
- National rank
- #9250
- State rank
- #280 of 301 in IN
Livability — Anderson
- Score
- 60/100
- State rank
- #521
- US rank
- #18709
Category grades
Schools grade is shown separately in the Schools card above.
Census & demographics
- Census place
- Anderson, IN
- County
- Madison County · 69,445 people
- City population
- 57,762
- Metro
- Indianapolis-Carmel-Anderson, IN
- Population (ZIP)
- 17,834
- Household income
- $36,029
- Rent vs Own
- Severe rent burden
- 1193.0
Population outlook (Madison County) Hauer SSP2
- Today (2025)
- 125,800 people
- By 2030
- 122,640 · -2.5%
- By 2040
- 115,420 · -8.3%
- By 2050
- 108,148 · -14.0%
- By 2075
- 91,838 · -27.0%
- By 2100
- 75,670 · -39.8%
Race, ethnicity, and origin ACS 2023
- Neighborhood character
- Diverse neighborhood (Simpson 0.58)
- Race & ethnicity
- White 61% Black 18% Hispanic / Latino 13% Two or more races 11% Native American 1%
- Hispanic origin (detail)
- Mexican 10% Puerto Rican 1%
- Common ancestry
- Italian 2% Slovak 1% Iranian 1%
- Foreign-born
- 4% · Canada
- Languages at home
- 86% English-only · Spanish 12%
Political lean MEDSL · Madison
- 2024 margin
- Strong R (+26.9) · D 35.6% · R 62.5% · Other 1.9%
- 2008→2024 swing
- -33.5pp toward R · 2008: 6.5pp · 2024: -26.9pp
- All cycles
- 2024: R+26.9 2020: R+22.6 2016: R+25.7 2012: R+4.5 2008: D+6.5
Not yet ingested
- Civics
- —
Market trends
- HPI YoY
- ▼ -11.12%
- Current HPI
- 302.7437
- Rent YoY
- ▲ 7.88%
- Metro
- Indianapolis-Carmel-Anderson, IN
- State GDP YoY
- ▲ 2.90%
- F500 in state
- 18
Industry mix (Fortune 500 HQ in IN)
| Industry | F500 HQs | Revenue |
|---|---|---|
| Industrial Machinery | 2 | $37B |
|
||
| Healthcare | 1 | $177B |
|
||
| Pharmaceuticals | 1 | $45B |
|
||
| Metals / Steel | 1 | $18B |
|
||
| Agriculture | 1 | $17B |
|
||
| Packaging | 1 | $12B |
|
||
Price history
+128.5% since first listed11 events — show timeline
- 2026-06-11 Price Changed $56,900 MIBOR as Distributed by MLS Grid
- 2026-06-11 Relisted — MIBOR as Distributed by MLS Grid
- 2026-04-24 Listing Removed — MIBOR as Distributed by MLS Grid
- 2025-10-24 Listed $69,900 MIBOR as Distributed by MLS Grid
- 2023-09-25 Listing Removed — MIBOR as Distributed by MLS Grid
- 2023-09-14 Price Changed $59,900 MIBOR as Distributed by MLS Grid
- 2023-08-06 Listed $64,900 MIBOR as Distributed by MLS Grid
- 2005-11-29 Sold (MLS) $7,000 MIBOR as Distributed by MLS Grid
- 2005-10-26 Listed $7,000 MIBOR as Distributed by MLS Grid
- 2004-05-07 Listing Removed — MIBOR as Distributed by MLS Grid
- 2003-11-10 Listed $24,900 MIBOR as Distributed by MLS Grid
Cash-flow waterfall
monthlySold comps — $/sqft
last 12 mo · ≤1 miLoading sold comps…