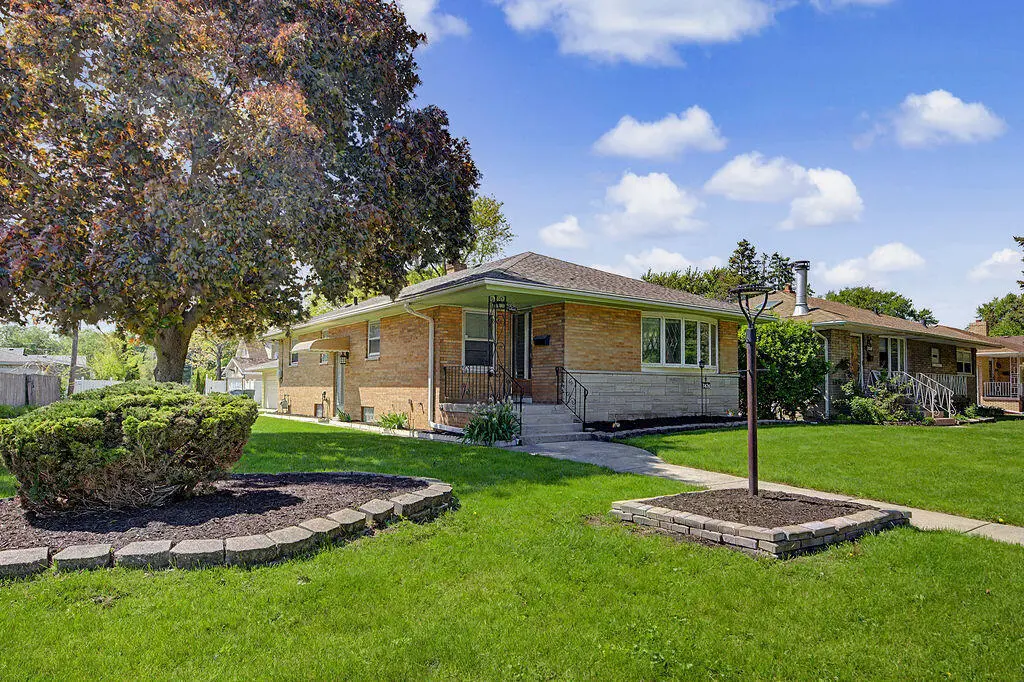
7426 Park Pl · Hammond, IN
Flood risk 4/10 · Minor
- FEMA flood zone
- X (shaded)
- Chance of flooding over 30 yrs
- 0.22%
- Est. flood insurance / yr
- $473 – $860
Fire risk 1/10 · Minimal
- Est. fire insurance / yr
- $717 – $1,331
Heat risk 3/10 · Minor
- Hot days now (above 102°F)
- 7 days/yr
- Hot days in 30 yrs
- 15 days/yr
Wind risk 2/10 · Minimal
- Chance of severe wind over 30 yrs
- 0.0%
Air-quality risk 4/10 · Minor
- Unhealthy air days now
- 5 days/yr
- Unhealthy air days in 30 yrs
- 6 days/yr
Risk factors via First Street. Map © Google.
Why this score? — see what drove the F grade
The composite is a weighted blend of 9 inputs, each scored 0–100. Each bar is that input's sub-score; the figure is the points it added to the 100-point composite (weight × sub-score).
- ARV discount +7.5/15.0
- Cash flow +4.7/30.0
- Rent growth +3.9/5.0
- Livability +3.5/5.0
- Condition / age +2.5/5.0
- Schools +1.1/10.0
- 1% rule +0.0/10.0
- DSCR +0.0/10.0
- Appreciation +0.0/10.0
$330,000
🖨 Deal sheet (PDF) 📄 Offer letter ✓ Due diligence
Listing remarks MLS
Well Maintained BRCK RANCH with 2 Car Garage and Attached Enclosed Room. Inground Sprinkler System. Large Living room, Kitchen offer nice amount of Cabinets, All Appliances Stay! Three Nice size Bedrooms. Full Basement offers Spacious Rec-room. Large Laundry room. GREAT PLACE TO CALL HOME!
Key facts
- Modernized kitchen
- Lower-level adu
- Corner lot
Tags
Property features AI
Exterior
- Parking: Detached garage with alley access and garage facing side; 2 garage spaces
- Security: Carbon monoxide detector(s); Smoke detector(s)
- Utilities: Public water; Public sewer
- Home design: One-story home; Built in 1957
- Construction: Brick construction; Asphalt shingle roof; Finished basement
- Exterior features: Front porch; Neighborhood view; Garage(s) on property
Interior
- Kitchen: Built-in gas range; Granite counters; Eat-in kitchen
- Bedrooms: Primary bedroom; Four additional bedrooms (total 5 bedrooms)
- Flooring: Hardwood floors
- Bathrooms: 2 full bathrooms
- Heating & cooling: Central heating (natural gas); Central air conditioning
- Interior features: Eat-in kitchen; Recessed lighting; In-law floorplan; Granite counters; Finished full basement with interior entry and sump pump; Carbon monoxide and smoke detectors
- Laundry & utility: Laundry room on lower level; Washer hookup; Gas dryer hookup; Washer and dryer included
Neighborhood map
What this means for you Summary
Snapshot
- This is a 3-bed/1.0-bath single-family listed at $330k.
Deal economics
- At list price, monthly cash flow is $-826 ($-10k/yr) — negative.
- To cash-flow at today's rent, offer at most $184k (44.2% below list).
- To meet the 1% rule (rent ≥ 1% of price), the offer needs to be $156k (52.9% below list).
- Recommended offer: $156k (52.9% below list) — sets the bar for 1% rule.
- Cap rate 3.3% vs local median 5.8% in Hammond — below-typical yield; the buyer is paying a premium for something (appreciation thesis, condition, location) that the cap rate doesn't capture.
Location & tenants
- Location reads 70/100 on livability (#143 in IN) — a middle-class / working-renter tenant base. Strengths: cost of living A+, housing A+, commute A; Watch: health & safety D+, employment D, crime F.
- School City Of Hammond (suburban): math 8% / reading 18% proficiency, ranked #289 of 301 in IN (top 96%) — low school quality limits family demand, transient renter base, plan for 1-2y turnover; 74% free/reduced lunch — lower-income household profile, screen leases tightly.
- Zoned schools: Kenwood Elementary School (math 12% / reading 12%, grade F, #893 of 994 statewide, top 91%, 253 students, 71% FRL); Henry W Eggers Middle School (math 5% / reading 17%, grade F, #312 of 330 statewide, top 95%, 855 students, 76% FRL); Hammond Central High School (math 8% / reading 37%, grade F, #339 of 369 statewide, top 93%, 1,863 students, 73% FRL) — zoned schools at 73% FRL track the district average.
- Market conditions: Rents rising fast (+5.5%/yr); 63 active listings in the ZIP; 18 comparable units currently listed for rent nearby; rentals at typical pace (median 14d on market — plan ~3-4 weeks tenant-placement turnaround); 1,642 units permitted in Lake County in 2024 (14 in 5+ unit buildings).
Forward outlook
- Local home prices are declining (-3.0%/yr); year-one equity from $2k of loan paydown is wiped out by about $10k of value loss. Plan a longer hold.
- Lake County population projected to shrink 7% by 2050 — rents likely to lag national; underwrite the cash flow, not the appreciation.
Negotiation context
- Only 3 days on market — expect competitive offers; lowballing is unlikely to land.
- 2 sale attempts since 3y ago with the ask held roughly flat each time — persistent listings suggest the price (not the market) is what's stuck; bring a comps-based counter.
- Current owner paid $218k; list at $330k implies a 52% gain — meaningful room to come down on a strong offer.
Risks & watch-outs
- Watch-outs: built in 1957 — expect roof / HVAC / electrical / plumbing capex.
Questions for the listing agent
- What do current leases actually rent for vs. the listed asking? Can we see a recent rent roll and the last 12 months of T-12 income?
- Built in 1957 — when were the roof, HVAC, electrical panel, plumbing, and water heater last replaced?
- Is there a deadline driving the sale (1031 exchange, divorce, estate, relocation)? That informs how much negotiation room exists.
- Schools are F-rated, which usually means shorter tenancies and higher turnover. Who's the typical renter profile here, and what's been the actual vacancy rate?
- Crime grade is F in this area — have there been break-ins, vandalism, or insurance claims at this property in the last 3 years? What carrier currently insures it and at what premium?
- The area grade is low — what's the realistic commute time and amenity access for the typical tenant pool here? Any planned neighborhood developments (good or bad) we should know about?
- What's the average days-on-market for RENTAL listings here right now (not sales)? A rising rental-DOM trend means longer vacancies and softer asking-rent achievability than the comps imply.
- What's the recent tenant-quality profile in this submarket — average credit score on applications, eviction rate, late-payment / NSF rate, and stable-employment percentage? A property-management company in the area should have these aggregated.
- How much new for-sale + rental construction is in the pipeline within 1–3 miles? Heavy new supply typically softens prices + rents 12–24 months out; constrained supply supports both.
Investment metrics
- 1% rule
- 0.47% ✗
- Cap rate
- 3.29%
- Cash-on-cash
- -10.73%
- DSCR
- 0.52
- GRM
- 17.7
CMA / ARV
- ARV (on-the-fly)
- $214,725
- Comps found
- 12
Show comp detail 12 sales within ~0.75 mi
| Address | Dist | Beds/Ba | Sqft | Sold | Price | $/sf | Match |
|---|---|---|---|---|---|---|---|
| 7741 Hohman Ave | 0.42mi | 2/1.0 (-1) | 1,193 (-3%) | 4mo | $230,000 | $193 | 68 |
| 17526 Shirley Dr | 0.47mi | 3/1.5 | 1,175 (-4%) | 3mo | $120,000 | $102 | 66 |
| 1678 State Line Rd | 0.49mi | 3/1.0 | 1,126 (-8%) | 3mo | $158,000 | $140 | 61 |
| 7341 Harrison Ave | 0.23mi | 4/2.0 (+1) | 1,365 (+11%) | 2mo | $201,995 | $148 | 60 |
| 35 166th Pl | 0.72mi | 4/1.0 (+1) | 1,217 (-1%) | 1mo | $149,500 | $123 | 60 |
| 7613 Monroe Ave | 0.46mi | 4/1.0 (+1) | 1,330 (+8%) | 1mo | $196,000 | $147 | 59 |
| 7511 Monroe Ave | 0.41mi | 3/1.0 | 1,072 (-13%) | 3mo | $199,000 | $186 | 58 |
| 7607 Monroe Ave | 0.45mi | 2/1.5 (-1) | 1,092 (-11%) | 3mo | $179,900 | $165 | 51 |
| 3634 178th St | 0.59mi | 3/2.0 | 1,350 (+10%) | 3mo | $277,000 | $205 | 49 |
| 17204 Bernadine St | 0.69mi | 3/2.0 | 1,340 (+9%) | 1mo | $234,000 | $175 | 48 |
| 7840 Monroe Ave | 0.66mi | 3/1.0 | 1,379 (+12%) | 1mo | $320,000 | $232 | 48 |
| 1636 State Line Rd | 0.56mi | 3/3.0 | 1,084 (-12%) | 2mo | $241,000 | $222 | 45 |
Match score weights: distance 35% · size 25% · config 20% · recency 20%. Top-matched comps best support the ARV.
Projected returns pro-forma
-3.0% appreciation · 5.51% rent growth · sell at horizon
- IRR
- -33.5%
- Equity multiple
- -0.11×
- Total profit
- $-102,172
- Equity at exit
- $49,204
- IRR
- -31.2%
- Equity multiple
- -0.51×
- Total profit
- $-139,782
- Equity at exit
- $28,532
Cash invested: $92,400 (down + closing). Projections, not guarantees.
Landlord ↔ Tenant lean methodology
- Overall (STATE)
- 90 Strongly Landlord-Friendly
- State Indiana
- 90 Strongly Landlord-Friendly · R+11
- County
- — inherits STATE
- City
- — inherits STATE
ZIP-level market 46324
- Home prices YoY
- -9.6%
- Rents YoY
- 5.5%
- Active inventory
- 63
- Price-to-rent
- 17.7×
Monthly cashflow live
- Estimated rent
- $1,556 high interval (Pro) →
- Mortgage (P&I)
- −$1,731
- Tax from tax record
- −$187 /mo · $2,245/yr
- Insurance
- −$138
- HOA
- −$0
- Vacancy / Maint / Mgmt
- −$327
- Net cashflow
- $-826
Break-even live
Sensitivity live
| Price | -10% $-639 | -5% $-733 | +0% $-826 | +5% $-919 | +10% $-1,013 |
|---|---|---|---|---|---|
| Rent | -10% $-949 | -5% $-887 | +0% $-826 | +5% $-765 | +10% $-703 |
| Rate | -1.0pp $-660 | -0.5pp $-742 | base $-826 | +0.5pp $-912 | +1.0pp $-999 |
UW: 25.0% down · 7.5% · 30yr · 1.5% tax · 5.0% vac · 8.0% maint · 8.0% mgmt
Financing live
Cash to close
- Down payment
- $82,500
- Closing costs
- $9,900
- Reserves months
- —
- Total cash needed
- —
Loan-product check · same deal, 3 products live
Conventional
25% down · 7.5% · 30yr
- Down + closing
- —
- Monthly P&I
- —
- Monthly cashflow
- —
- DSCR
- —
- Eligible?
- —
Personal DTI + credit; lowest rate.
DSCR
20% down · 8.5% · 30yr
- Down + closing
- —
- Monthly P&I
- —
- Monthly cashflow
- —
- DSCR
- —
- Eligible?
- —
No personal income docs; deal must DSCR.
Hard money
10% down · 12.0% · 12mo
- Down + closing
- —
- Monthly P&I
- —
- Monthly cashflow
- —
- DSCR
- —
- Eligible?
- —
Short-term bridge; refi at stabilization.
Rent comps 18 comps
| Address | Beds | Baths | Sqft | Rent | $/sqft | DOM | Units | Dist |
|---|---|---|---|---|---|---|---|---|
| 3649 173rd Ct Lansing, IL | 2.0 | 2.0 | 972 | $1,357 | $1.40 | 26d | 1 | 0.36mi |
| 17104 Wentworth Ave Unit 4 Lansing, IL | 2.0 | 1.0 | 1100 | $1,400 | $1.27 | 0d | 1 | 0.69mi |
| 1539 Wentworth Ave Unit 3W Calumet City, IL | 3.0 | 1.0 | 1100 | $1,700 | $1.55 | 14d | 1 | 0.89mi |
| 7234 Columbia Ave Hammond, IN | 2.0 | 1.0 | 960 | $1,300 | $1.35 | 26d | 1 | 1.04mi |
| 7129 Columbia Ave Unit 1E Hammond, IN | 2.0 | 1.0 | 900 | $1,195 | $1.33 | 13d | 1 | 1.12mi |
| 3069 Bernice Rd Apt 2N Lansing, IL | 3.0 | 1.0 | 950 | $1,535 | $1.62 | 22d | 1 | 1.16mi |
| 3069 Bernice Rd Apt 2S Lansing, IL | 3.0 | 1.0 | 950 | $1,535 | $1.62 | 4d | 1 | 1.16mi |
| 3023 Bernice Rd Apt 2S Lansing, IL | 3.0 | 1.0 | 1000 | $1,600 | $1.60 | 0d | 1 | 1.22mi |
| 3023 Bernice Rd Unit 3030 3N Lansing, IL | 3.0 | 1.0 | 1000 | $1,400 | $1.40 | 0d | 1 | 1.22mi |
| 3007 Bernice Rd Unit 3007 1S Lansing, IL | 2.0 | 1.0 | 850 | $1,400 | $1.65 | 0d | 1 | 1.24mi |
| 3020 178th St Unit C1 Lansing, IL | 2.0 | 1.0 | 900 | $1,550 | $1.72 | 0d | 1 | 1.30mi |
| 3020 178th St Apt C7 Lansing, IL | 2.0 | 1.0 | 900 | $1,550 | $1.72 | 26d | 1 | 1.30mi |
| 18335 Sherman St Unit 3 Lansing, IL | 3.0 | 1.0 | 1000 | $1,700 | $1.70 | 0d | 1 | 1.33mi |
| 1338 Wentworth Ave Unit 1338 Calumet City, IL | 2.0 | 1.0 | 800 | $1,430 | $1.79 | 26d | 1 | 1.34mi |
| 7609 Beech Ave Hammond, IN | 2.0 | 1.0 | 700 | $1,400 | $2.00 | 5d | 1 | 1.37mi |
| 7019 Chestnut Ave Hammond, IN | 3.0 | 1.5 | 1440 | $1,895 | $1.32 | 22d | 1 | 1.40mi |
| 407 Kenwood St Hammond, IN | 2.0 | 1.0 | 920 | $1,495 | $1.62 | 26d | 1 | 1.48mi |
| 407 Kenwood St Hammond, IN | 2.0 | 1.0 | 920 | $1,495 | $1.62 | 18d | 1 | 1.48mi |
Listing history 4 events
-
2026-05-23$330,000 Active
-
2023-07-07soldstatus $217,500 Closed 290-char remark
Show marketing remark (290 chars)
Well Maintained BRCK RANCH with 2 Car Garage and Attached Enclosed Room. Inground Sprinkler System. Large Living room, Kitchen offer nice amount of Cabinets, All Appliances Stay! Three Nice size Bedrooms. Full Basement offers Spacious Rec-room. Large Laundry room. GREAT PLACE TO CALL HOME!
-
2023-06-15status Pending 290-char remark
Show marketing remark (290 chars)
Well Maintained BRCK RANCH with 2 Car Garage and Attached Enclosed Room. Inground Sprinkler System. Large Living room, Kitchen offer nice amount of Cabinets, All Appliances Stay! Three Nice size Bedrooms. Full Basement offers Spacious Rec-room. Large Laundry room. GREAT PLACE TO CALL HOME!
-
2023-06-09$219,900 Active 290-char remark
Show marketing remark (290 chars)
Well Maintained BRCK RANCH with 2 Car Garage and Attached Enclosed Room. Inground Sprinkler System. Large Living room, Kitchen offer nice amount of Cabinets, All Appliances Stay! Three Nice size Bedrooms. Full Basement offers Spacious Rec-room. Large Laundry room. GREAT PLACE TO CALL HOME!
ⓘ Source: listings_history table (triggers on properties + properties_extension) + one-shot
backfill from property_details.listing_events for pre-trigger history.
Tax reassessment forecast IN · Partial reset (capped growth)
- Current annual tax
- $2,245 · $187/mo
- Projected year-2 tax
- $2,525 · $210/mo
- Expected delta
- +$280/yr (+$23/mo · 12.5%)
ⓘ Screening estimate from a state-policy table — verify with the county assessor before closing.
Climate risk First Street
- Flood 4/10 Moderate FEMA zone X (shaded) · 22% chance over 30 yrs
- Wildfire 1/10 Low
- Heat 3/10 Moderate 7 d/yr ≥102°F today · 15 d/yr by 30 yrs out
- Wind 2/10 Low 0% chance of damaging wind over 30 yrs
- Air quality 4/10 Moderate 5 unhealthy d/yr today · 6 by 30 yrs out
Nearby sold comps map
Loading sold comps map…
Walkable amenities ~0.75 mi
Loading nearby amenities…
Taxation est. · year 1
- Rental income
- $18,670
- − Mortgage interest
- −$18,485
- − Property taxes
- −$2,245
- − Insurance
- −$1,650
- − Repairs & maintenance
- −$1,494
- − Management
- −$1,494
- − Depreciation
- −$9,600
- Taxable loss
- −$16,297
- Est. tax savings @ 24.0%
- +$3,911
- After-tax cash flow
- $-6,001/yr
For passive investors: Depreciation is non-cash, so a rental often shows a tax loss while cash-flowing — sheltering income. Rental losses are passive: they offset passive income freely, and up to $25,000/yr can offset ordinary (W-2) income if you actively participate and your MAGI is under $100k (phasing out to $0 by $150k); unused losses carry forward. On sale, claimed depreciation is recaptured at up to 25%, and gains may owe capital-gains tax (a 1031 exchange can defer both). Figures are a year-1 estimate at your 24.0% rate — not tax advice; consult a CPA.
Schools (NCES district)
- District
- School City Of Hammond
- NCES district ID
- 1804320
- Math proficiency
- 8% ▼ -18.00%
- Reading proficiency
- 18% ▼ -15.00%
- Median HH income
- $39,970
- Composite
- 11.11/100
- National rank
- #9730
- State rank
- #289 of 301 in IN
Livability — Hammond
- Score
- 70/100
- State rank
- #143
- US rank
- #7343
Category grades
Schools grade is shown separately in the Schools card above.
Census & demographics
- Census place
- Hammond, IN
- County
- Lake County · 422,878 people
- City population
- 58,809
- Metro
- Chicago-Naperville-Elgin, IL-IN-WI
- Population (ZIP)
- 21,409
- Household income
- $63,052
- Rent vs Own
- Severe rent burden
- 507.0
Population outlook (Lake County) Hauer SSP2
- Today (2025)
- 484,026 people
- By 2030
- 478,091 · -1.2%
- By 2040
- 462,974 · -4.3%
- By 2050
- 449,894 · -7.1%
- By 2075
- 436,169 · -9.9%
- By 2100
- 426,607 · -11.9%
Race, ethnicity, and origin ACS 2023
- Neighborhood character
- Diverse neighborhood (Simpson 0.69)
- Race & ethnicity
- Hispanic / Latino 39% White 34% Black 22% Two or more races 14% Asian 1% Native American 1%
- Hispanic origin (detail)
- Mexican 31% Puerto Rican 5%
- Common ancestry
- Romanian 5% Lithuanian 1% Italian 1%
- Foreign-born
- 10% · Canada
- Languages at home
- 79% English-only · Spanish 20%
Political lean MEDSL · Lake
- 2024 margin
- Lean D (+5.6) · D 52.1% · R 46.5% · Other 1.5%
- 2008→2024 swing
- -28.6pp toward R · 2008: 34.3pp · 2024: 5.6pp
- All cycles
- 2024: D+5.6 2020: D+15.1 2016: D+20.6 2012: D+31.0 2008: D+34.3
Not yet ingested
- Civics
- —
Market trends
- HPI YoY
- ▼ -37.65%
- Current HPI
- 352.8678
- Rent YoY
- ▲ 5.51%
- Metro
- Chicago-Naperville-Elgin, IL-IN-WI
- State GDP YoY
- ▲ 2.90%
- F500 in state
- 18
Industry mix (Fortune 500 HQ in IN)
| Industry | F500 HQs | Revenue |
|---|---|---|
| Industrial Machinery | 2 | $37B |
|
||
| Healthcare | 1 | $177B |
|
||
| Pharmaceuticals | 1 | $45B |
|
||
| Metals / Steel | 1 | $18B |
|
||
| Agriculture | 1 | $17B |
|
||
| Packaging | 1 | $12B |
|
||
Price history
+50.1% since first listed4 events — show timeline
- 2026-05-23 Listed $330,000 NIRA MLS as Distributed by MLS Grid
- 2023-07-07 Sold (MLS) $217,500 NIRA MLS as Distributed by MLS Grid
- 2023-06-15 Pending — NIRA MLS as Distributed by MLS Grid
- 2023-06-09 Listed $219,900 NIRA MLS as Distributed by MLS Grid
Property tax history
+2.1%/yrLatest (2024): $2,245 · -7.3% YoY. Source: county tax records.
Cash-flow waterfall
monthlySold comps — $/sqft
last 12 mo · ≤1 miLoading sold comps…