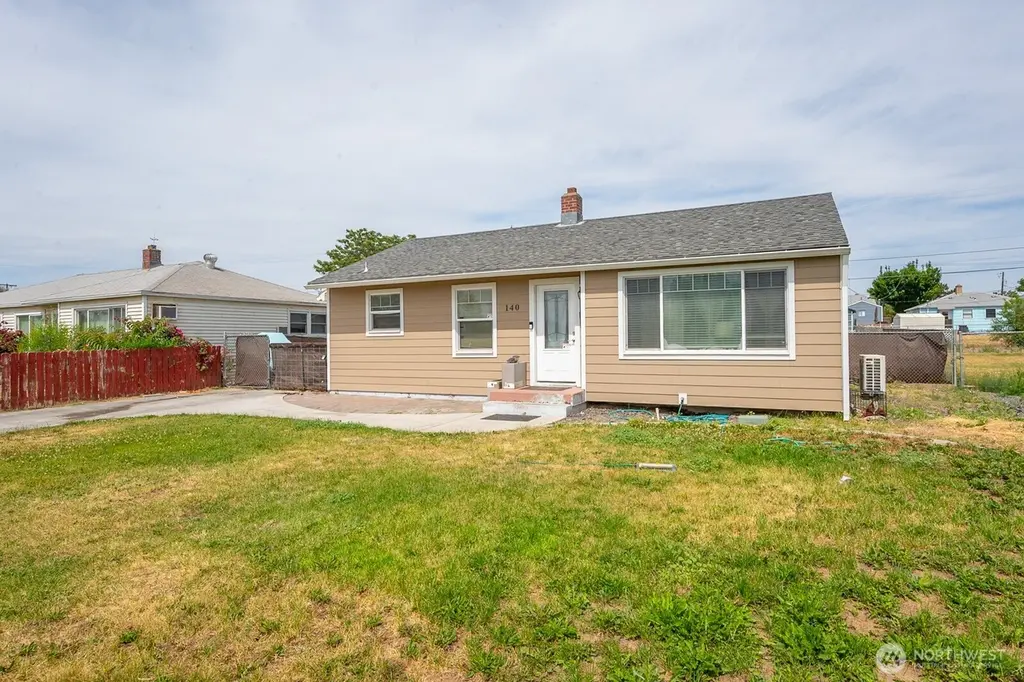
140 W Northshore Dr · Moses Lake, WA
Flood risk 1/10 · Minimal
- FEMA flood zone
- X (unshaded)
- Chance of flooding over 30 yrs
- 0.0%
- Est. flood insurance / yr
- $507 – $1,088
Fire risk 3/10 · Minor
- Est. fire insurance / yr
- $604 – $1,122
Heat risk 4/10 · Minor
- Hot days now (above 96°F)
- 7 days/yr
- Hot days in 30 yrs
- 16 days/yr
Wind risk 1/10 · Minimal
- Chance of severe wind over 30 yrs
- —
Air-quality risk 7/10 · Major
- Unhealthy air days now
- 12 days/yr
- Unhealthy air days in 30 yrs
- 14 days/yr
Risk factors via First Street. Map © Google.
Why this score? — see what drove the D grade
The composite is a weighted blend of 9 inputs, each scored 0–100. Each bar is that input's sub-score; the figure is the points it added to the 100-point composite (weight × sub-score).
- ARV discount +13.4/15.0
- Cash flow +11.9/30.0
- Schools +3.9/10.0
- Livability +3.8/5.0
- DSCR +3.5/10.0
- 1% rule +2.9/10.0
- Condition / age +2.5/5.0
- Rent growth +2.1/5.0
- Appreciation +0.0/10.0
$199,000
🖨 Deal sheet (PDF) 📄 Offer letter ✓ Due diligence
Listing remarks
Move in ready rambler on Northshore Drive! Conveniently located near the water and in the heart of town near restaurants, shopping & more. This 3 bed 1 bath home features hardwood floors, natural light and a functional layout. UPGRADES INCLUDE: New Mitsubishi Split System and Cement Plank Exterior Siding both installed in 2022. Bring your toys! Plenty of room for a boat or RV parking. The property boasts a fully fenced backyard and garage. Call to schedule a showing today!
Key facts
- Near the water
- Near shopping
- Near restaurants
Tags
Property features AI
Finance
- Other: Listing active; Living area reported as 928 square feet
- Financial info: Offers accepted: Cash, Conventional, FHA, VA
Exterior
- Parking: Detached garage (2 covered spaces); Driveway
- Security: Partially fenced; Security system
- Utilities: Electric energy source; Public water (City of Moses Lake); Sewer connected (City of Moses Lake); Power provided by Grant County PUD; Water heater located in bedroom
- Home design: Single-family house; One story; Main-level entry; Built on lot
- Construction: Metal/vinyl exterior; Composition roof; Poured concrete foundation; Effective year built 1980
- Exterior features: Partially fenced yard; Garden space; Outbuildings; Sprinkler system; High speed internet available; Curbs, paved streets, and sidewalks
Interior
- Kitchen: Kitchen (without eating space)
- Bedrooms: 3 bedrooms (all on main level)
- Flooring: Ceramic tile; Hardwood; Laminate; Carpet
- Bathrooms: 1 full bathroom (main level) with bathtub and shower
- Heating & cooling: Forced air heating; Central air conditioning
- Interior features: Dining room; Security system; Entry hall; Living room; Utility room
- Laundry & utility: Utility room
Neighborhood map
What this means for you Summary
Snapshot
- This is a 3-bed/1.0-bath single-family listed at $199k.
Deal economics
- At list price, monthly cash flow is $-49 ($-591/yr) — negative.
- To cash-flow at today's rent, offer at most $190k (4.4% below list).
- To meet the 1% rule (rent ≥ 1% of price), the offer needs to be $157k (21.3% below list).
- Recommended offer: $157k (21.3% below list) — sets the bar for 1% rule.
- Cap rate 6.0% vs local median 3.3% in Moses Lake — top-decile yield for the area; either an underpriced asset or a hidden risk that comps aren't pricing in. Stress-test before assuming the spread holds.
Location & tenants
- Location reads 75/100 on livability (#170 in WA, #4,228 nationally) — a middle-class / working-renter tenant base. Strengths: housing A+, health & safety A+, amenities A-; Watch: employment C-, crime F, commute F.
- Moses Lake School District (town): math 38% / reading 48% proficiency, ranked #198 of 291 in WA (top 68%) — families likely to look elsewhere, expect single-tenant / working-renter base with shorter leases.
- Zoned schools: Knolls Vista Elementary (283 students, 80% FRL); Frontier Middle School (758 students, 72% FRL); Moses Lake High School (1,984 students, 64% FRL) — zoned schools average 72% FRL vs 53% district-wide (19 pts higher); higher-poverty schools than district average — tighter screening recommended.
- Market conditions: Rents soft (-1.7%/yr); 590 active listings in the ZIP; 9 comparable units currently listed for rent nearby; rentals lingering (median 46d on market — plan ~5-8 weeks vacancy on turnover, expect pricing pressure); 100% of comp listings sitting > 30 days — soft ceiling on asking rent; 559 units permitted in Grant County in 2024 (35 in 5+ unit buildings).
Forward outlook
- Local home prices are declining (-3.0%/yr); year-one equity from $1k of loan paydown is wiped out by about $6k of value loss. Plan a longer hold.
- Grant County population projected at +16% by 2050 — long-run rental-demand tailwind backs the buy-and-hold thesis.
Negotiation context
- It's been on market 24 days — a 2% lower offer ($196k) is reasonable based on typical stale-listing flexibility.
- 2 sale attempts since 15y ago; this cycle's ask is 23% above the opening price — seller raised mid-cycle; expect resistance to lowballs.
- Current owner paid $155k; 28% above their basis — modest negotiation headroom, anchor on the comps not their cost.
Risks & watch-outs
- Watch-outs: built in 1949 — expect roof / HVAC / electrical / plumbing capex.
Questions for the listing agent
- What do current leases actually rent for vs. the listed asking? Can we see a recent rent roll and the last 12 months of T-12 income?
- Built in 1949 — when were the roof, HVAC, electrical panel, plumbing, and water heater last replaced?
- Is there a deadline driving the sale (1031 exchange, divorce, estate, relocation)? That informs how much negotiation room exists.
- Schools are D-rated, which usually means shorter tenancies and higher turnover. Who's the typical renter profile here, and what's been the actual vacancy rate?
- Crime grade is F in this area — have there been break-ins, vandalism, or insurance claims at this property in the last 3 years? What carrier currently insures it and at what premium?
- The area grade is low — what's the realistic commute time and amenity access for the typical tenant pool here? Any planned neighborhood developments (good or bad) we should know about?
- What's the average days-on-market for RENTAL listings here right now (not sales)? A rising rental-DOM trend means longer vacancies and softer asking-rent achievability than the comps imply.
- What's the recent tenant-quality profile in this submarket — average credit score on applications, eviction rate, late-payment / NSF rate, and stable-employment percentage? A property-management company in the area should have these aggregated.
- How much new for-sale + rental construction is in the pipeline within 1–3 miles? Heavy new supply typically softens prices + rents 12–24 months out; constrained supply supports both.
Investment metrics
- 1% rule
- 0.79% ✗
- Cap rate
- 6.00%
- Cash-on-cash
- -1.06%
- DSCR
- 0.95
- GRM
- 10.6
CMA / ARV
- ARV (median comp)
- $229,003
- List price
- $199,000
- Delta
- -13.10%
- Verdict
- UNDERPRICED
- Comps
- 20 within 1.0 mi
Show comp detail 9 sales within ~0.75 mi
| Address | Dist | Beds/Ba | Sqft | Sold | Price | $/sf | Match |
|---|---|---|---|---|---|---|---|
| 614 W Loop Dr | 0.39mi | 3/1.0 | 962 (+4%) | 2mo | $265,000 | $275 | 74 |
| 312 W Ridge Rd | 0.17mi | 2/1.0 (-1) | 938 (+1%) | 14mo | $235,000 | $251 | 74 |
| 114 W Knolls Vista Dr | 0.09mi | 3/1.0 | 1,040 (+12%) | 3mo | $190,000 | $183 | 73 |
| 214 W Knolls Vista Dr | 0.07mi | 3/1.0 | 1,047 (+13%) | 5mo | $239,900 | $229 | 71 |
| 207 W Loop Dr | 0.15mi | 2/1.0 (-1) | 864 (-7%) | 9mo | $255,000 | $295 | 69 |
| 136 W Northshore Dr | 0.01mi | 2/1.0 (-1) | 814 (-12%) | 20mo | $245,000 | $301 | 58 |
| 403 W Loop Dr | 0.21mi | 3/1.0 | 836 (-10%) | 21mo | $218,000 | $261 | 56 |
| 513 W Meridian | 0.42mi | 3/1.0 | 962 (+4%) | 23mo | $247,000 | $257 | 56 |
| 437 N Washington St | 0.54mi | 3/2.0 | 1,003 (+8%) | 23mo | $294,000 | $293 | 38 |
Match score weights: distance 35% · size 25% · config 20% · recency 20%. Top-matched comps best support the ARV.
Projected returns pro-forma
-3.0% appreciation · 0.0% rent growth · sell at horizon
- IRR
- -21.3%
- Equity multiple
- 0.28×
- Total profit
- $-40,002
- Equity at exit
- $29,672
- IRR
- -23.2%
- Equity multiple
- -0.02×
- Total profit
- $-56,728
- Equity at exit
- $17,206
Cash invested: $55,720 (down + closing). Projections, not guarantees.
Landlord ↔ Tenant lean methodology
- Overall (STATE)
- 28 Tenant-Leaning
- State Washington
- 28 Tenant-Leaning · D+8
- County
- — inherits STATE
- City
- — inherits STATE
ZIP-level market 98837
- Rents YoY
- -1.7%
- Active inventory
- 590
- Price-to-rent
- 10.6×
Monthly cashflow live
- Estimated rent
- $1,565 high interval (Pro) →
- Mortgage (P&I)
- −$1,044
- Tax from tax record
- −$159 /mo · $1,913/yr
- Insurance
- −$83
- HOA
- −$0
- Vacancy / Maint / Mgmt
- −$329
- Net cashflow
- $-49
Break-even live
Sensitivity live
| Price | -10% $63 | -5% $7 | +0% $-49 | +5% $-106 | +10% $-162 |
|---|---|---|---|---|---|
| Rent | -10% $-173 | -5% $-111 | +0% $-49 | +5% $13 | +10% $74 |
| Rate | -1.0pp $51 | -0.5pp $1 | base $-49 | +0.5pp $-101 | +1.0pp $-153 |
UW: 25.0% down · 7.5% · 30yr · 1.5% tax · 5.0% vac · 8.0% maint · 8.0% mgmt
Financing live
Cash to close
- Down payment
- $49,750
- Closing costs
- $5,970
- Reserves months
- —
- Total cash needed
- —
Loan-product check · same deal, 3 products live
Conventional
25% down · 7.5% · 30yr
- Down + closing
- —
- Monthly P&I
- —
- Monthly cashflow
- —
- DSCR
- —
- Eligible?
- —
Personal DTI + credit; lowest rate.
DSCR
20% down · 8.5% · 30yr
- Down + closing
- —
- Monthly P&I
- —
- Monthly cashflow
- —
- DSCR
- —
- Eligible?
- —
No personal income docs; deal must DSCR.
Hard money
10% down · 12.0% · 12mo
- Down + closing
- —
- Monthly P&I
- —
- Monthly cashflow
- —
- DSCR
- —
- Eligible?
- —
Short-term bridge; refi at stabilization.
Rent comps 9 comps
| Address | Beds | Baths | Sqft | Rent | $/sqft | DOM | Units | Dist |
|---|---|---|---|---|---|---|---|---|
| 615 S Alder St #02 Moses Lake, WA | 2.0 | 1.0 | 742 | $1,200 | $1.62 | 45d | 1 | 0.65mi |
| 1133 N Grape Dr Moses Lake, WA | 1.0–2.0 | 1.0–2.0 | 859 | $1,825 | $2.12 | 45d | 12 | 0.83mi |
| 300 E 9th Ave Moses Lake, WA | 1.0–3.0 | 1.0–2.0 | 1003 | $1,699 | $1.69 | 45d | 19 | 0.88mi |
| 1050 S Division St Moses Lake, WA | 1.0–2.0 | 1.0 | 675 | $1,309 | $1.94 | 45d | 14 | 1.16mi |
| 1206 W Columbia Ave Unit D Moses Lake, WA | 2.0 | 1.0 | 900 | $1,295 | $1.44 | 45d | 1 | 1.17mi |
| 1205 W Ivy Ave Unit 101 Moses Lake, WA | 2.0 | 1.0 | 900 | $1,150 | $1.28 | 45d | 1 | 1.18mi |
| 1211 W Ivy Ave Unit 203 Moses Lake, WA | 2.0 | 1.0 | 900 | $1,250 | $1.39 | 45d | 1 | 1.19mi |
| 931 E Hill Ave Moses Lake, WA | 2.0 | 2.0 | 1108 | $1,600 | $1.44 | 45d | 1 | 1.33mi |
| 1104 S Grand Dr Moses Lake, WA | 2.0 | 1.0 | 693 | $1,200 | $1.73 | 45d | 1 | 1.34mi |
Listing history 20 events
-
2026-06-09days on market $199,000 Active 24 DOM
-
2026-06-08days on market $199,000 Active 23 DOM
-
2026-06-07days on market $199,000 Active 22 DOM
-
2026-06-05days on market $199,000 Active 19 DOM
-
2026-06-03days on market $199,000 Active 18 DOM
-
2026-06-02statusdays on market $199,000 Active 17 DOM
-
2026-05-11status Active
-
2026-04-22$199,000 Active
-
2019-05-02soldstatus $155,000 Sold
-
2019-05-02soldstatus $155,000
-
2019-03-20status Pending
-
2018-11-05$162,000 Active
-
2012-01-05soldstatus $77,000 Sold
-
2011-11-22status Pending
-
2011-11-09status Pending Inspection
-
2011-10-26$77,000 Active
-
2004-04-09soldstatus $75,000
-
1991-08-26soldstatus $39,726
-
1988-03-16soldstatus $34,800
-
1980-09-01soldstatus $35,000
ⓘ Source: listings_history table (triggers on properties + properties_extension) + one-shot
backfill from property_details.listing_events for pre-trigger history.
Tax reassessment forecast WA · Resets to sale price
- Current annual tax
- $1,913 · $159/mo
- Projected year-2 tax
- $1,950 · $163/mo
- Expected delta
- +$38/yr (+$3/mo · 2.0%)
ⓘ Screening estimate from a state-policy table — verify with the county assessor before closing.
Climate risk First Street
- Flood 1/10 Low FEMA zone X (unshaded) · 0% chance over 30 yrs
- Wildfire 3/10 Moderate
- Heat 4/10 Moderate 7 d/yr ≥96°F today · 16 d/yr by 30 yrs out
- Wind 1/10 Low
- Air quality 7/10 Severe 12 unhealthy d/yr today · 14 by 30 yrs out
Nearby sold comps map
Loading sold comps map…
Walkable amenities ~0.75 mi
Loading nearby amenities…
Taxation est. · year 1
- Rental income
- $18,784
- − Mortgage interest
- −$11,147
- − Property taxes
- −$1,913
- − Insurance
- −$995
- − Repairs & maintenance
- −$1,503
- − Management
- −$1,503
- − Depreciation
- −$5,789
- Taxable loss
- −$4,065
- Est. tax savings @ 24.0%
- +$976
- After-tax cash flow
- $385/yr
For passive investors: Depreciation is non-cash, so a rental often shows a tax loss while cash-flowing — sheltering income. Rental losses are passive: they offset passive income freely, and up to $25,000/yr can offset ordinary (W-2) income if you actively participate and your MAGI is under $100k (phasing out to $0 by $150k); unused losses carry forward. On sale, claimed depreciation is recaptured at up to 25%, and gains may owe capital-gains tax (a 1031 exchange can defer both). Figures are a year-1 estimate at your 24.0% rate — not tax advice; consult a CPA.
Schools (NCES district)
- District
- Moses Lake School District
- NCES district ID
- 5305220
- Math proficiency
- 38% ▬ 0.00%
- Reading proficiency
- 48% ▼ -1.00%
- Median HH income
- $49,033
- Composite
- 39.17/100
- National rank
- #8232
- State rank
- #198 of 291 in WA
Livability — Moses Lake
- Score
- 75/100
- State rank
- #170
- US rank
- #4228
Category grades
Schools grade is shown separately in the Schools card above.
Census & demographics
- Census place
- Moses Lake, WA
- County
- Grant County · 61,643 people
- City population
- 49,455
- Metro
- Moses Lake, WA
- Population (ZIP)
- 49,455
- Household income
- $74,586
- Rent vs Own
- Severe rent burden
- 1064.0
Population outlook (Grant County) Hauer SSP2
- Today (2025)
- 99,356 people
- By 2030
- 102,107 · +2.8%
- By 2040
- 108,318 · +9.0%
- By 2050
- 114,712 · +15.5%
- By 2075
- 131,376 · +32.2%
- By 2100
- 146,163 · +47.1%
Race, ethnicity, and origin ACS 2023
- Neighborhood character
- Diverse neighborhood (Simpson 0.55)
- Race & ethnicity
- White 58% Hispanic / Latino 33% Two or more races 15% Black 2% Asian 1%
- Hispanic origin (detail)
- Mexican 30%
- Common ancestry
- Portuguese 3% Subsaharan African 2% Lithuanian 2%
- Foreign-born
- 10% · Canada
- Languages at home
- 76% English-only · Spanish 21% Russian/Polish/Slavic 2%
Political lean MEDSL · Grant
- 2024 margin
- Solid R (+37.5) · D 30.0% · R 67.4% · Other 2.6%
- 2008→2024 swing
- -9.9pp toward R · 2008: -27.5pp · 2024: -37.5pp
- All cycles
- 2024: R+37.5 2020: R+34.4 2016: R+37.9 2012: R+32.6 2008: R+27.5
Not yet ingested
- Civics
- —
Market trends
- HPI YoY
- ▼ -384.29%
- Current HPI
- 208.4574
- Rent YoY
- ▼ -1.72%
- Metro
- Moses Lake, WA
- State GDP YoY
- ▲ 4.65%
- F500 in state
- 22
Industry mix (Fortune 500 HQ in WA)
| Industry | F500 HQs | Revenue |
|---|---|---|
| Retail | 2 | $269B |
|
||
| Technology / Retail | 1 | $638B |
|
||
| Technology | 1 | $245B |
|
||
| Telecommunications | 1 | $38B |
|
||
| Food / Beverage | 1 | $36B |
|
||
| Automotive / Trucks | 1 | $34B |
|
||
Price history
+342.9% since first listed12 events — show timeline
- 2019-05-02 Sold (Public Records) $155,000 Public Records
- 2019-05-02 Sold (MLS) $155,000 NWMLS as Distributed by MLS Grid
- 2019-03-20 Pending — NWMLS as Distributed by MLS Grid
- 2018-11-05 Listed $162,000 NWMLS as Distributed by MLS Grid
- 2012-01-05 Sold (MLS) $77,000 NWMLS as Distributed by MLS Grid
- 2011-11-22 Pending — NWMLS as Distributed by MLS Grid
- 2011-11-09 Pending — NWMLS as Distributed by MLS Grid
- 2011-10-26 Listed $77,000 NWMLS as Distributed by MLS Grid
- 2004-04-09 Sold (Public Records) $75,000 Public Records
- 1991-08-26 Sold (Public Records) $39,726 Public Records
- 1988-03-16 Sold (Public Records) $34,800 Public Records
- 1980-09-01 Sold (Public Records) $35,000 Public Records
Property tax history
+3.5%/yrLatest (2026): $1,913 · +0.0% YoY. Source: county tax records.
Cash-flow waterfall
monthlySold comps — $/sqft
last 12 mo · ≤1 miLoading sold comps…