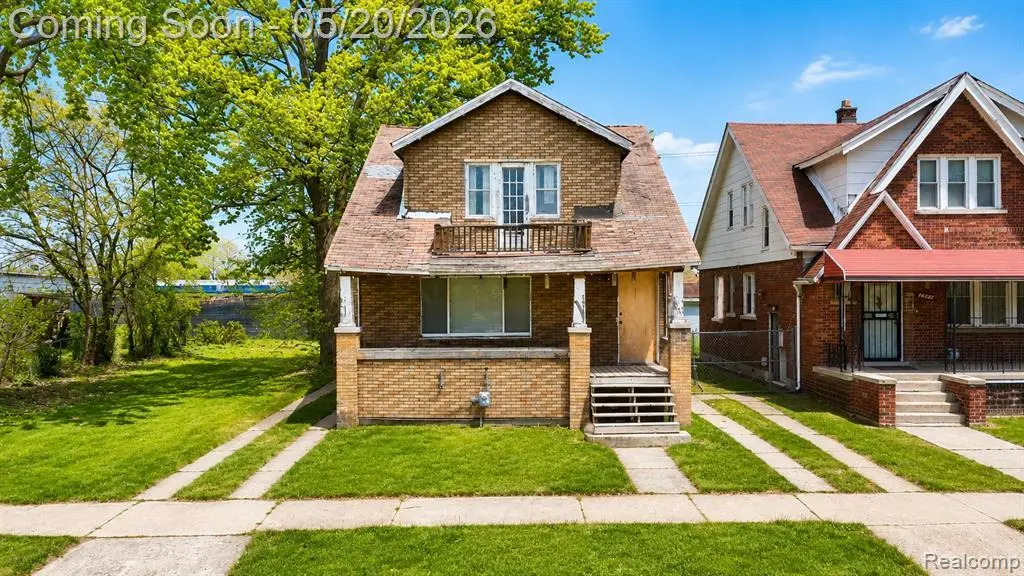
19989 Coventry St · Detroit, MI
Flood risk 1/10 · Minimal
- FEMA flood zone
- X (unshaded)
- Chance of flooding over 30 yrs
- 0.0%
- Est. flood insurance / yr
- $473 – $860
Fire risk 1/10 · Minimal
- Est. fire insurance / yr
- $784 – $1,456
Heat risk 3/10 · Minor
- Hot days now (above 97°F)
- 7 days/yr
- Hot days in 30 yrs
- 15 days/yr
Wind risk 2/10 · Minimal
- Chance of severe wind over 30 yrs
- —
Air-quality risk 4/10 · Minor
- Unhealthy air days now
- 4 days/yr
- Unhealthy air days in 30 yrs
- 6 days/yr
Risk factors via First Street. Map © Google.
Why this score? — see what drove the D grade
The composite is a weighted blend of 9 inputs, each scored 0–100. Each bar is that input's sub-score; the figure is the points it added to the 100-point composite (weight × sub-score).
- Cash flow +15.0/30.0
- ARV discount +7.5/15.0
- 1% rule +5.0/10.0
- DSCR +5.0/10.0
- Livability +3.7/5.0
- Rent growth +2.5/5.0
- Condition / age +2.5/5.0
- Schools +1.3/10.0
- Appreciation +0.0/10.0
$34,999
🖨 Deal sheet 📄 Offer letter ✓ Due diligence
Listing remarks MLS
GREAT STARTER HOME OR INVESTMENT OPPORTUNITY NEAR DETROIT FEATURES TWO SEPARATE UNITS, MAKING IT EASILY CONVERTIBLE INTO A TWO-FAMILY HOME. THIS HOME SITS ON A DOUBLE LOT AND INCLUDES A LARGE SIDE LOT AS WELL, OFFERING EXTRA SPACE AND EXCELLENT VALUE. MOST OF THE MAJOR WORK HAS ALREADY BEEN COMPLETED, PROVIDING A SOLID FOUNDATION FOR THE NEXT OWNER. IT JUST NEEDS SOME FINISHING TOUCHES AND COSMETIC UPDATES TO BRING OUT ITS FULL POTENTIAL. PERFECT FOR A FIRST-TIME BUYER OR AN INVESTOR LOOKING FOR A FLIP OR RENTAL OPPORTUNITY. CONVENIENTLY LOCATED NEAR SCHOOLS, PARKS, SHOPPING, AND MAJOR TRANSPORTATION ROUTES. SOLD AS-IS.
Key facts
- 3,485 sq ft lot
- Built 1926
- Listed 29 days
Property features AI
Exterior
- Parking: Driveway, no garage
- Utilities: Public water; Public sewer
- Home design: Single-family residence; Two levels; Ground-level entry
- Construction: Block foundation; Block and vinyl siding construction
- Exterior features: Paved road access; Lot approximately 0.08 acres (35 x 100)
Interior
- Bathrooms: 3 full bathrooms
- Heating & cooling: Forced air heating (natural gas); No cooling
- Interior features: Full unfinished basement; Total of 4 rooms
Neighborhood map
What this means for you Summary
Snapshot
- This is a 4-bed/1.5-bath single-family listed at $35k.
Deal economics
- At list price, monthly cash flow is $1k ($15k/yr) — positive.
- The deal already cash-flows at list — no discount required.
- Meets the 1% rule at list price ($2k rent vs $35k).
- Recommended offer: $34k (1.5% below list) — sets the bar for market timing.
- Cap rate 47.8% vs local median 10.2% in Detroit — top-decile yield for the area; either an underpriced asset or a hidden risk that comps aren't pricing in. Stress-test before assuming the spread holds.
Location & tenants
- Location reads 73/100 on livability (#218 in MI) — a middle-class / working-renter tenant base. Strengths: amenities A+, commute A+, cost of living A+; Watch: schools F, crime F, employment F.
- Detroit Public Schools Community District (urban): math 10% / reading 24% proficiency, ranked #499 of 540 in MI (top 92%) — low school quality limits family demand, transient renter base, plan for 1-2y turnover; 90% free/reduced lunch — lower-income household profile, screen leases tightly.
- Market conditions: 216 active listings in the ZIP; 10 comparable units currently listed for rent nearby; rentals at typical pace (median 15d on market — plan ~3-4 weeks tenant-placement turnaround); lower-income renter base — watch delinquency; 2,639 units permitted in Wayne County in 2024 (1,216 in 5+ unit buildings).
- At $1,832/mo this rent would consume 57% of the median local household income ($38k/yr) (locally 1192% of renters already pay >50% of income on rent) — very limited rent-growth headroom before tenants either downsize or default.
Forward outlook
- Local home prices are declining (-3.0%/yr); year-one equity from $242 of loan paydown is wiped out by about $1k of value loss. Plan a longer hold.
- Wayne County population projected at -17% by 2050 — secular population decline; favor cash flow + early exit over multi-decade hold.
- At projected returns (-3.0% appreciation + 3.0% rent growth), your $10k cash investment doubles in ~1 year — after that, you're playing with house money.
Negotiation context
- It's been on market 30 days — a 2% lower offer ($34k) is reasonable based on typical stale-listing flexibility.
- 2 sale attempts with the ask held roughly flat each time — persistent listings suggest the price (not the market) is what's stuck; bring a comps-based counter.
Risks & watch-outs
- Watch-outs: built in 1926 — expect roof / HVAC / electrical / plumbing capex.
Questions for the listing agent
- Built in 1926 — when were the roof, HVAC, electrical panel, plumbing, and water heater last replaced?
- Is there a deadline driving the sale (1031 exchange, divorce, estate, relocation)? That informs how much negotiation room exists.
- Schools are F-rated, which usually means shorter tenancies and higher turnover. Who's the typical renter profile here, and what's been the actual vacancy rate?
- Crime grade is F in this area — have there been break-ins, vandalism, or insurance claims at this property in the last 3 years? What carrier currently insures it and at what premium?
- The area grade is low — what's the realistic commute time and amenity access for the typical tenant pool here? Any planned neighborhood developments (good or bad) we should know about?
- What's the average days-on-market for RENTAL listings here right now (not sales)? A rising rental-DOM trend means longer vacancies and softer asking-rent achievability than the comps imply.
- What's the recent tenant-quality profile in this submarket — average credit score on applications, eviction rate, late-payment / NSF rate, and stable-employment percentage? A property-management company in the area should have these aggregated.
- How much new for-sale + rental construction is in the pipeline within 1–3 miles? Heavy new supply typically softens prices + rents 12–24 months out; constrained supply supports both.
Investment metrics
- 1% rule
- 5.23% ✓
- Cap rate
- 47.84%
- Cash-on-cash
- 148.39%
- DSCR
- 7.60
- GRM
- 1.6
CMA / ARV
- ARV (on-the-fly)
- $94,164
- Comps found
- 12
Show comp detail 12 sales within ~0.75 mi
| Address | Dist | Beds/Ba | Sqft | Sold | Price | $/sf | Match |
|---|---|---|---|---|---|---|---|
| 20070 Irvington St | 0.21mi | 3/1.5 (-1) | 1,515 (-5%) | 1mo | $89,900 | $59 | 76 |
| 250 W Hollywood | 0.74mi | 3/1.5 (-1) | 1,560 (-2%) | 6mo | $59,655 | $38 | 51 |
| 20172 Hull St | 0.69mi | 4/2.5 | 1,637 (+3%) | 15mo | $44,000 | $27 | 47 |
| 19657 Cardoni St | 0.53mi | 3/1.0 (-1) | 1,765 (+11%) | 4mo | $22,000 | $12 | 47 |
| 19344 Omira St | 0.48mi | 4/2.0 | 1,696 (+6%) | 22mo | $38,000 | $22 | 47 |
| 19208 Keating St | 0.49mi | 5/2.0 (+1) | 1,500 (-6%) | 23mo | $99,000 | $66 | 41 |
| 20011 Hull St | 0.64mi | 3/2.5 (-1) | 1,500 (-6%) | 12mo | $35,000 | $23 | 41 |
| 20207 Russell St | 0.58mi | 3/2.0 (-1) | 1,777 (+11%) | 9mo | $135,000 | $76 | 39 |
| 19189 Keating St | 0.50mi | 3/2.0 (-1) | 1,438 (-10%) | 17mo | $85,000 | $59 | 39 |
| 305 W Hayes Ave | 0.62mi | 3/1.5 (-1) | 1,365 (-14%) | 7mo | $230,000 | $168 | 36 |
| 800 E Bernhard Ave | 0.74mi | 3/1.0 (-1) | 1,390 (-13%) | 2mo | $175,000 | $126 | 35 |
| 231 W Brentwood St | 0.71mi | 3/1.0 (-1) | 1,489 (-7%) | 17mo | $72,000 | $48 | 34 |
Match score weights: distance 35% · size 25% · config 20% · recency 20%. Top-matched comps best support the ARV.
Projected returns pro-forma
-3.0% appreciation · 3.0% rent growth · sell at horizon
- IRR
- —
- Equity multiple
- 8.30×
- Total profit
- $71,536
- Equity at exit
- $5,218
- IRR
- —
- Equity multiple
- 17.51×
- Total profit
- $161,774
- Equity at exit
- $3,026
Cash invested: $9,800 (down + closing). Projections, not guarantees.
Landlord ↔ Tenant lean methodology
- Overall (STATE)
- 62 Landlord-Friendly
- State Michigan
- 62 Landlord-Friendly · EVEN
- County
- — inherits STATE
- City
- — inherits STATE
ZIP-level market 48203
- Home prices YoY
- -23.3%
- Active inventory
- 216
- Price-to-rent
- 1.6×
Monthly cashflow live
- Estimated rent
- $1,832 high interval (Pro) →
- Mortgage (P&I)
- −$184
- Tax from tax record
- −$37 /mo · $449/yr
- Insurance
- −$15
- HOA
- −$0
- Vacancy / Maint / Mgmt
- −$385
- Net cashflow
- $1,212
Break-even live
UW: 25.0% down · 7.5% · 30yr · 1.5% tax · 5.0% vac · 8.0% maint · 8.0% mgmt
Financing live
Cash to close
- Down payment
- $8,750
- Closing costs
- $1,050
- Reserves months
- —
- Total cash needed
- —
Loan-product check · same deal, 3 products live
Conventional
25% down · 7.5% · 30yr
- Down + closing
- —
- Monthly P&I
- —
- Monthly cashflow
- —
- DSCR
- —
- Eligible?
- —
Personal DTI + credit; lowest rate.
DSCR
20% down · 8.5% · 30yr
- Down + closing
- —
- Monthly P&I
- —
- Monthly cashflow
- —
- DSCR
- —
- Eligible?
- —
No personal income docs; deal must DSCR.
Hard money
10% down · 12.0% · 12mo
- Down + closing
- —
- Monthly P&I
- —
- Monthly cashflow
- —
- DSCR
- —
- Eligible?
- —
Short-term bridge; refi at stabilization.
Rent comps 10 comps
| Address | Beds | Baths | Sqft | Rent | $/sqft | DOM | Units | Dist |
|---|---|---|---|---|---|---|---|---|
| 329 W Muir Ave Hazel Park, MI | 4.0 | 2.0 | 1606 | $2,000 | $1.25 | 11d | 1 | 0.52mi |
| 20008 Hull St Highland Park, MI | 5.0 | 2.0 | 1332 | $1,600 | $1.20 | 16d | 1 | 0.68mi |
| 1330 E Chesterfield St Ferndale, MI | 4.0 | 2.0 | 1795 | $2,800 | $1.56 | 1d | 1 | 0.71mi |
| 1301 E Muir Ave Hazel Park, MI | 3.0 | 2.0 | 1236 | $1,600 | $1.29 | 22d | 1 | 0.75mi |
| 574 W Golden Gate Highland Park, MI | 3.0 | 1.0 | 1315 | $1,300 | $0.99 | 43d | 1 | 0.93mi |
| 1326 E Evelyn Ave Unit 1032332P Hazel Park, MI | 3.0 | 2.0 | 1097 | $6,448 | $5.88 | 1d | 1 | 1.01mi |
| 18503 Riopelle St Highland Park, MI | 3.0 | 1.0 | 1254 | $1,250 | $1.00 | 5d | 1 | 1.18mi |
| 19995 Goddard St Detroit, MI | 4.0 | 1.0 | 1292 | $1,400 | $1.08 | 22d | 1 | 1.24mi |
| 2554 Woodstock Dr Highland Park, MI | 3.0 | 1.5 | 1929 | $2,250 | $1.17 | 14d | 1 | 1.40mi |
| 1820 E Troy St Ferndale, MI | 3.0 | 1.0 | 1167 | $1,500 | $1.29 | 5d | 1 | 1.43mi |
Listing history 16 events
-
2026-06-18days on market $34,999 Active 30 DOM
-
2026-06-17days on market $34,999 Active 29 DOM
-
2026-06-15days on market $34,999 Active 27 DOM
-
2026-06-13days on market $34,999 Active 25 DOM
-
2026-06-13days on market $34,999 Active 24 DOM
-
2026-06-09days on market $34,999 Active 21 DOM
-
2026-06-08days on market $34,999 Active 20 DOM
-
2026-06-07days on market $34,999 Active 19 DOM
-
2026-06-04days on market $34,999 Active 16 DOM
-
2026-06-03days on market $34,999 Active 15 DOM
-
2026-06-02days on market $34,999 Active 14 DOM
-
2026-06-01days on market $34,999 Active 13 DOM
-
2026-05-31days on market $34,999 Active 12 DOM
-
2026-05-20$34,999 Active 627-char remark
Show marketing remark (627 chars)
GREAT STARTER HOME OR INVESTMENT OPPORTUNITY NEAR DETROIT FEATURES TWO SEPARATE UNITS, MAKING IT EASILY CONVERTIBLE INTO A TWO-FAMILY HOME. THIS HOME SITS ON A DOUBLE LOT AND INCLUDES A LARGE SIDE LOT AS WELL, OFFERING EXTRA SPACE AND EXCELLENT VALUE. MOST OF THE MAJOR WORK HAS ALREADY BEEN COMPLETED, PROVIDING A SOLID FOUNDATION FOR THE NEXT OWNER. IT JUST NEEDS SOME FINISHING TOUCHES AND COSMETIC UPDATES TO BRING OUT ITS FULL POTENTIAL. PERFECT FOR A FIRST-TIME BUYER OR AN INVESTOR LOOKING FOR A FLIP OR RENTAL OPPORTUNITY. CONVENIENTLY LOCATED NEAR SCHOOLS, PARKS, SHOPPING, AND MAJOR TRANSPORTATION ROUTES. SOLD AS-IS.
-
2026-05-20$34,999 Active
Show marketing remark (627 chars)
GREAT STARTER HOME OR INVESTMENT OPPORTUNITY NEAR DETROIT FEATURES TWO SEPARATE UNITS, MAKING IT EASILY CONVERTIBLE INTO A TWO-FAMILY HOME. THIS HOME SITS ON A DOUBLE LOT AND INCLUDES A LARGE SIDE LOT AS WELL, OFFERING EXTRA SPACE AND EXCELLENT VALUE. MOST OF THE MAJOR WORK HAS ALREADY BEEN COMPLETED, PROVIDING A SOLID FOUNDATION FOR THE NEXT OWNER. IT JUST NEEDS SOME FINISHING TOUCHES AND COSMETIC UPDATES TO BRING OUT ITS FULL POTENTIAL. PERFECT FOR A FIRST-TIME BUYER OR AN INVESTOR LOOKING FOR A FLIP OR RENTAL OPPORTUNITY. CONVENIENTLY LOCATED NEAR SCHOOLS, PARKS, SHOPPING, AND MAJOR TRANSPORTATION ROUTES. SOLD AS-IS.
-
2026-05-19historical $34,999 627-char remark
Show marketing remark (627 chars)
GREAT STARTER HOME OR INVESTMENT OPPORTUNITY NEAR DETROIT FEATURES TWO SEPARATE UNITS, MAKING IT EASILY CONVERTIBLE INTO A TWO-FAMILY HOME. THIS HOME SITS ON A DOUBLE LOT AND INCLUDES A LARGE SIDE LOT AS WELL, OFFERING EXTRA SPACE AND EXCELLENT VALUE. MOST OF THE MAJOR WORK HAS ALREADY BEEN COMPLETED, PROVIDING A SOLID FOUNDATION FOR THE NEXT OWNER. IT JUST NEEDS SOME FINISHING TOUCHES AND COSMETIC UPDATES TO BRING OUT ITS FULL POTENTIAL. PERFECT FOR A FIRST-TIME BUYER OR AN INVESTOR LOOKING FOR A FLIP OR RENTAL OPPORTUNITY. CONVENIENTLY LOCATED NEAR SCHOOLS, PARKS, SHOPPING, AND MAJOR TRANSPORTATION ROUTES. SOLD AS-IS.
ⓘ Source: listings_history table (triggers on properties + properties_extension) + one-shot
backfill from property_details.listing_events for pre-trigger history.
Tax reassessment forecast MI · Partial reset (capped growth)
- Current annual tax
- $449 · $37/mo
- Projected year-2 tax
- $494 · $41/mo
- Expected delta
- +$45/yr (+$4/mo · 10.1%)
ⓘ Screening estimate from a state-policy table — verify with the county assessor before closing.
Climate risk First Street
- Flood 1/10 Low FEMA zone X (unshaded) · 0% chance over 30 yrs
- Wildfire 1/10 Low
- Heat 3/10 Moderate 7 d/yr ≥97°F today · 15 d/yr by 30 yrs out
- Wind 2/10 Low
- Air quality 4/10 Moderate 4 unhealthy d/yr today · 6 by 30 yrs out
Nearby sold comps map
Loading sold comps map…
Walkable amenities ~0.75 mi
Loading nearby amenities…
Taxation est. · year 1
- Rental income
- $21,985
- − Mortgage interest
- −$1,960
- − Property taxes
- −$449
- − Insurance
- −$175
- − Repairs & maintenance
- −$1,759
- − Management
- −$1,759
- − Depreciation
- −$1,018
- Taxable income
- $14,865
- Est. tax owed @ 24.0%
- −$3,568
- After-tax cash flow
- $10,975/yr
For passive investors: Depreciation is non-cash, so a rental often shows a tax loss while cash-flowing — sheltering income. Rental losses are passive: they offset passive income freely, and up to $25,000/yr can offset ordinary (W-2) income if you actively participate and your MAGI is under $100k (phasing out to $0 by $150k); unused losses carry forward. On sale, claimed depreciation is recaptured at up to 25%, and gains may owe capital-gains tax (a 1031 exchange can defer both). Figures are a year-1 estimate at your 24.0% rate — not tax advice; consult a CPA.
Schools (NCES district)
- District
- Detroit Public Schools Community District
- NCES district ID
- 2601103
- Math proficiency
- 10% ▼ -2.00%
- Reading proficiency
- 24% ▲ 6.00%
- Median HH income
- $25,815
- Composite
- 13.06/100
- National rank
- #9564
- State rank
- #499 of 540 in MI
Livability — Detroit
- Score
- 73/100
- State rank
- #218
- US rank
- #5427
Category grades
Schools grade is shown separately in the Schools card above.
Census & demographics
- Census place
- Detroit, MI
- County
- Wayne County · 1,562,939 people
- Metro
- Detroit-Warren-Dearborn, MI
- Population (ZIP)
- 20,049
- Household income
- $38,404
- Rent vs Own
- Severe rent burden
- 1192.0
Population outlook (Wayne County) Hauer SSP2
- Today (2025)
- 1,675,273 people
- By 2030
- 1,620,300 · -3.3%
- By 2040
- 1,502,341 · -10.3%
- By 2050
- 1,384,039 · -17.4%
- By 2075
- 1,124,592 · -32.9%
- By 2100
- 881,193 · -47.4%
Race, ethnicity, and origin ACS 2023
- Neighborhood character
- Predominantly Black (85%)
- Race & ethnicity
- Black 85% White 8% Two or more races 5% Hispanic / Latino 2%
- Common ancestry
- Lithuanian 1%
- Foreign-born
- 2% · Canada
- Languages at home
- 95% English-only · Spanish 3% French/Haitian/Cajun 1%
Political lean MEDSL · Wayne
- 2024 margin
- Strong D (+29.0) · D 62.7% · R 33.7% · Other 3.6%
- 2008→2024 swing
- -20.5pp toward R · 2008: 49.5pp · 2024: 29.0pp
- All cycles
- 2024: D+29.0 2020: D+38.1 2016: D+37.3 2012: D+46.9 2008: D+49.5
Not yet ingested
- Civics
- —
Market trends
- HPI YoY
- ▼ -90.13%
- Current HPI
- 297.0176
- Rent YoY
- —
- Metro
- Detroit-Warren-Dearborn, MI
- State GDP YoY
- ▲ 1.37%
- F500 in state
- 28
Industry mix (Fortune 500 HQ in MI)
| Industry | F500 HQs | Revenue |
|---|---|---|
| Automotive Parts | 3 | $48B |
|
||
| Automotive | 2 | $372B |
|
||
| Chemicals | 1 | $45B |
|
||
| Automotive Retail | 1 | $29B |
|
||
| Healthcare / Medical Devices | 1 | $23B |
|
||
| Automotive Technology | 1 | $20B |
|
||
Price history
+0.0% since first listed3 events — show timeline
- 2026-05-20 Listed $34,999 MiRealSource-MiMLS
- 2026-05-20 Listed $34,999 REALCOMP
- 2026-05-19 Coming Soon $34,999 MiRealSource-MiMLS
Property tax history
+2.3%/yrLatest (2025): $449 · +1551.9% YoY. Source: county tax records.
Cash-flow waterfall
monthlySold comps — $/sqft
last 12 mo · ≤1 miLoading sold comps…